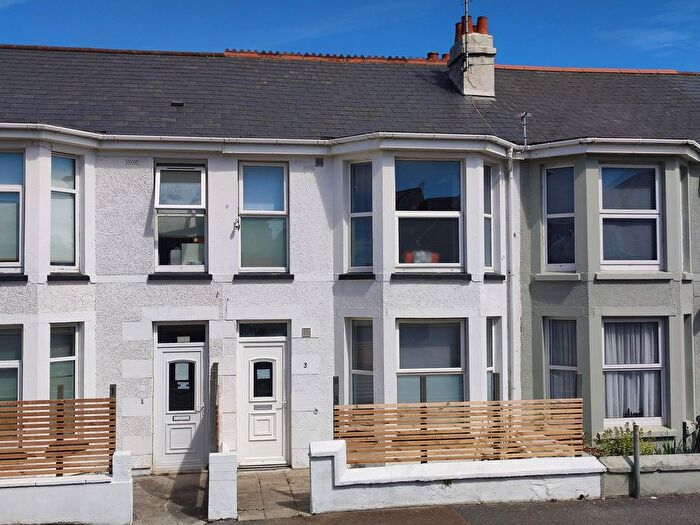
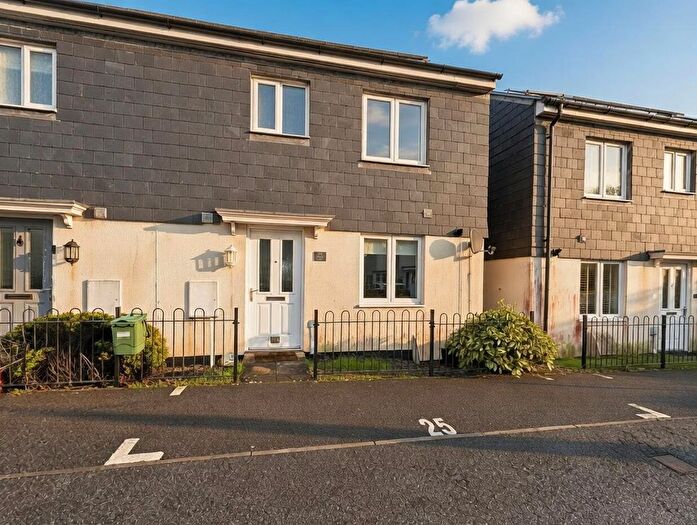
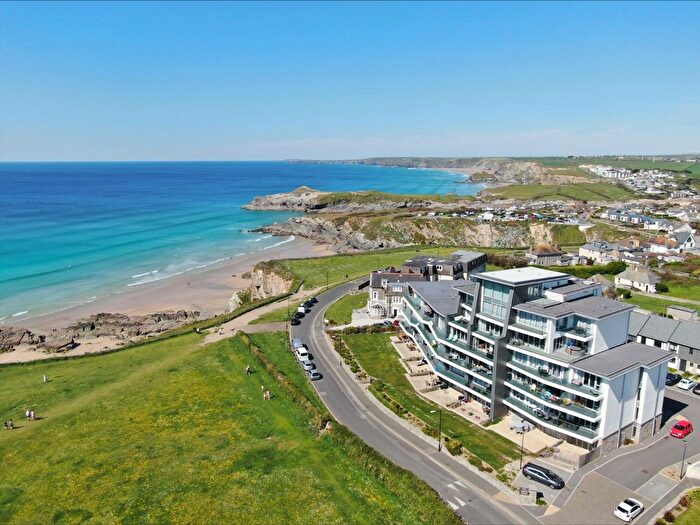
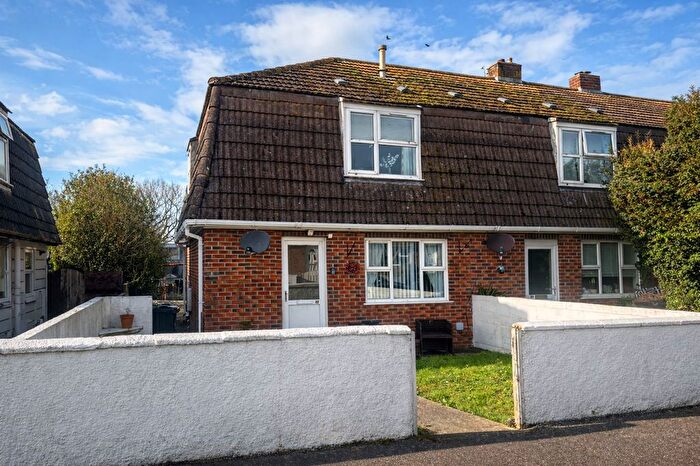
Houses for sale & to rent in Newquay Tretherras, Newquay
House Prices in Newquay Tretherras
Properties in Newquay Tretherras have an average house price of £365,929.00 and had 198 Property Transactions within the last 3 years¹.
Newquay Tretherras is an area in Newquay, Cornwall with 1,526 households², where the most expensive property was sold for £950,000.00.
Properties for sale in Newquay Tretherras
Roads and Postcodes in Newquay Tretherras
Navigate through our locations to find the location of your next house in Newquay Tretherras, Newquay for sale or to rent.
| Streets | Postcodes |
|---|---|
| Arundel Way | TR7 3AQ |
| Astor Court | TR7 2PD |
| Barrowfield View | TR7 2QH |
| Bedowan Meadows | TR7 2SN TR7 2SW TR7 2TB |
| Billings Drive | TR7 2SQ |
| Bonython Road | TR7 3AN TR7 3AU TR7 3AW TR7 3AX |
| Bosuen Road | TR7 3BA |
| Cardell Way | TR7 2RN |
| Carminow Way | TR7 3AY TR7 3AZ |
| Carmython Court | TR7 3AR |
| Carpmael Avenue | TR8 4NW |
| Carter Close | TR7 2SH |
| Chester Court | TR7 2SB |
| Chester Road | TR7 2RH TR7 2RT TR7 2RX |
| Chesterton Place | TR7 2RU |
| Clemens Close | TR7 2SG |
| Colvreath Road | TR7 2PY |
| Dukes Way | TR7 2RW |
| Earls Rise | TR7 2TA |
| Edgcumbe Avenue | TR7 2NL |
| Edgcumbe Gardens | TR7 2QD TR7 2FR TR7 2FS |
| Eliot Court | TR7 2QG |
| Eliot Gardens | TR7 2QE |
| Glamis Road | TR7 2RY |
| Henver Road | TR7 3BJ TR7 3BL TR7 3BN TR7 3FN TR7 3FP TR7 3FR |
| Hilgrove Mews | TR7 2FW |
| Hilgrove Road | TR7 2QT TR7 2QU TR7 2QW TR7 2QX TR7 2QY TR7 2QZ |
| Keynvor Close | TR7 2QQ |
| Kingsley Meade | TR8 4PY |
| Lusty Glaze Road | TR7 3AD TR7 3AE TR7 3AS TR7 3FH |
| Manewas Way | TR7 3AH |
| Narrowcliff | TR7 2RZ TR7 2FT TR7 2PJ TR7 2PS TR7 2QF TR7 2RS |
| Nathan Close | TR7 2SP |
| Pydar Close | TR7 3BS TR7 3BT |
| Shackleton Drive | TR7 3PE |
| St Annes Lane | TR7 2SD |
| St Annes Road | TR7 2SA |
| St Aubyn Crescent | TR7 2RQ |
| Towan Blystra Road | TR7 2RP |
| Trenance Park | TR7 2LZ |
| Trencreek Lane | TR8 4NX |
| Trencreek Road | TR8 4NP TR8 4NR TR8 4NS |
| Trerice Drive | TR7 2RL TR7 2TE |
| Tretherras Close | TR7 2RD |
| Tretherras Road | TR7 2RA TR7 2RB TR7 2TF TR7 2TG |
| Trevenson Road | TR8 4NU TR7 3BG TR7 3BH |
| Tuckers Close | TR8 4NT |
| Ulalia Road | TR7 2PZ TR7 2QA TR7 2FQ |
| Whitegate Road | TR7 2RF TR7 2RG |
| Whitegate Shopping Complex | TR7 3BP |
| Wild Flower Lane | TR7 2QB |
| Yeoman Way | TR7 2SL |
| TR7 2PL TR7 2PQ TR7 2PR TR7 2QN TR7 2RE |
Transport near Newquay Tretherras
- FAQ
- Price Paid By Year
- Property Type Price
Frequently asked questions about Newquay Tretherras
What is the average price for a property for sale in Newquay Tretherras?
The average price for a property for sale in Newquay Tretherras is £365,929. This amount is 0.27% higher than the average price in Newquay. There are 926 property listings for sale in Newquay Tretherras.
What streets have the most expensive properties for sale in Newquay Tretherras?
The streets with the most expensive properties for sale in Newquay Tretherras are Wild Flower Lane at an average of £545,000, Billings Drive at an average of £536,000 and Chester Road at an average of £520,000.
What streets have the most affordable properties for sale in Newquay Tretherras?
The streets with the most affordable properties for sale in Newquay Tretherras are Trencreek Road at an average of £145,333, Chesterton Place at an average of £153,750 and Astor Court at an average of £168,350.
Which train stations are available in or near Newquay Tretherras?
Some of the train stations available in or near Newquay Tretherras are Newquay, Quintrell Downs and St.Columb Road.
Property Price Paid in Newquay Tretherras by Year
The average sold property price by year was:
| Year | Average Sold Price | Price Change |
Sold Properties
|
|---|---|---|---|
| 2025 | £363,544 | -2% |
58 Properties |
| 2024 | £370,714 | 2% |
70 Properties |
| 2023 | £363,120 | -15% |
70 Properties |
| 2022 | £417,809 | 19% |
63 Properties |
| 2021 | £336,438 | 19% |
103 Properties |
| 2020 | £273,840 | 7% |
103 Properties |
| 2019 | £253,672 | -2% |
110 Properties |
| 2018 | £259,340 | -2% |
129 Properties |
| 2017 | £263,326 | 0,5% |
92 Properties |
| 2016 | £262,084 | 18% |
126 Properties |
| 2015 | £215,532 | -7% |
94 Properties |
| 2014 | £231,108 | 10% |
88 Properties |
| 2013 | £207,720 | 2% |
81 Properties |
| 2012 | £202,852 | -8% |
52 Properties |
| 2011 | £218,146 | -1% |
65 Properties |
| 2010 | £220,565 | 1% |
58 Properties |
| 2009 | £218,964 | -6% |
48 Properties |
| 2008 | £231,848 | -7% |
46 Properties |
| 2007 | £248,072 | 3% |
88 Properties |
| 2006 | £240,756 | 8% |
83 Properties |
| 2005 | £222,064 | 3% |
92 Properties |
| 2004 | £215,849 | 11% |
118 Properties |
| 2003 | £192,159 | 28% |
60 Properties |
| 2002 | £138,985 | 9% |
107 Properties |
| 2001 | £126,666 | 19% |
95 Properties |
| 2000 | £102,867 | 11% |
105 Properties |
| 1999 | £91,683 | 10% |
127 Properties |
| 1998 | £82,819 | 12% |
71 Properties |
| 1997 | £72,593 | 9% |
96 Properties |
| 1996 | £65,933 | 8% |
97 Properties |
| 1995 | £60,495 | - |
71 Properties |
Property Price per Property Type in Newquay Tretherras
Here you can find historic sold price data in order to help with your property search.
The average Property Paid Price for specific property types in the last three years are:
| Property Type | Average Sold Price | Sold Properties |
|---|---|---|
| Semi Detached House | £359,557.00 | 40 Semi Detached Houses |
| Detached House | £436,284.00 | 88 Detached Houses |
| Terraced House | £359,503.00 | 26 Terraced Houses |
| Flat | £234,810.00 | 44 Flats |

