
Houses for sale in Newquay Central, Newquay
House Prices in Newquay Central
Properties in Newquay Central have an average house price of £325k and had 269 Property Transactions within the last 3 years¹.
Newquay Central is an area in Newquay, Cornwall with 2,079 households², where the most expensive property was sold for £3M.
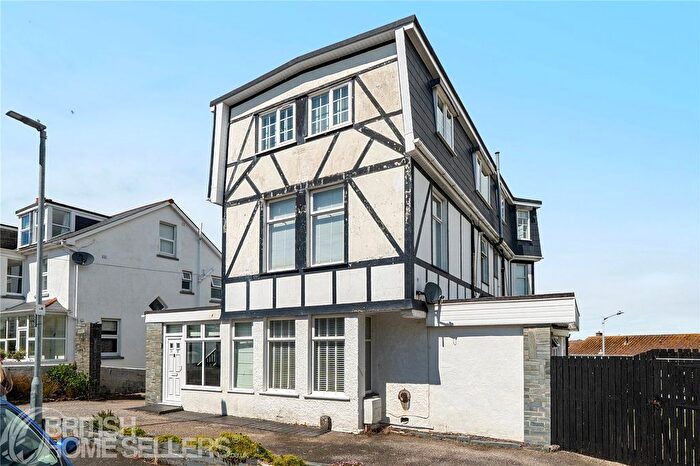
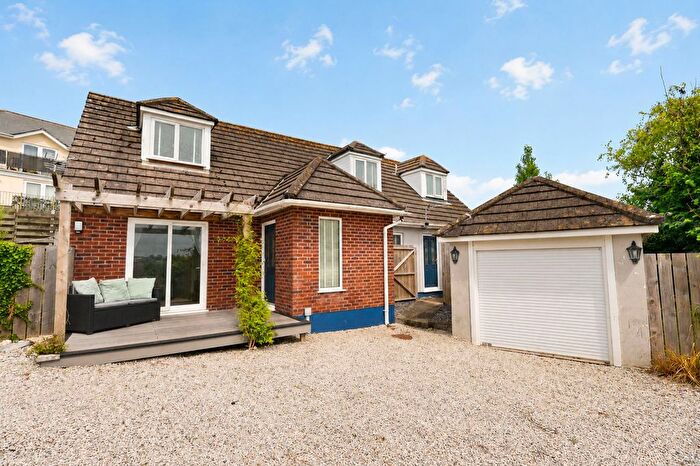
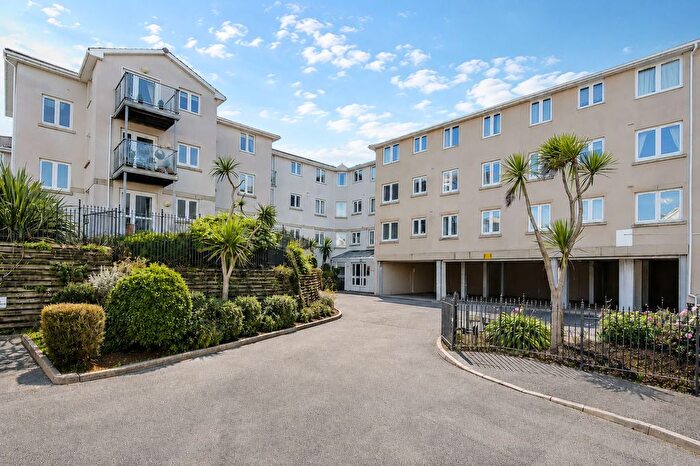
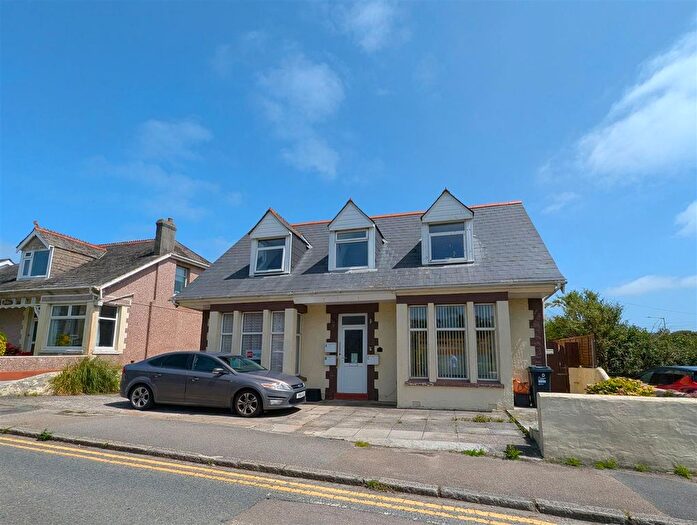
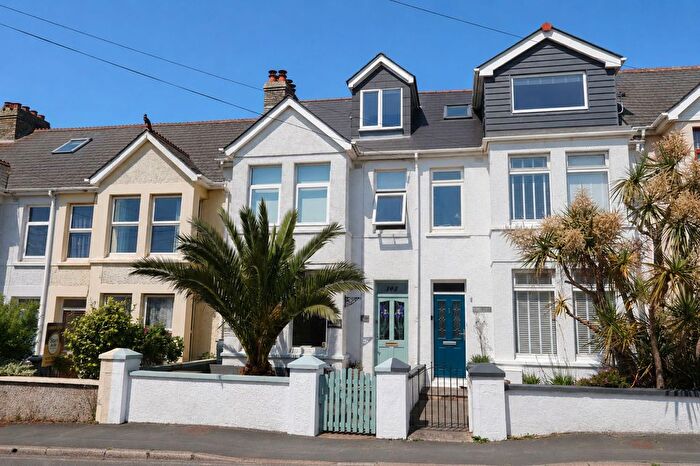
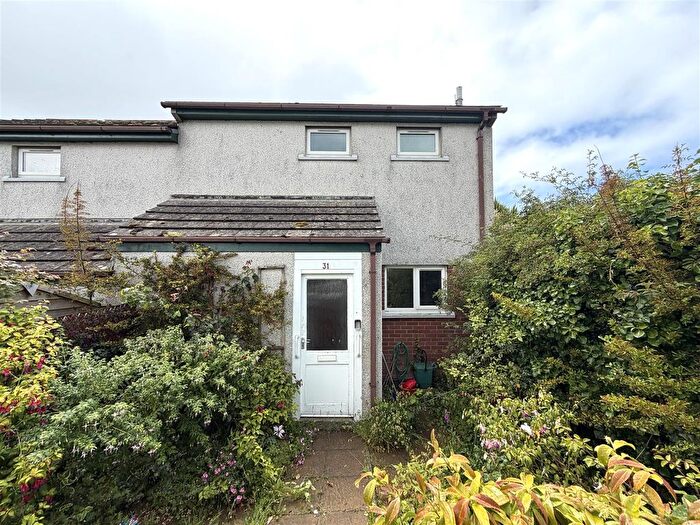
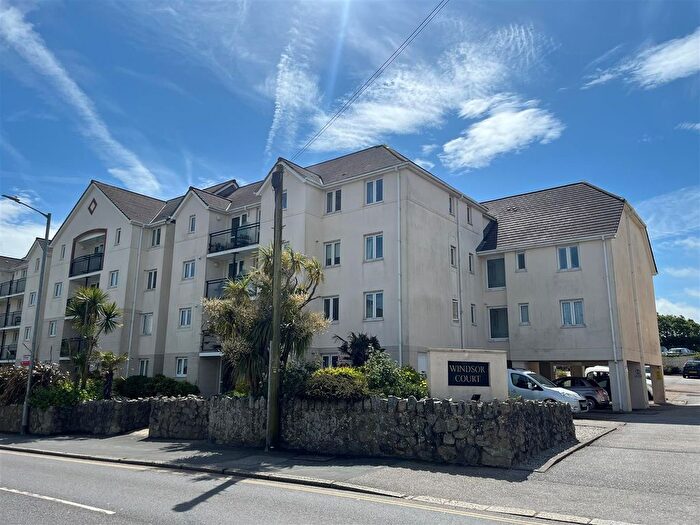
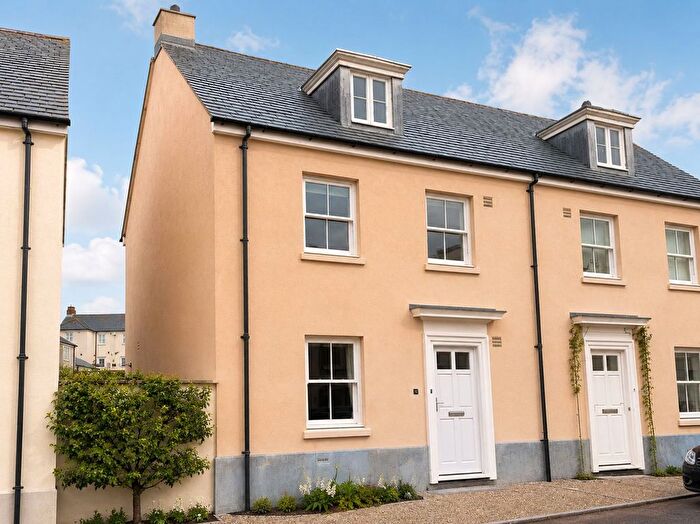
Properties for sale in Newquay Central
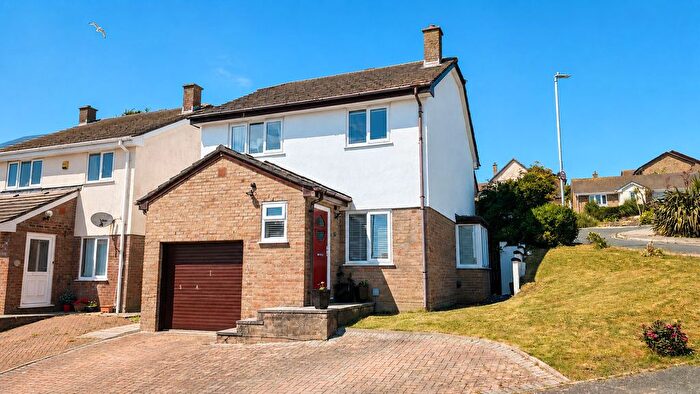
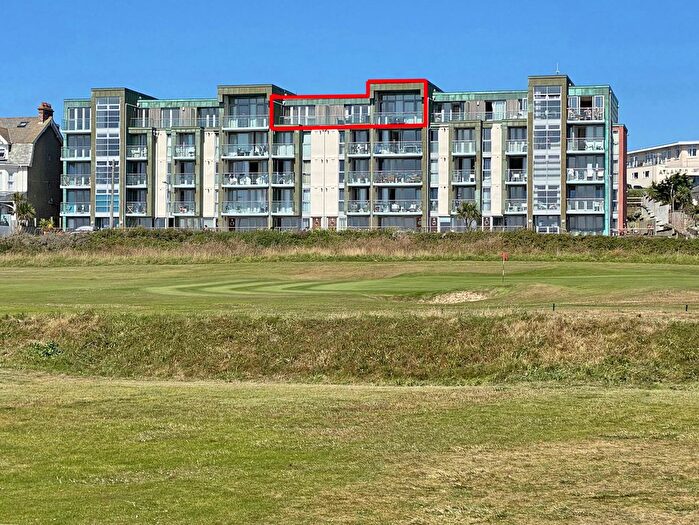
![]()
If you are looking to sell your house, let it out, or receive a property valuation, an expert can help you.
Click the button below to get started.
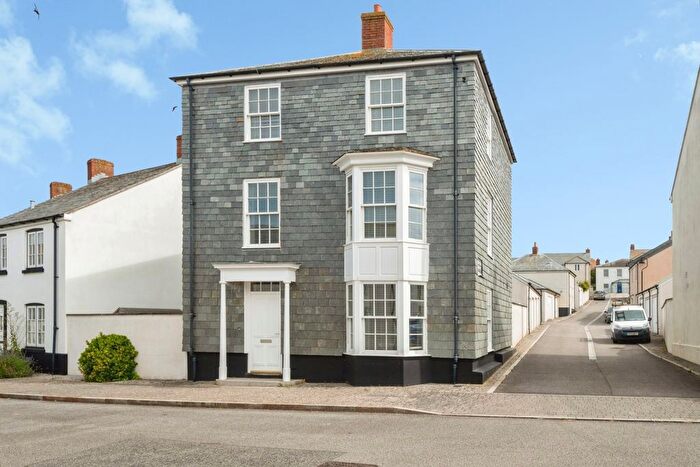
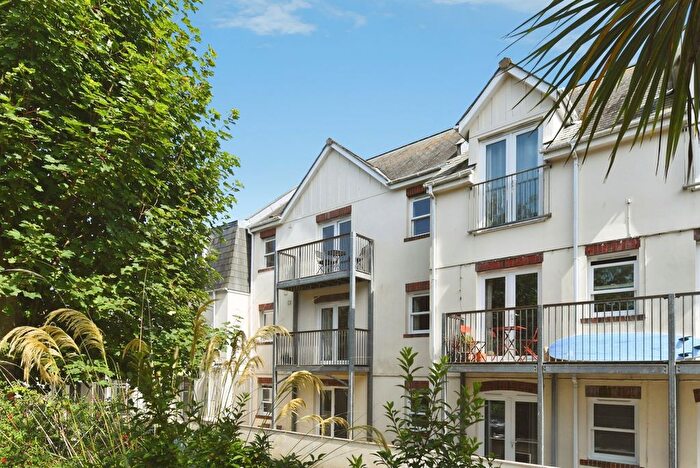
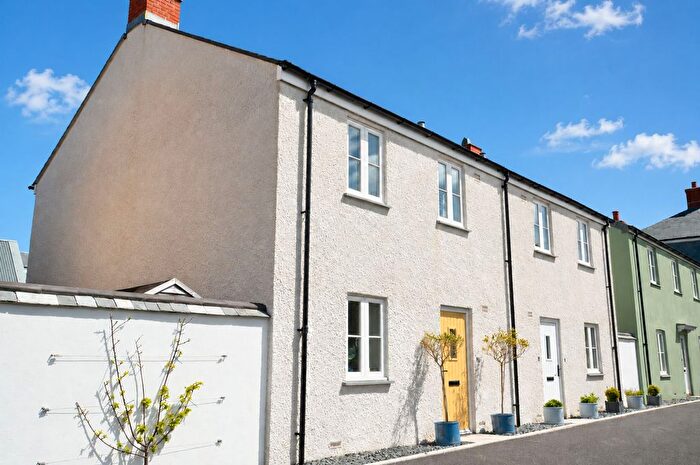
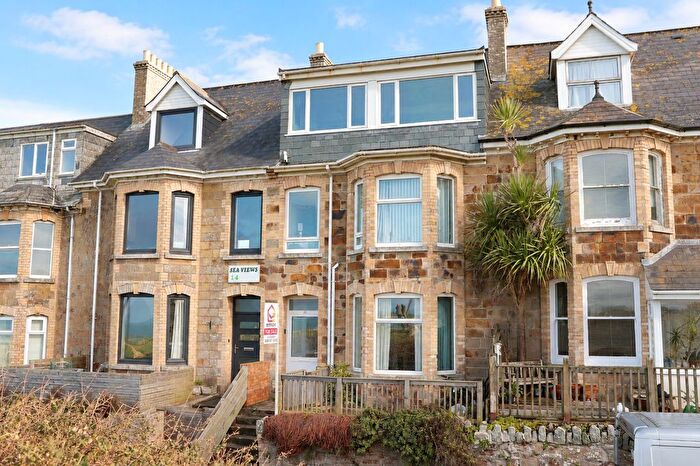
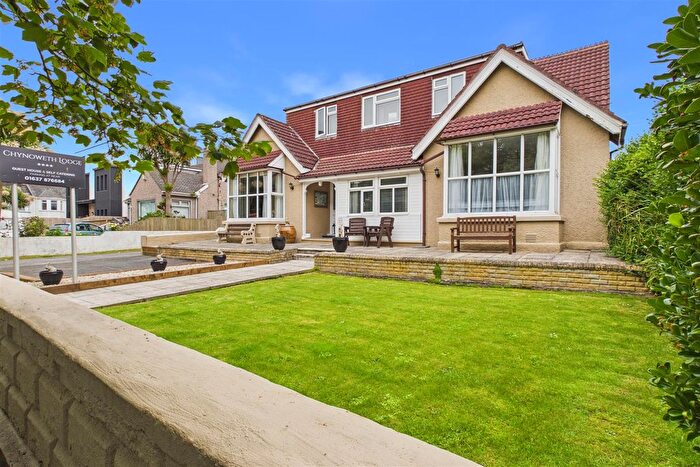
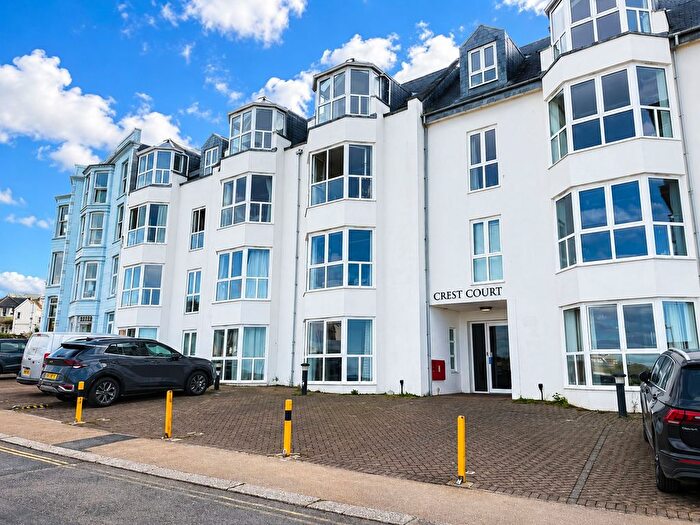
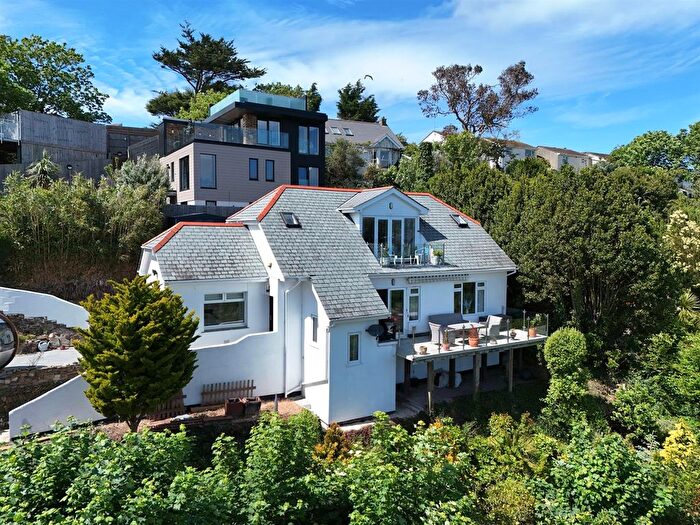
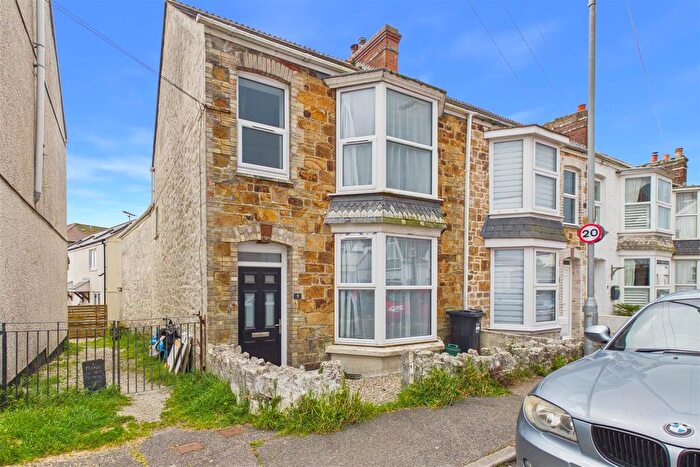
Previously listed properties in Newquay Central
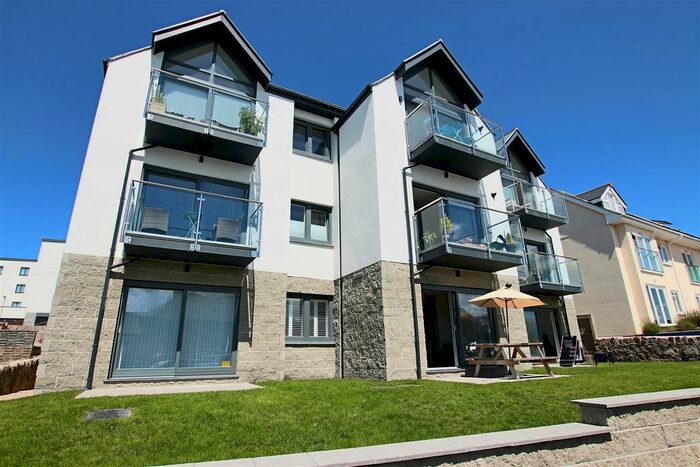
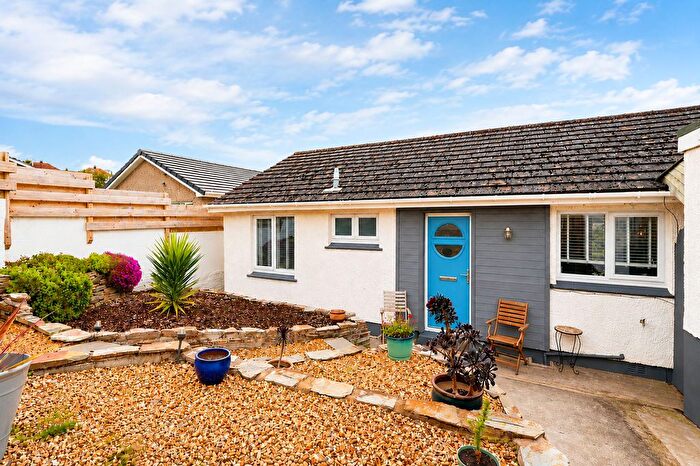
![]()
If you are looking to sell your house, let it out, or receive a property valuation, an expert can help you.
Click the button below to get started.
Roads and Postcodes in Newquay Central
Navigate through our locations to find the location of your next house in Newquay Central, Newquay for sale or to rent.
Property price trends in Newquay Central
According to the latest Land Registry data, the average home in Newquay Central sold for £242,500 in 2026. That figure comes from 3,163 sales logged over the past 31 years.
Prices have fallen back over the last three years. Compared with 2023, when the typical sale came in around £299,908, that's a fall of roughly 19.1%.
Looking back five years, average prices are down about 12.4% since 2021, a drop of around £34,177 in cash terms.
Zoom out to the past decade for the fuller picture. Back in 2016, homes here averaged £231,296, so the typical sold price has climbed about 4.8% since then, roughly 0.5% a year. Stretch the view to fifteen years and that annual pace edges up closer to 0.7%.
Frequently asked questions about Newquay Central
What is the average price for a property for sale in Newquay Central?
The average price for a property for sale in Newquay Central is £325,325. This amount is 11% lower than the average price in Newquay. There are 925 property listings for sale in Newquay Central.
What streets have the most expensive properties for sale in Newquay Central?
The streets with the most expensive properties for sale in Newquay Central are Island Crescent at an average of £1,401,666, Bothwicks Road at an average of £912,500 and Headland Road at an average of £642,545.
What streets have the most affordable properties for sale in Newquay Central?
The streets with the most affordable properties for sale in Newquay Central are Beachfield Avenue at an average of £130,071, Trevose Avenue at an average of £136,000 and Penhaven Court at an average of £138,001.
Which train stations are available in or near Newquay Central?
Some of the train stations available in or near Newquay Central are Newquay, Quintrell Downs and St.Columb Road.
Property Price Paid in Newquay Central by Year
The average sold property price by year was:
| Year | Average Sold Price | Price Change |
Sold Properties
|
|---|---|---|---|
| 2026 | £242,500 | -35% |
1 Property |
| 2025 | £327,387 | -6% |
109 Properties |
| 2024 | £346,329 | 13% |
84 Properties |
| 2023 | £299,908 | 4% |
75 Properties |
| 2022 | £287,194 | 4% |
96 Properties |
| 2021 | £276,677 | -2% |
136 Properties |
| 2020 | £283,582 | 27% |
93 Properties |
| 2019 | £207,982 | 4% |
118 Properties |
| 2018 | £198,706 | 0,3% |
154 Properties |
| 2017 | £198,026 | -17% |
111 Properties |
Property Price per Property Type in Newquay Central
Here you can find historic sold price data in order to help with your property search.
The average Property Paid Price for specific property types in the last three years are:
| Property Type | Average Sold Price | Sold Properties |
|---|---|---|
| Flat | £254,965.00 | 140 Flats |
| Semi Detached House | £319,214.00 | 21 Semi Detached Houses |
| Detached House | £691,136.00 | 11 Detached Houses |
| Terraced House | £386,714.00 | 97 Terraced Houses |
