
Houses for sale & to rent in DH1 2QQ, Glue Garth, Belmont, Durham
House Prices in DH1 2QQ, Glue Garth, Belmont
Properties in DH1 2QQ have no sales history available within the last 3 years. DH1 2QQ is a postcode in Glue Garth located in Belmont, an area in Durham, County Durham, with 3 households².
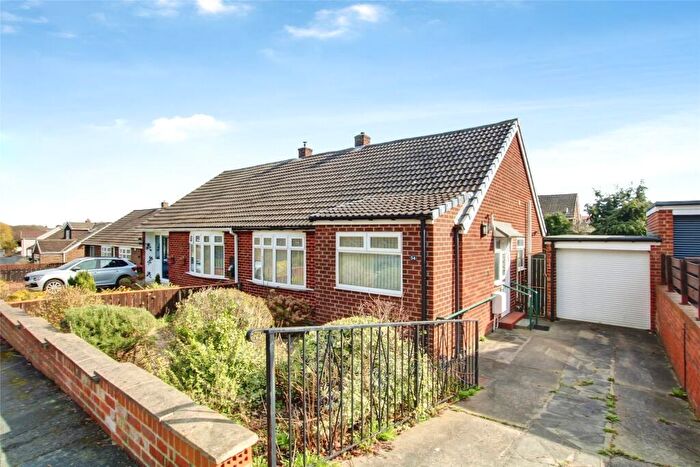
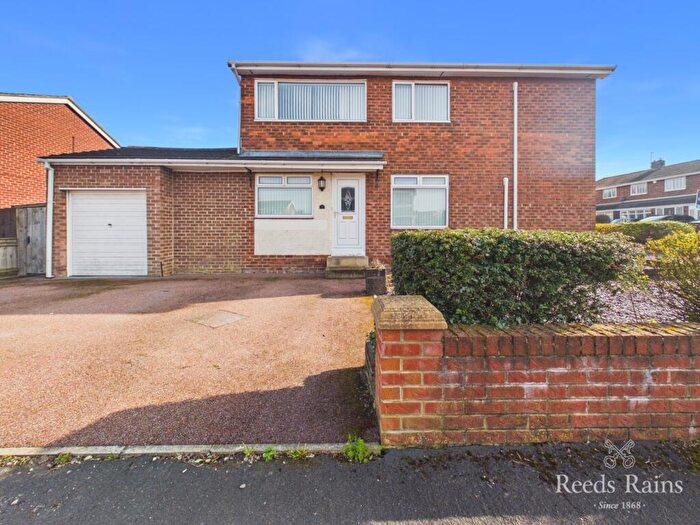
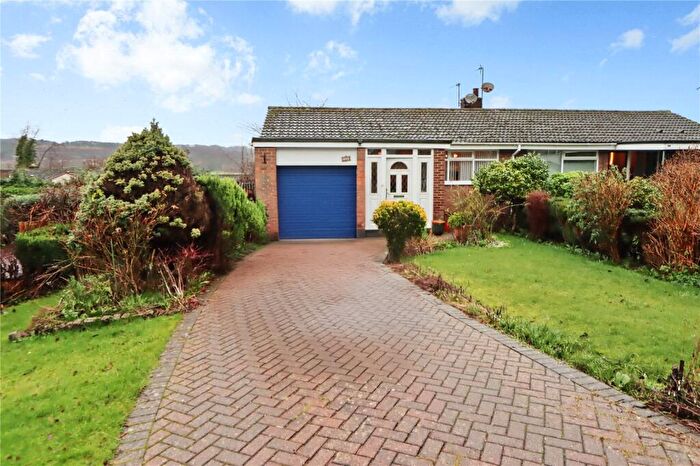
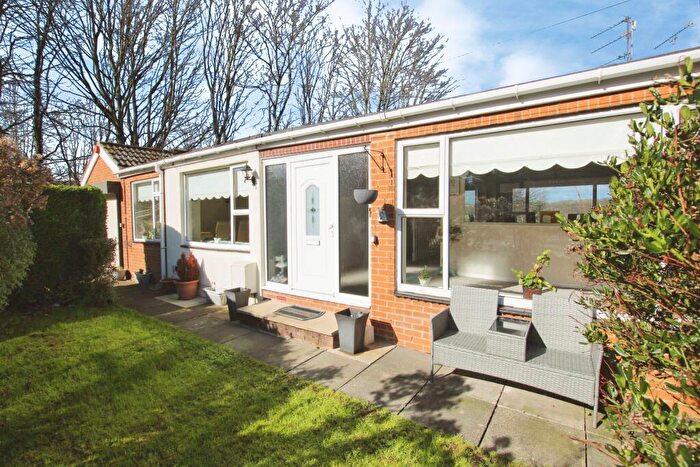
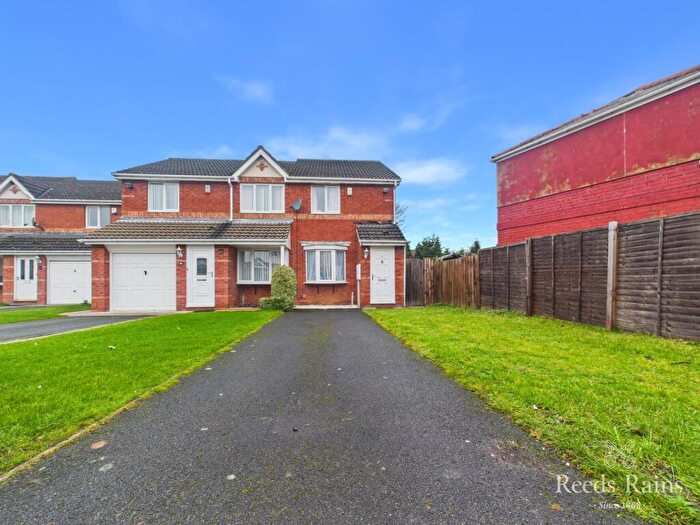
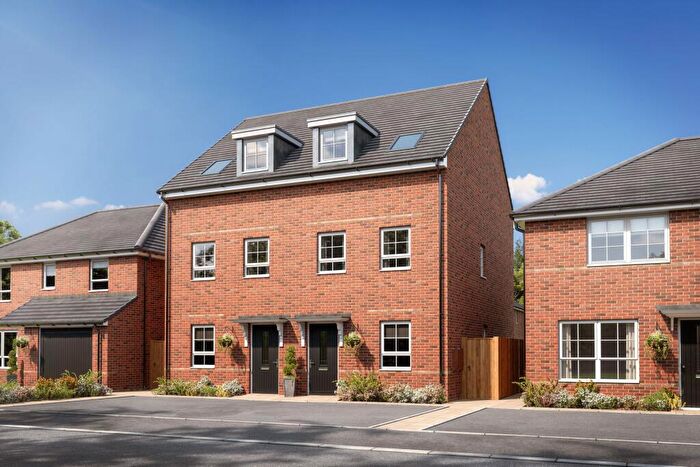
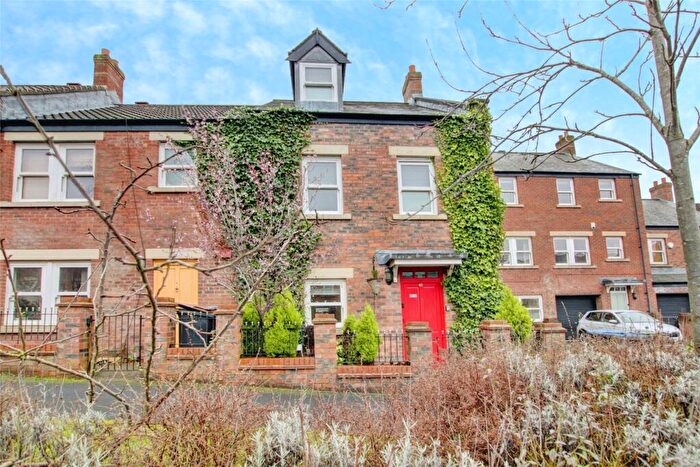
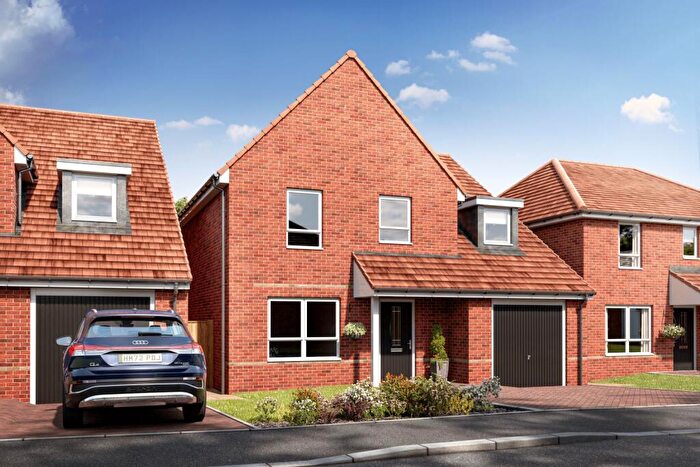
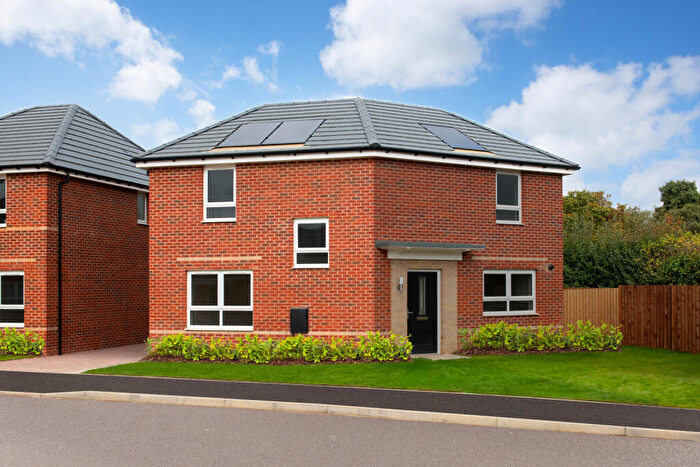
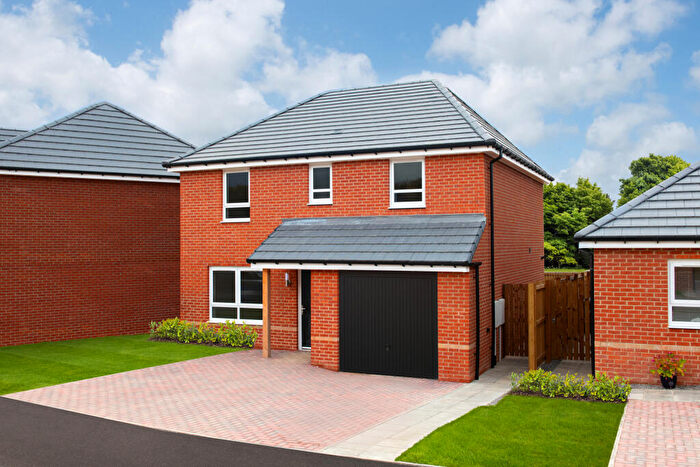
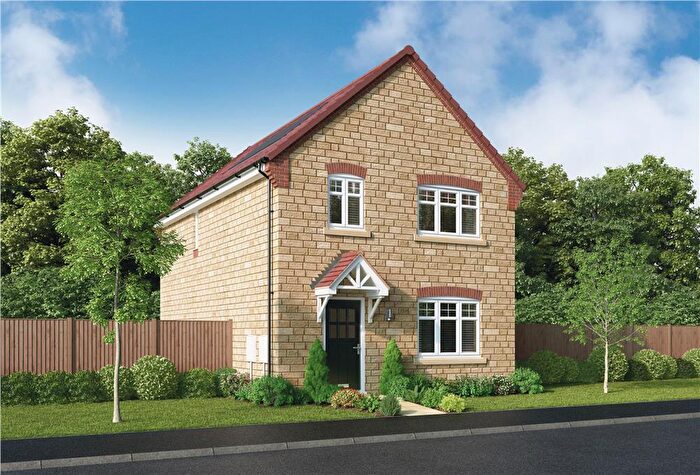
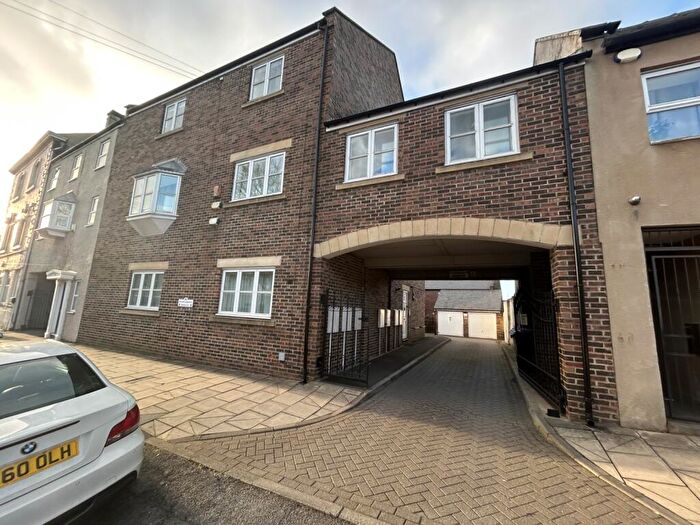
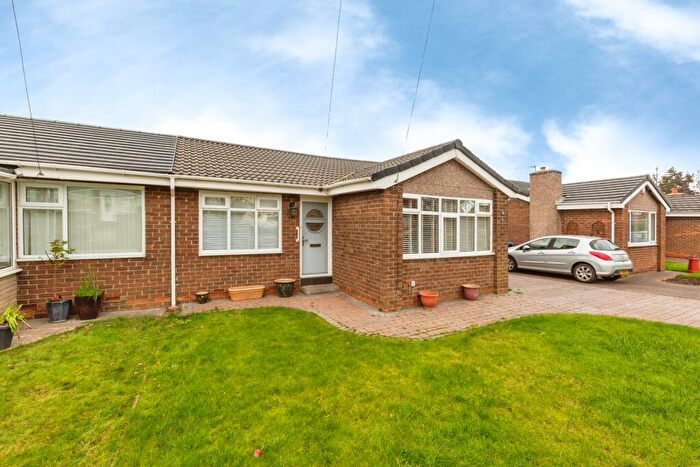
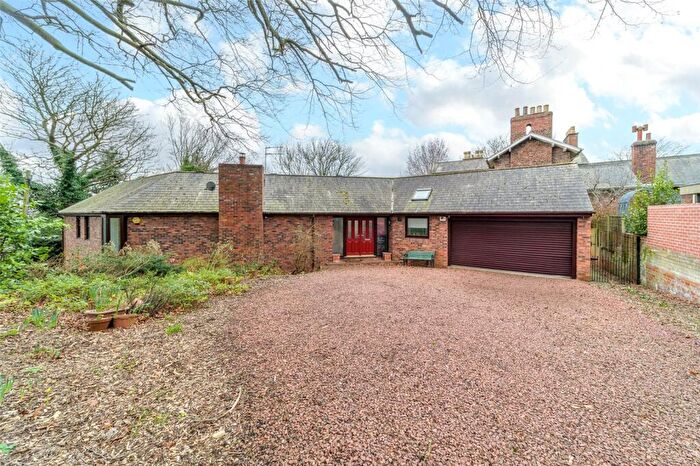
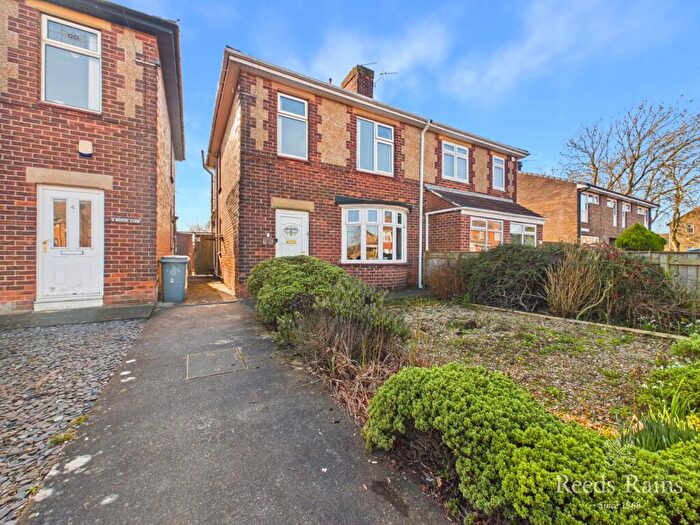
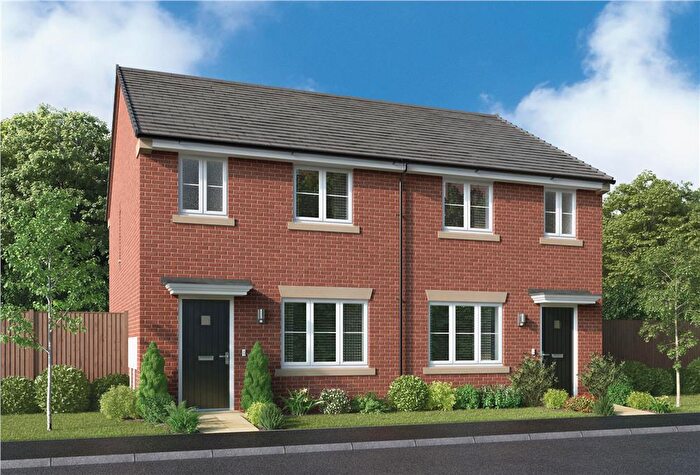
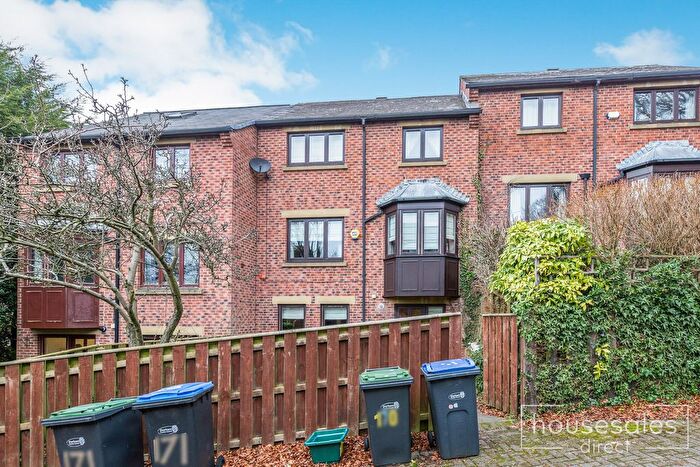
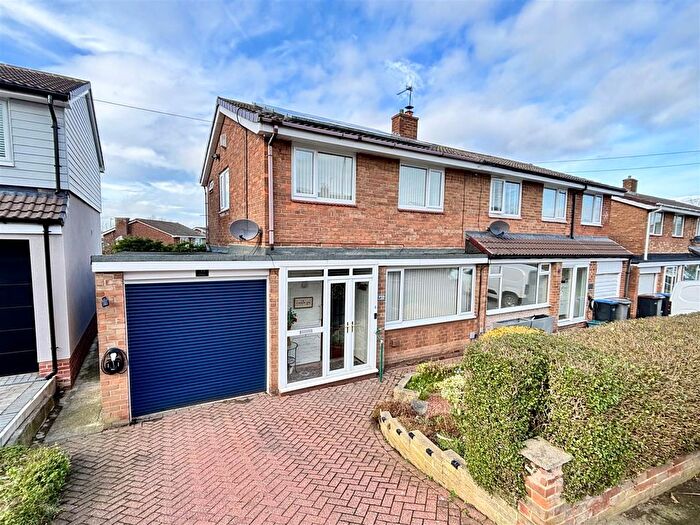
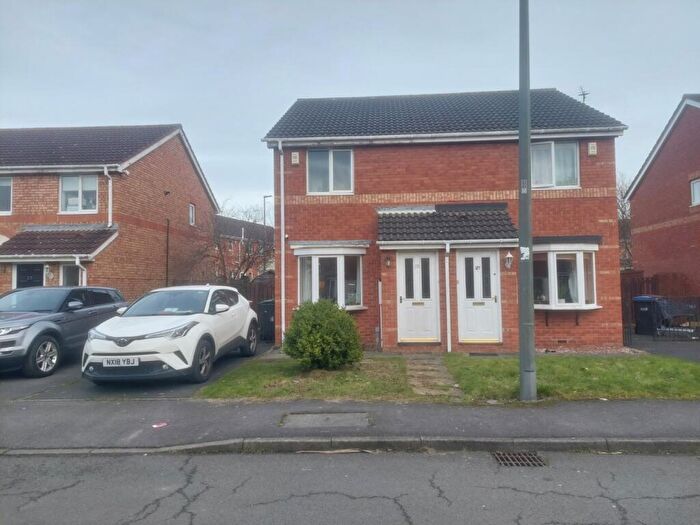
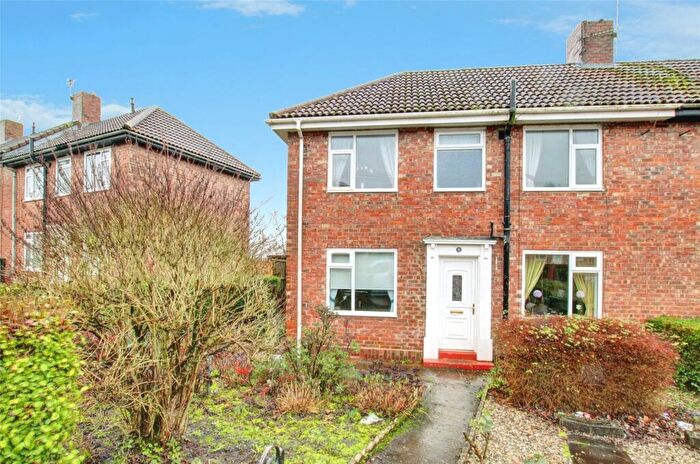
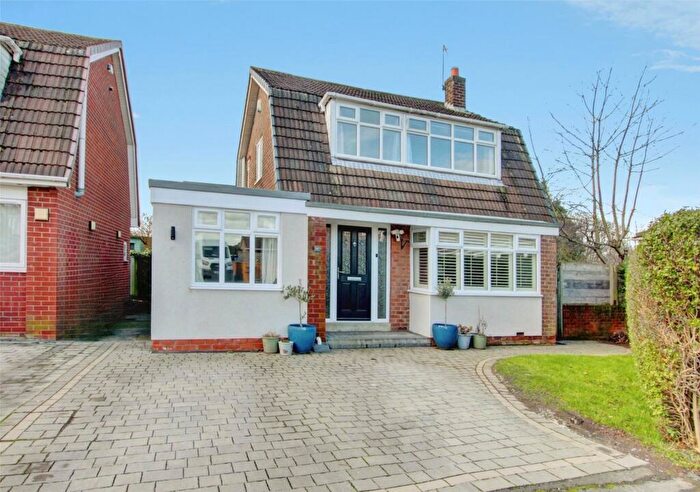
Properties for sale near DH1 2QQ, Glue Garth
![]()
If you are looking to sell your house, let it out, or receive a property valuation, an expert can help you.
Click the button below to get started.

Price Paid in Glue Garth, DH1 2QQ, Belmont
6 Glue Garth, DH1 2QQ, Belmont Durham
Property 6 has been sold 2 times. The last time it was sold was in 18/07/2022 and the sold price was £180,000.00.
This semi detached house, sold as a freehold on 18/07/2022, is a 92 sqm semi-detached house with an EPC rating of D.
| Date | Price | Property Type | Tenure | Classification |
|---|---|---|---|---|
| 18/07/2022 | £180,000.00 | Semi Detached House | freehold | Established Building |
| 16/08/2013 | £140,000.00 | Semi Detached House | freehold | Established Building |
3 Glue Garth, DH1 2QQ, Belmont Durham
Property 3 has been sold 2 times. The last time it was sold was in 17/06/2016 and the sold price was £115,000.00.
This is a Semi Detached House which was sold as a freehold in 17/06/2016
| Date | Price | Property Type | Tenure | Classification |
|---|---|---|---|---|
| 17/06/2016 | £115,000.00 | Semi Detached House | freehold | Established Building |
| 27/11/2002 | £55,000.00 | Semi Detached House | freehold | Established Building |
4 Glue Garth, DH1 2QQ, Belmont Durham
Property 4 has been sold 1 time. The last time it was sold was in 21/12/2005 and the sold price was £120,000.00.
This terraced house, sold as a freehold on 21/12/2005, is a 96 sqm semi-detached house with an EPC rating of D.
| Date | Price | Property Type | Tenure | Classification |
|---|---|---|---|---|
| 21/12/2005 | £120,000.00 | Terraced House | freehold | Established Building |
Transport near DH1 2QQ, Glue Garth

House price paid reports for DH1 2QQ, Glue Garth
Click on the buttons below to see price paid reports by year or property price:
- Price Paid By Year
Property Price Paid in DH1 2QQ, Glue Garth by Year
The average sold property price by year was:
| Year | Average Sold Price | Price Change |
Sold Properties
|
|---|---|---|---|
| 2022 | £180,000 | 36% |
1 Property |
| 2016 | £115,000 | -22% |
1 Property |
| 2013 | £140,000 | 14% |
1 Property |
| 2005 | £120,000 | 54% |
1 Property |
| 2002 | £55,000 | - |
1 Property |