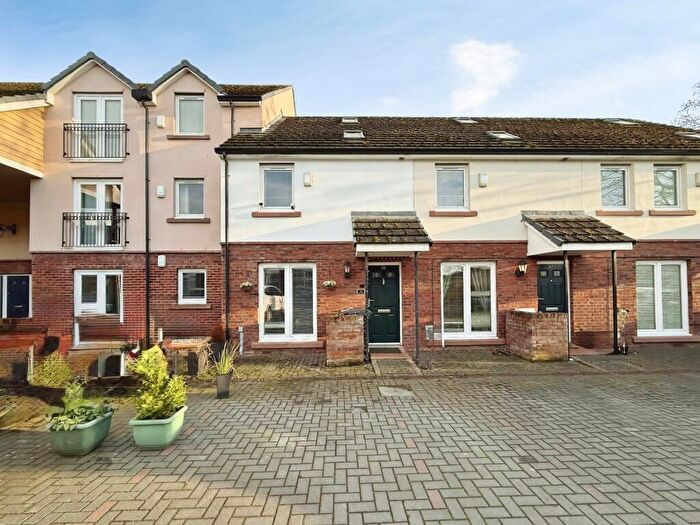
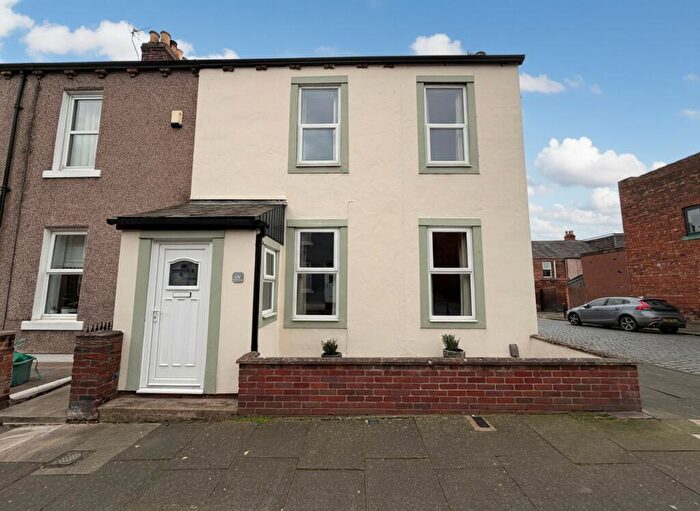
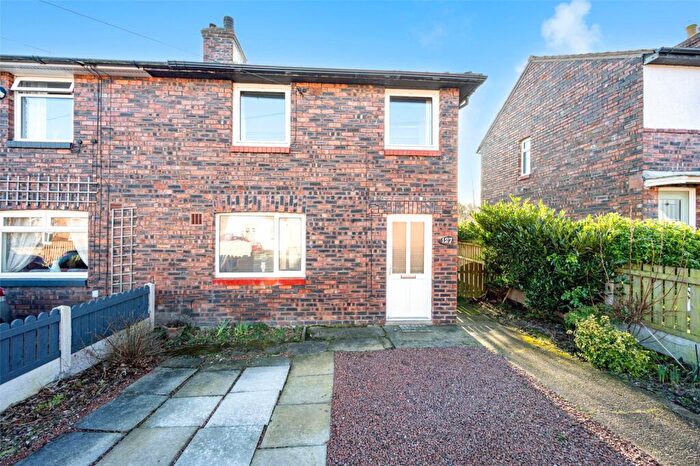
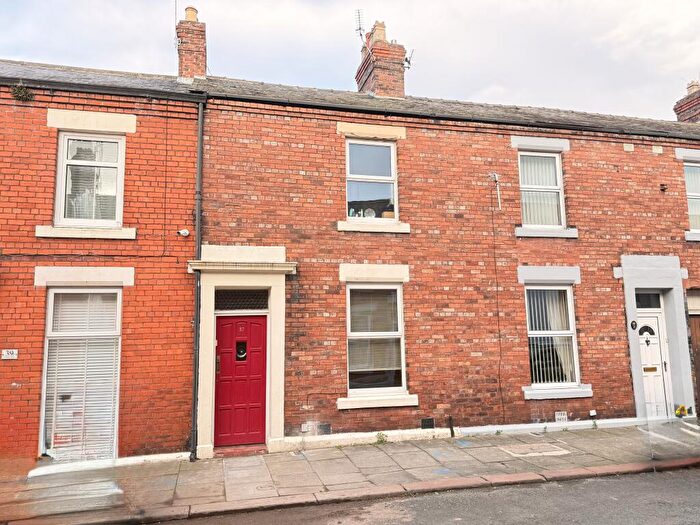
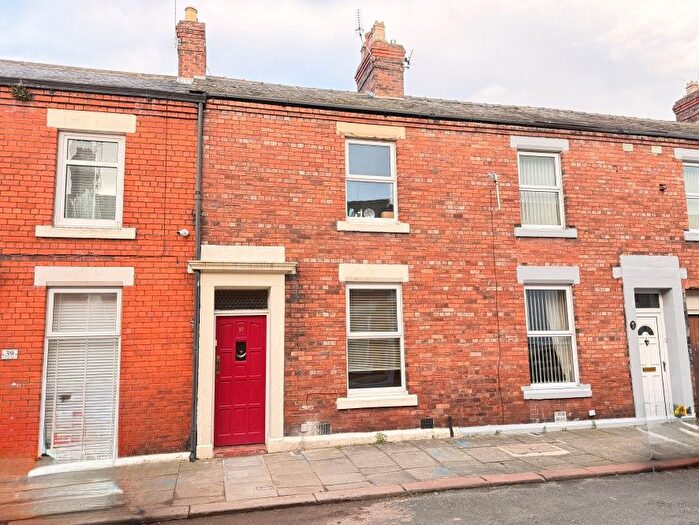
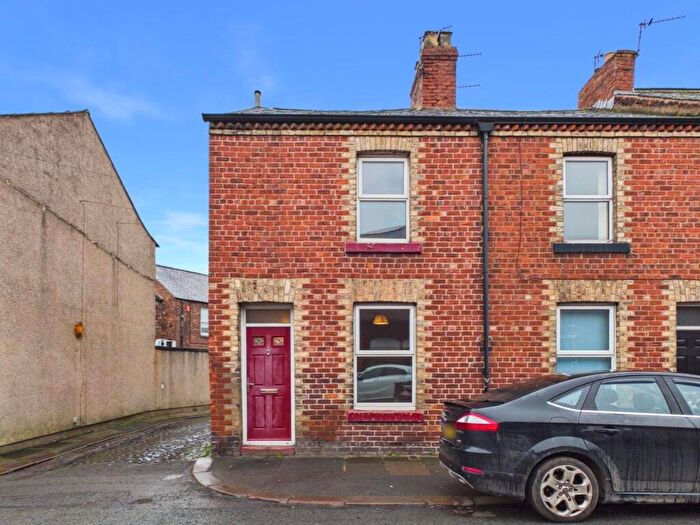
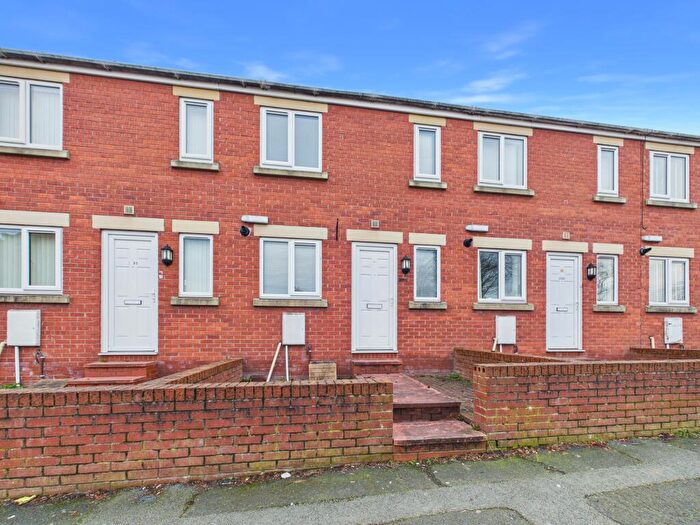
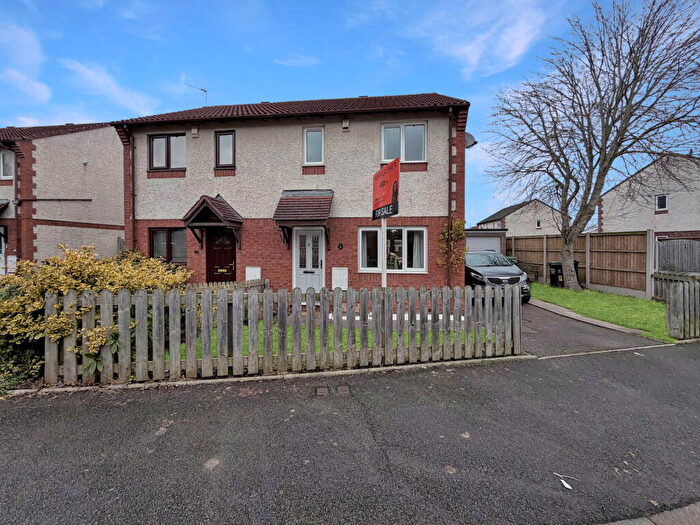
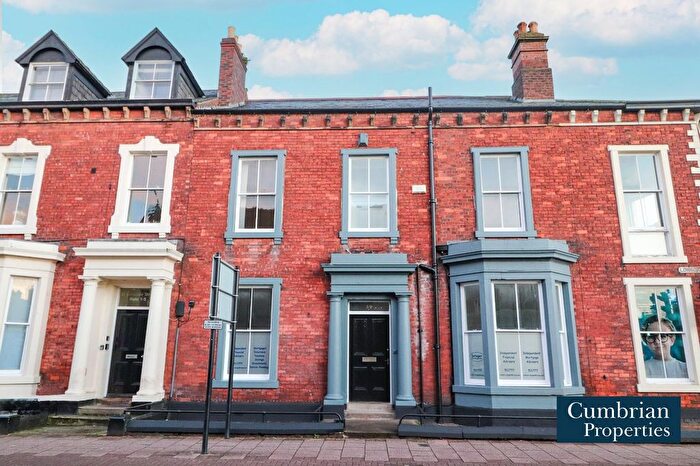
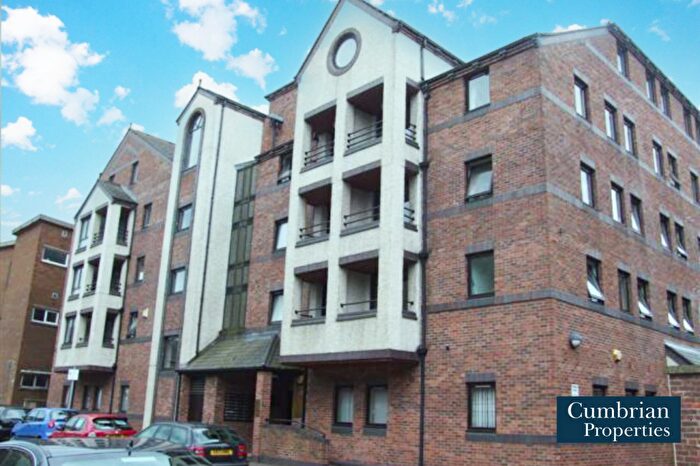
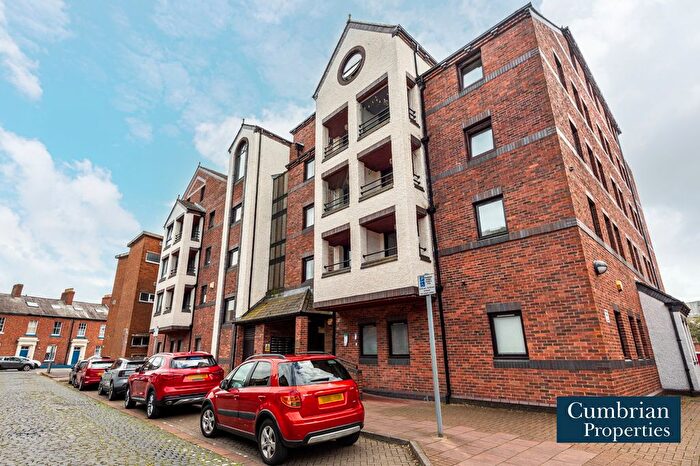
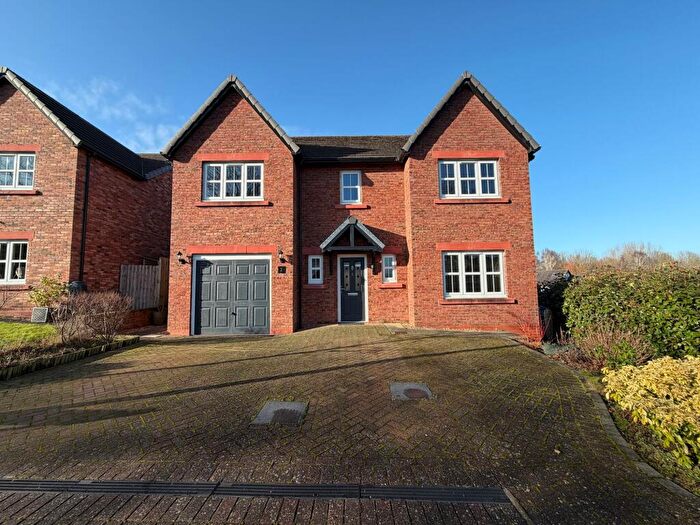
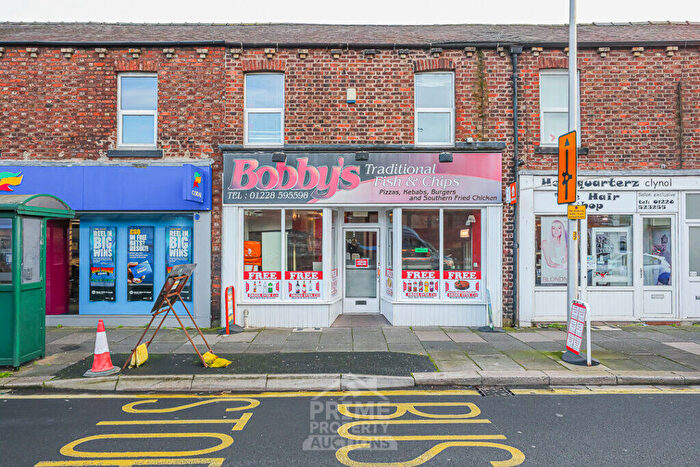
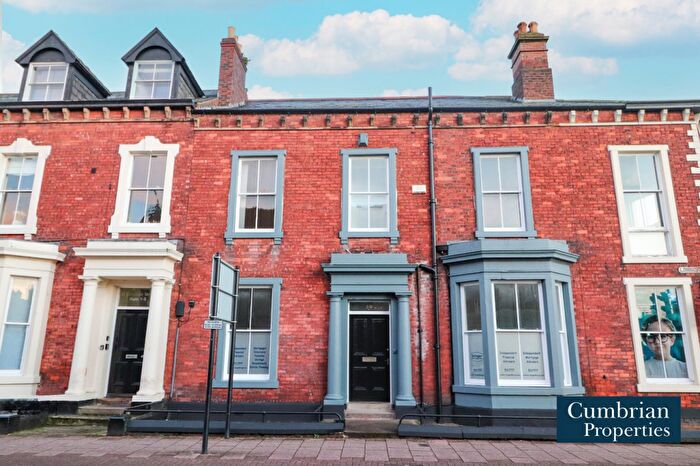
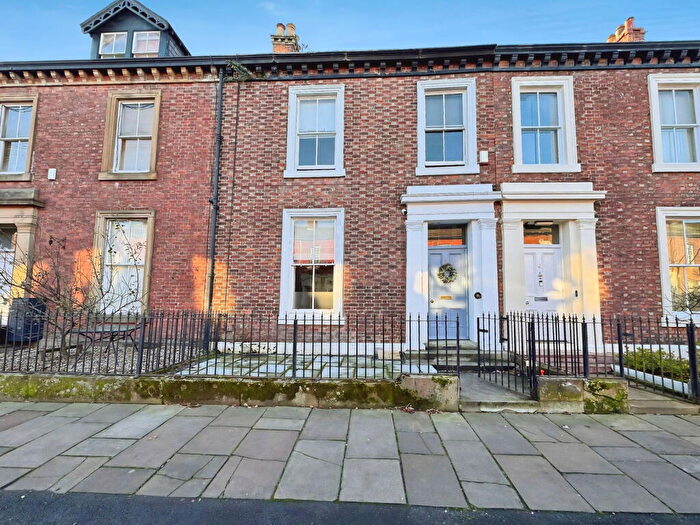
Houses for sale & to rent in Currock, Carlisle
House Prices in Currock
Properties in Currock have an average house price of £117,160.00 and had 288 Property Transactions within the last 3 years¹.
Currock is an area in Carlisle, Cumbria with 2,704 households², where the most expensive property was sold for £250,000.00.
Properties for sale in Currock
Roads and Postcodes in Currock
Navigate through our locations to find the location of your next house in Currock, Carlisle for sale or to rent.
| Streets | Postcodes |
|---|---|
| Adelphi Terrace | CA2 4BE |
| Almery Drive | CA2 4EX |
| Alton Street | CA2 4DX |
| Arthur Street | CA2 4AN |
| Beaconsfield Street | CA2 4AL |
| Beaumont Road | CA2 4RG CA2 4RJ CA2 4RL CA2 4RQ |
| Berlin Street | CA1 2GY |
| Blackwell Road | CA2 4AB CA2 4AJ CA2 4DL CA2 4DN CA2 4DS CA2 4DT CA2 4DY CA2 4DZ CA2 4EH CA2 4EQ CA2 4RA CA2 4RB CA2 4RD CA2 4RE CA2 4RR CA2 4RS CA2 4RW CA2 4RY |
| Boston Avenue | CA2 4DR |
| Botchergate | CA1 1SH CA1 1SN |
| Boundary Road | CA2 4HH CA2 4HS CA2 4HT |
| Buchanan Place | CA2 4QG |
| Claire Street | CA2 4EY |
| Clementina Terrace | CA2 4EN |
| Coney Street | CA2 4BQ CA2 4BW CA2 4BX |
| Crown Street | CA2 5AB |
| Currock Bank Road | CA2 4RN |
| Currock Mount | CA2 4RF |
| Currock Park Avenue | CA2 4DH CA2 4DJ |
| Currock Road | CA2 4AS CA2 4AX CA2 4BB CA2 4BH CA2 4BJ CA2 4BL |
| Currock Street | CA2 5AG |
| Dale View | CA2 4RH |
| Esther Street | CA2 4HA |
| Gardenia Street | CA2 4AW |
| Gloucester Road | CA2 4EW |
| Goodwin Close | CA2 4AH |
| Goodwin Place | CA2 4AG |
| Grasmere Street | CA2 4AR |
| Grierson Road | CA2 4EF |
| Harold Street | CA2 4HG |
| Harrison Street | CA2 4EP CA2 4ER |
| Hasell Street | CA2 4HB |
| Henderson Road | CA2 4PZ |
| Holmes Avenue | CA2 4QA |
| Jubilee Road | CA2 4DD CA2 4DF |
| Leabourne Road | CA2 4QL |
| Lediard Avenue | CA2 4BN CA2 4BP CA2 4BS CA2 4BT CA2 4BU |
| London Road | CA1 2EL CA1 2PE |
| Lund Crescent | CA2 4BY CA2 4BZ CA2 4DB |
| Maitland Street | CA2 4ED |
| Marina Crescent | CA2 4DE |
| Mayson Street | CA2 4DU |
| Millbank Court | CA2 4HY |
| Millholme Avenue | CA2 4DP CA2 4DW |
| Montreal Street | CA2 4EE |
| Mount Pleasant Road | CA2 4QH CA2 4QQ |
| Nicholson Street | CA2 4AD |
| Quebec Avenue | CA2 4EA CA2 4EB |
| Red Bank Square | CA2 4BG |
| Red Bank Terrace | CA2 4BD |
| Regent Street | CA2 4HD |
| Ridley Place | CA2 4LF |
| Ridley Road | CA2 4LB CA2 4LD CA2 4LE |
| Robinson Avenue | CA2 4EU |
| Robinson Street | CA2 4ES |
| Salisbury Road | CA2 4EJ |
| Scalegate Road | CA2 4LA |
| Sewell Place | CA2 4QR |
| Sewell Road | CA2 4QJ CA2 4QP |
| South Dale Street | CA2 4HR |
| South John Street | CA2 5AJ |
| South View Terrace | CA1 2EG |
| South Western Terrace | CA2 4AY |
| St Nicholas Street | CA1 2EF |
| Thirlmere Street | CA2 4AP |
| Tithebarn Street | CA2 4EL |
| Toronto Street | CA2 4EG |
| Upperby Road | CA2 4HU |
| Webster Crescent | CA2 4DA |
| Willow Place Currock Road | CA2 4DG |
| Woodrouffe Terrace | CA1 2EH |
| York Gardens | CA2 4HP |
Transport near Currock
- FAQ
- Price Paid By Year
- Property Type Price
Frequently asked questions about Currock
What is the average price for a property for sale in Currock?
The average price for a property for sale in Currock is £117,160. This amount is 36% lower than the average price in Carlisle. There are 1,588 property listings for sale in Currock.
What streets have the most expensive properties for sale in Currock?
The streets with the most expensive properties for sale in Currock are Currock Road at an average of £162,125, Beaumont Road at an average of £157,791 and Robinson Avenue at an average of £154,625.
What streets have the most affordable properties for sale in Currock?
The streets with the most affordable properties for sale in Currock are York Gardens at an average of £62,000, Mount Pleasant Road at an average of £69,375 and Robinson Street at an average of £72,000.
Which train stations are available in or near Currock?
Some of the train stations available in or near Currock are Carlisle, Dalston and Wetheral.
Property Price Paid in Currock by Year
The average sold property price by year was:
| Year | Average Sold Price | Price Change |
Sold Properties
|
|---|---|---|---|
| 2025 | £132,182 | 12% |
80 Properties |
| 2024 | £116,298 | 7% |
86 Properties |
| 2023 | £107,916 | -2% |
122 Properties |
| 2022 | £109,905 | 8% |
105 Properties |
| 2021 | £100,828 | -0,5% |
114 Properties |
| 2020 | £101,319 | 9% |
94 Properties |
| 2019 | £92,104 | -5% |
114 Properties |
| 2018 | £96,275 | 1% |
101 Properties |
| 2017 | £95,234 | -7% |
104 Properties |
| 2016 | £101,556 | 10% |
95 Properties |
| 2015 | £91,276 | 4% |
101 Properties |
| 2014 | £87,588 | -3% |
117 Properties |
| 2013 | £90,548 | 8% |
69 Properties |
| 2012 | £83,275 | -5% |
73 Properties |
| 2011 | £87,215 | -3% |
73 Properties |
| 2010 | £90,205 | 2% |
77 Properties |
| 2009 | £88,510 | -9% |
47 Properties |
| 2008 | £96,484 | -2% |
99 Properties |
| 2007 | £98,504 | 7% |
207 Properties |
| 2006 | £91,788 | 4% |
179 Properties |
| 2005 | £87,793 | 11% |
169 Properties |
| 2004 | £78,147 | 28% |
162 Properties |
| 2003 | £56,336 | 23% |
205 Properties |
| 2002 | £43,439 | 8% |
181 Properties |
| 2001 | £39,885 | 8% |
184 Properties |
| 2000 | £36,826 | -6% |
130 Properties |
| 1999 | £38,963 | 2% |
128 Properties |
| 1998 | £38,147 | 0,5% |
124 Properties |
| 1997 | £37,973 | 6% |
128 Properties |
| 1996 | £35,648 | 1% |
118 Properties |
| 1995 | £35,201 | - |
96 Properties |
Property Price per Property Type in Currock
Here you can find historic sold price data in order to help with your property search.
The average Property Paid Price for specific property types in the last three years are:
| Property Type | Average Sold Price | Sold Properties |
|---|---|---|
| Semi Detached House | £136,437.00 | 72 Semi Detached Houses |
| Detached House | £164,500.00 | 5 Detached Houses |
| Terraced House | £110,745.00 | 204 Terraced Houses |
| Flat | £72,014.00 | 7 Flats |

