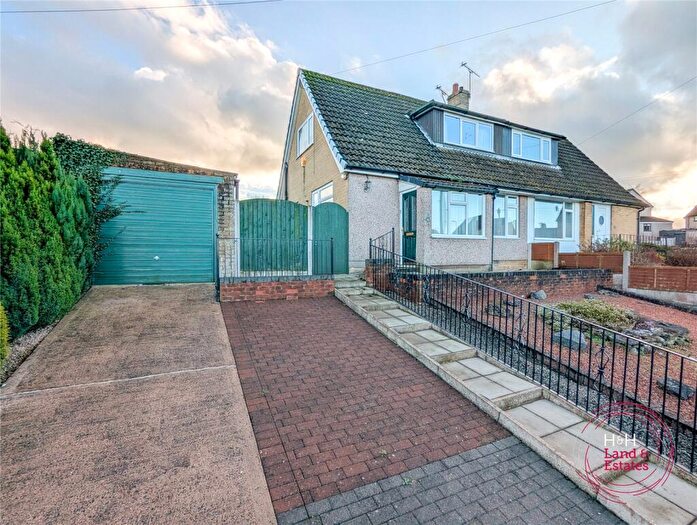
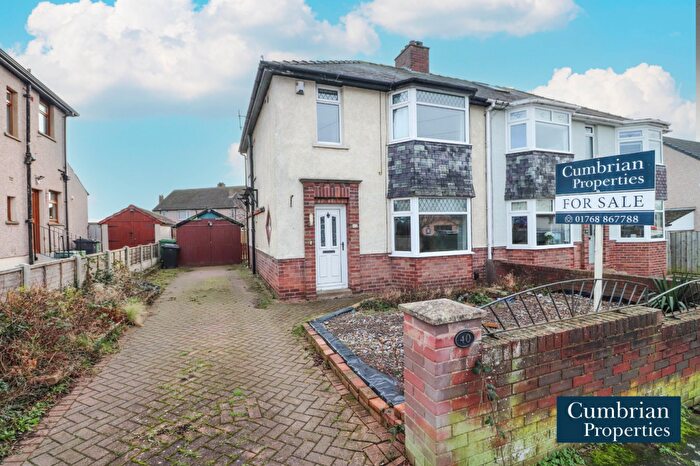
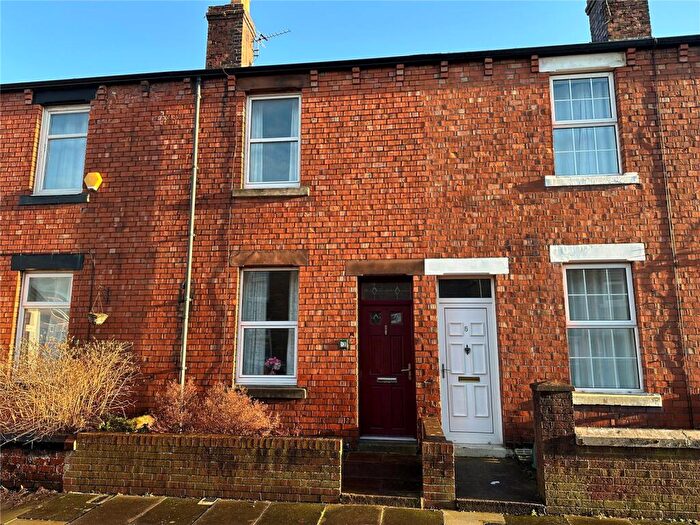
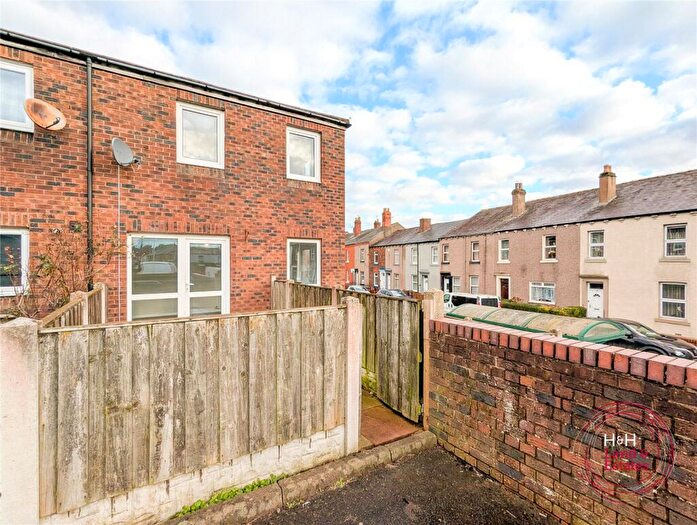
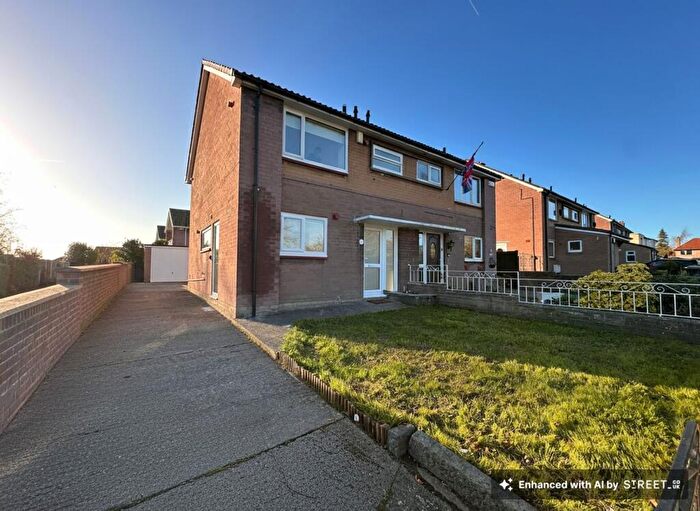
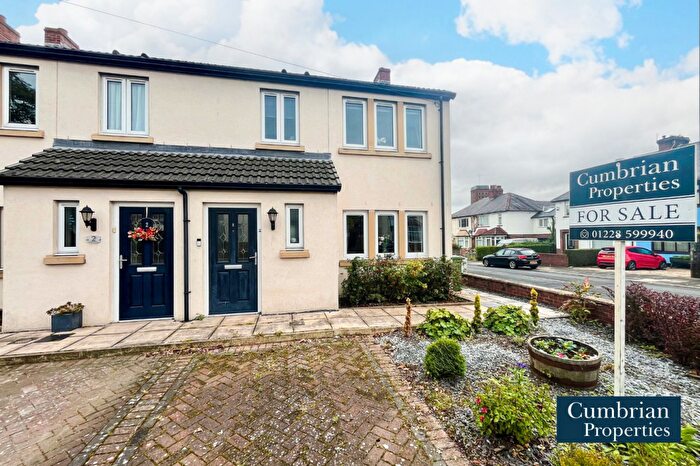
Houses for sale & to rent in Upperby, Carlisle
House Prices in Upperby
Properties in Upperby have an average house price of £132,812.00 and had 145 Property Transactions within the last 3 years¹.
Upperby is an area in Carlisle, Cumbria with 2,318 households², where the most expensive property was sold for £595,000.00.
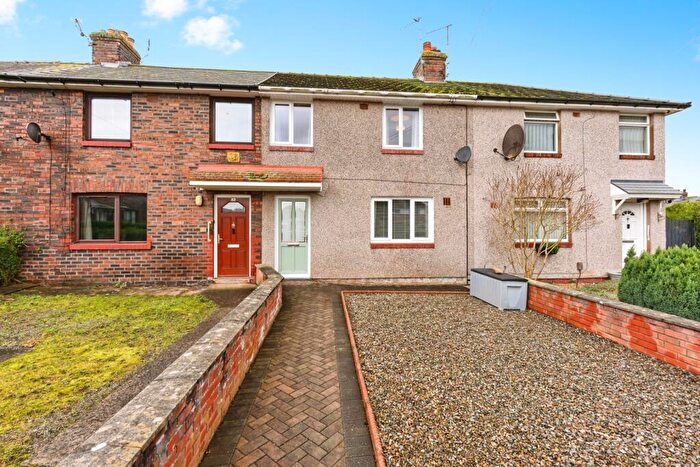
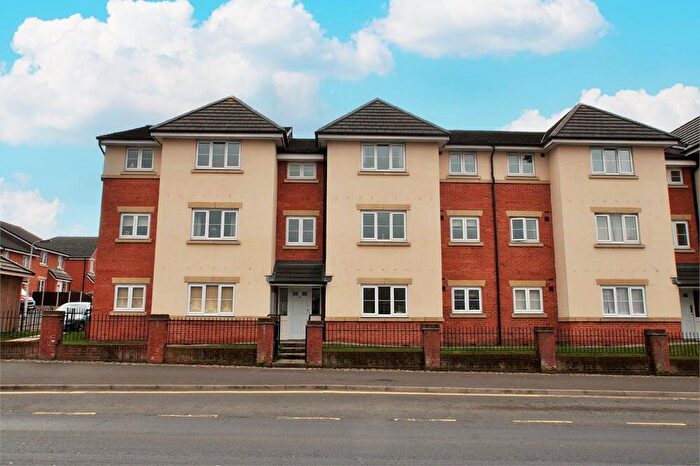
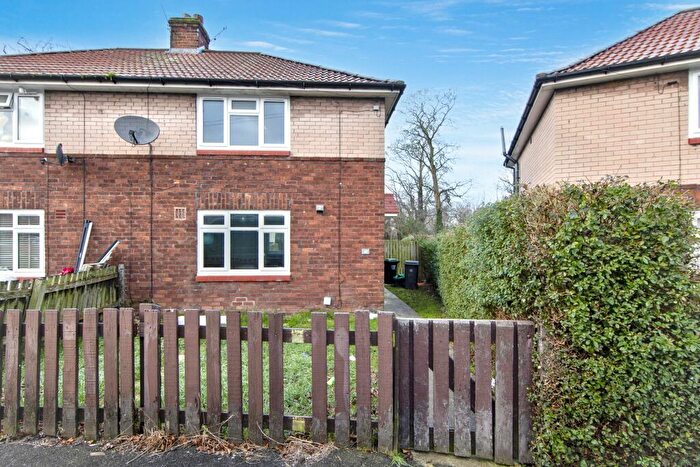
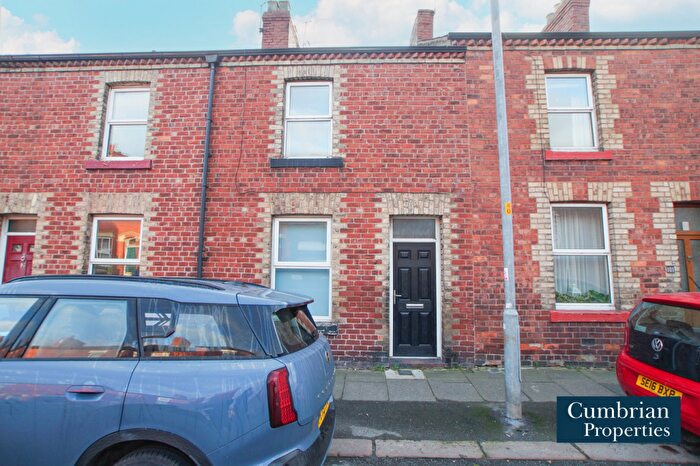
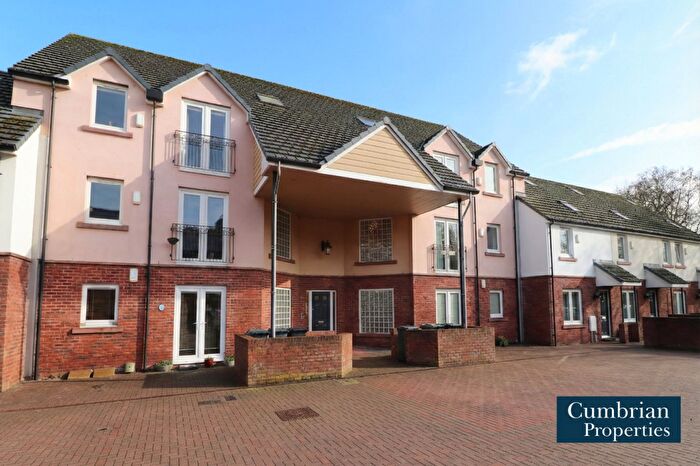
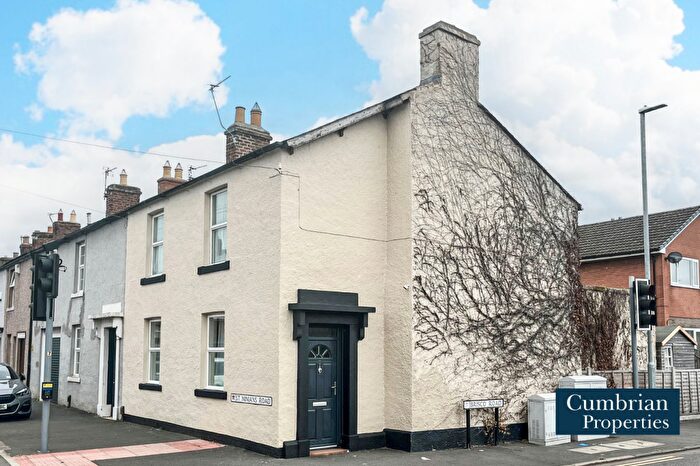
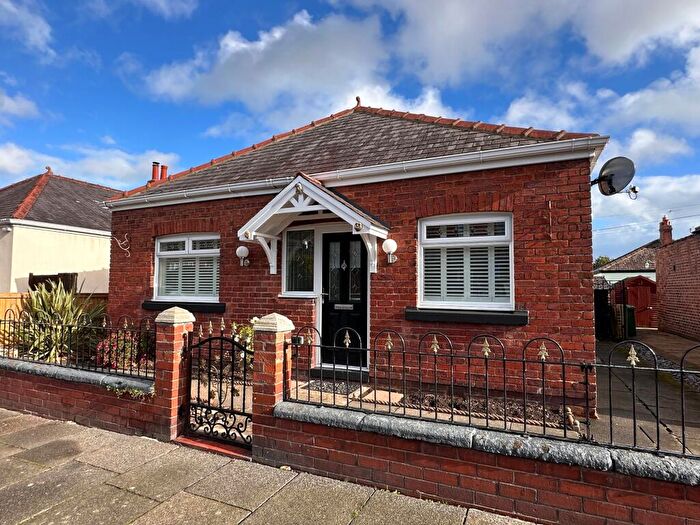
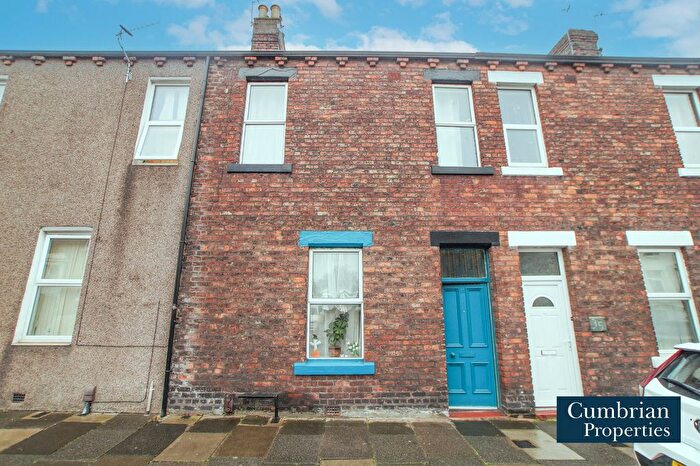
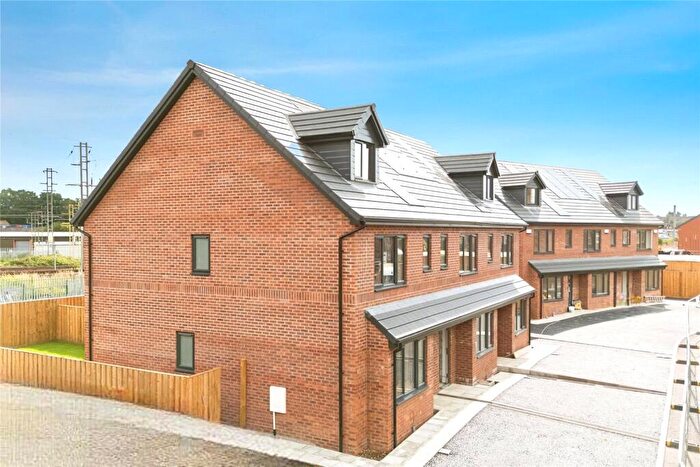
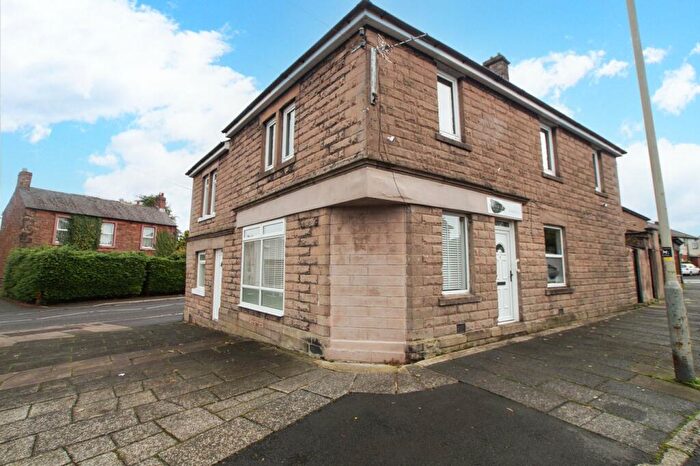
Properties for sale in Upperby
Previously listed properties in Upperby
Roads and Postcodes in Upperby
Navigate through our locations to find the location of your next house in Upperby, Carlisle for sale or to rent.
| Streets | Postcodes |
|---|---|
| Atkinson Crescent | CA1 3DH |
| Baird Road | CA1 3AD CA1 3AE |
| Blackwell Place | CA2 4RZ |
| Blackwell Road | CA2 4RU |
| Blundell Road | CA1 3BQ |
| Bourne Lea Close | CA2 4FE |
| Brisco Meadows | CA2 4NY |
| Brisco Road | CA2 4NX CA2 4PA CA2 4PF CA2 4PG |
| Buchanan Place | CA2 4QF |
| Buchanan Road | CA2 4PS CA2 4PT CA2 4QD CA2 4QE |
| Burnett Road | CA1 3BU CA1 3DA |
| Cammock Avenue | CA2 4PD |
| Cammock Crescent | CA2 4PE |
| Cammock Road | CA2 4PB |
| Cant Crescent | CA2 4JF CA2 4JJ |
| Dale End Road | CA1 3DE |
| Embleton Road | CA2 4JU |
| Gillford Crescent | CA1 3BS CA1 3BT |
| Greengarth | CA2 4PN CA2 4PW |
| Haig Road | CA1 3AS |
| Harris Crescent | CA1 3BA |
| Hayton Road | CA1 3AX |
| Henderson Road | CA2 4PU CA2 4PY |
| High Garth Court | CA2 4LZ |
| Holmacres Drive | CA1 3AA CA1 3AB |
| Hugh Little Garth | CA2 4LQ |
| Kirklands Road | CA2 4JD |
| Lamb Street | CA2 4NF |
| Leabourne Road | CA2 4FD |
| Lightfoot Drive | CA1 3BH CA1 3BL CA1 3BN CA1 3BP |
| Manor Place | CA2 4LP |
| Manor Road | CA2 4LH CA2 4LJ CA2 4LW |
| Mount Pleasant Road | CA2 4QB |
| Newlands Road | CA2 4JB |
| Oaklands Drive | CA2 4NH CA2 4NJ CA2 4NQ |
| Petteril Bank Road | CA1 3AJ CA1 3AP |
| Ridgemount Road | CA1 3DJ |
| Scaleby Close | CA2 4JN |
| Scalegate Road | CA2 4JX CA2 4JY CA2 4JZ CA2 4NL CA2 4PJ CA2 4PL CA2 4PQ CA2 4PR |
| Semple Road | CA1 3AZ |
| St Johns Close | CA2 4JH |
| St Ninians Avenue | CA2 4LU |
| St Ninians Court | CA2 4LX |
| St Ninians Road | CA2 4LR CA2 4LT |
| Sunnymeade | CA2 4NR CA2 4NS |
| Tarnside | CA2 4NG |
| Uldale Road | CA2 4PP |
| Upperby Road | CA2 4HZ CA2 4JA CA2 4JE CA2 4JL CA2 4JP CA2 4JR |
| Upperby Way | CA2 4GJ |
| Welsh Road | CA1 3AR CA1 3AU CA1 3BD |
| Woodsghyll Drive | CA1 3DD CA1 3DG |
| Woodside North | CA2 4NN CA2 4NP CA2 4NW |
Transport near Upperby
- FAQ
- Price Paid By Year
- Property Type Price
Frequently asked questions about Upperby
What is the average price for a property for sale in Upperby?
The average price for a property for sale in Upperby is £132,812. This amount is 27% lower than the average price in Carlisle. There are 860 property listings for sale in Upperby.
What streets have the most expensive properties for sale in Upperby?
The streets with the most expensive properties for sale in Upperby are Manor Road at an average of £215,445, Embleton Road at an average of £205,833 and St Ninians Road at an average of £201,666.
What streets have the most affordable properties for sale in Upperby?
The streets with the most affordable properties for sale in Upperby are Blundell Road at an average of £50,000, Semple Road at an average of £60,000 and Manor Place at an average of £70,000.
Which train stations are available in or near Upperby?
Some of the train stations available in or near Upperby are Carlisle, Dalston and Wetheral.
Property Price Paid in Upperby by Year
The average sold property price by year was:
| Year | Average Sold Price | Price Change |
Sold Properties
|
|---|---|---|---|
| 2025 | £139,518 | 8% |
40 Properties |
| 2024 | £128,119 | -4% |
61 Properties |
| 2023 | £133,221 | 3% |
44 Properties |
| 2022 | £129,849 | 17% |
79 Properties |
| 2021 | £107,827 | 1% |
72 Properties |
| 2020 | £107,154 | 5% |
53 Properties |
| 2019 | £102,089 | 6% |
53 Properties |
| 2018 | £95,592 | -3% |
57 Properties |
| 2017 | £98,782 | -2% |
49 Properties |
| 2016 | £100,762 | 4% |
59 Properties |
| 2015 | £96,863 | 4% |
61 Properties |
| 2014 | £93,235 | -7% |
68 Properties |
| 2013 | £99,742 | 17% |
39 Properties |
| 2012 | £83,041 | -1% |
41 Properties |
| 2011 | £83,533 | -1% |
45 Properties |
| 2010 | £84,369 | -11% |
37 Properties |
| 2009 | £93,505 | -4% |
35 Properties |
| 2008 | £97,364 | -5% |
42 Properties |
| 2007 | £101,893 | 11% |
93 Properties |
| 2006 | £90,330 | 4% |
73 Properties |
| 2005 | £86,811 | 16% |
68 Properties |
| 2004 | £72,519 | 18% |
72 Properties |
| 2003 | £59,461 | 25% |
89 Properties |
| 2002 | £44,410 | -4% |
55 Properties |
| 2001 | £46,036 | 7% |
75 Properties |
| 2000 | £43,001 | -9% |
59 Properties |
| 1999 | £46,693 | 4% |
73 Properties |
| 1998 | £44,856 | 14% |
53 Properties |
| 1997 | £38,434 | 8% |
38 Properties |
| 1996 | £35,410 | -12% |
45 Properties |
| 1995 | £39,657 | - |
48 Properties |
Property Price per Property Type in Upperby
Here you can find historic sold price data in order to help with your property search.
The average Property Paid Price for specific property types in the last three years are:
| Property Type | Average Sold Price | Sold Properties |
|---|---|---|
| Semi Detached House | £136,601.00 | 92 Semi Detached Houses |
| Detached House | £299,500.00 | 6 Detached Houses |
| Terraced House | £113,210.00 | 37 Terraced Houses |
| Flat | £70,470.00 | 10 Flats |

