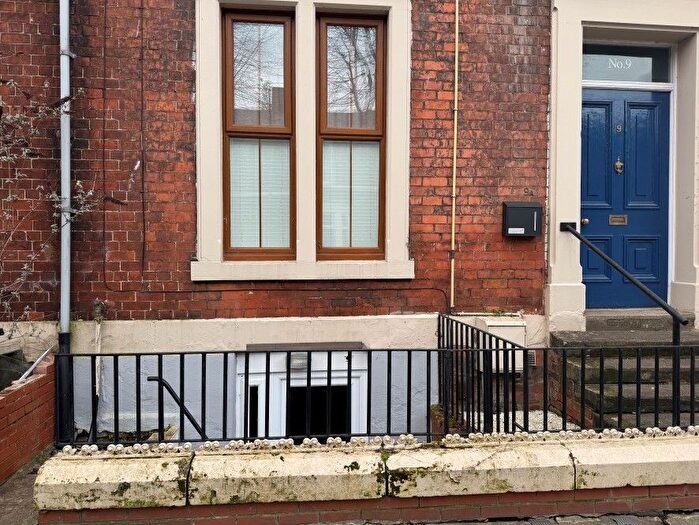
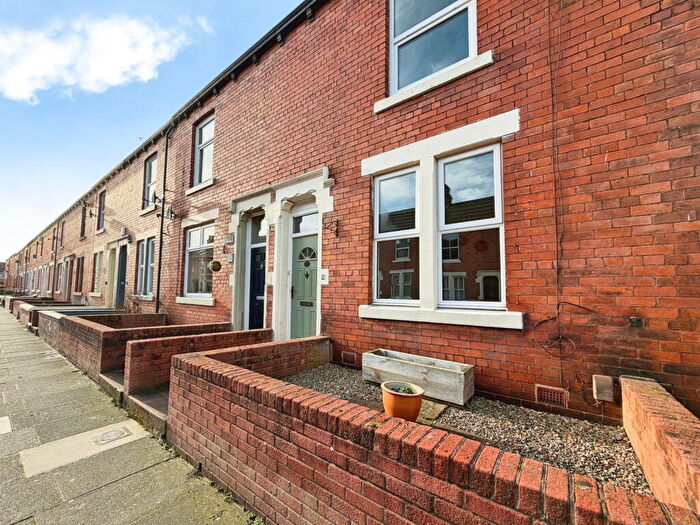
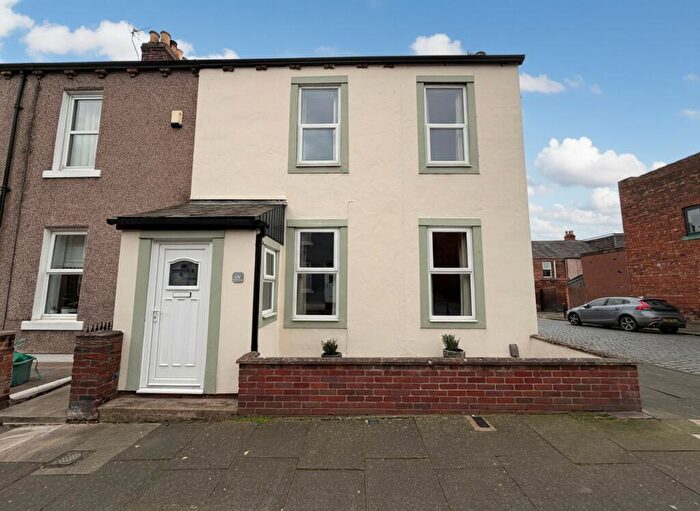
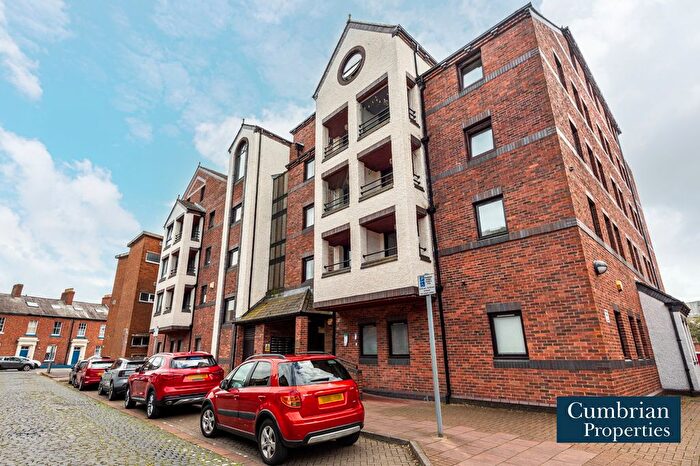
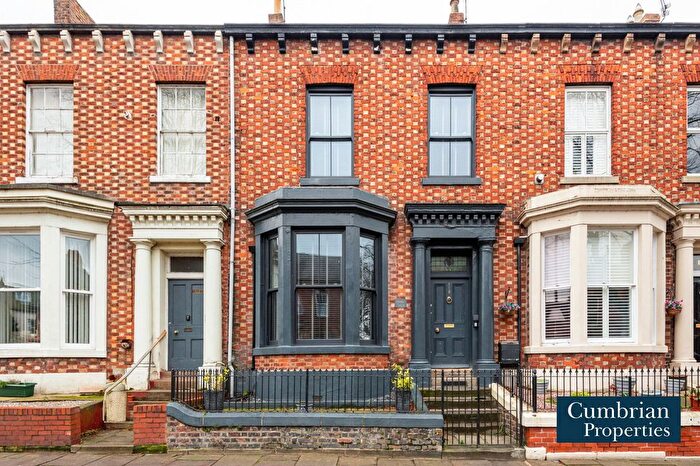
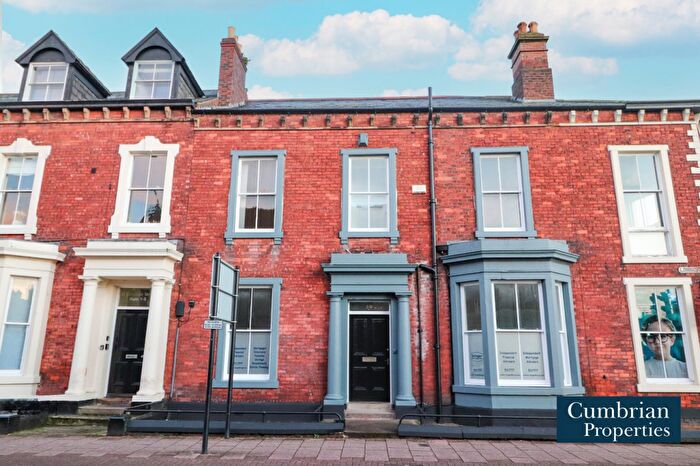
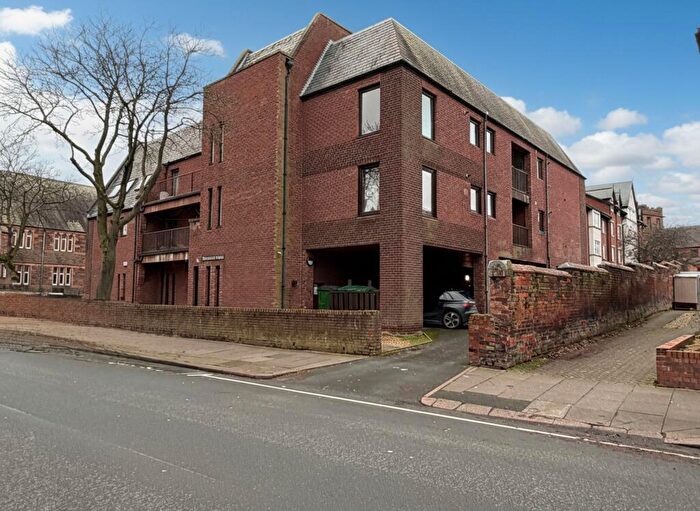
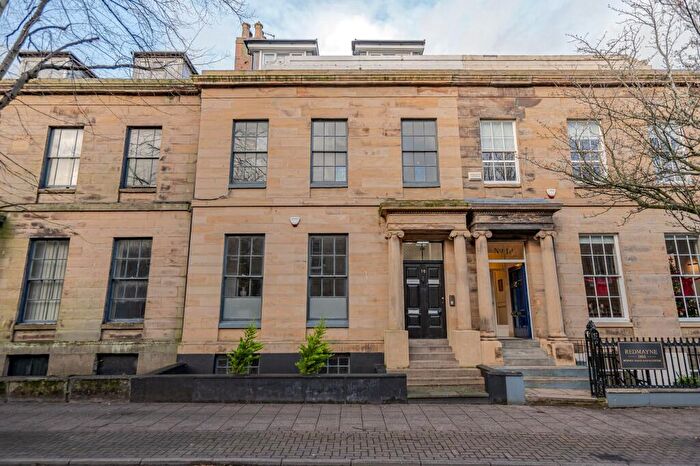
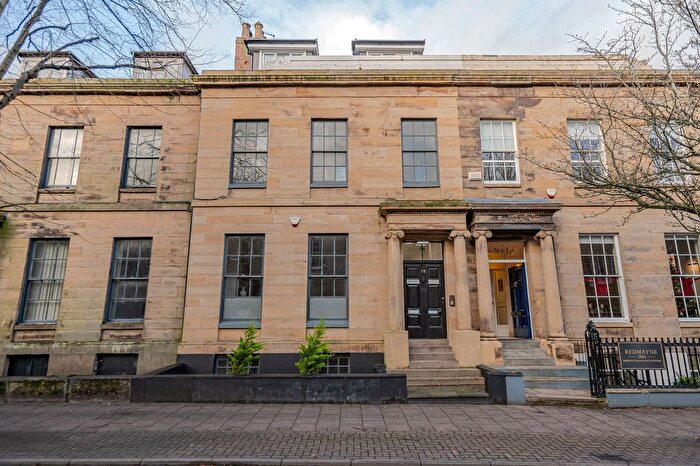
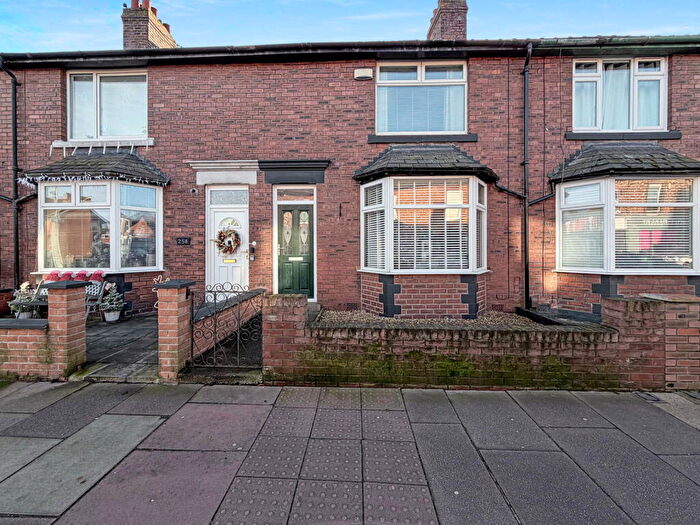
Houses for sale & to rent in St Aidans, Carlisle
House Prices in St Aidans
Properties in St Aidans have an average house price of £117,354.00 and had 383 Property Transactions within the last 3 years¹.
St Aidans is an area in Carlisle, Cumbria with 2,806 households², where the most expensive property was sold for £625,000.00.
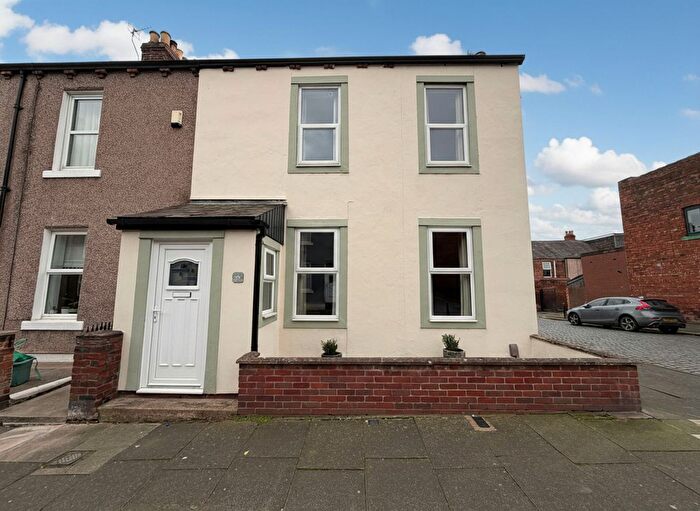
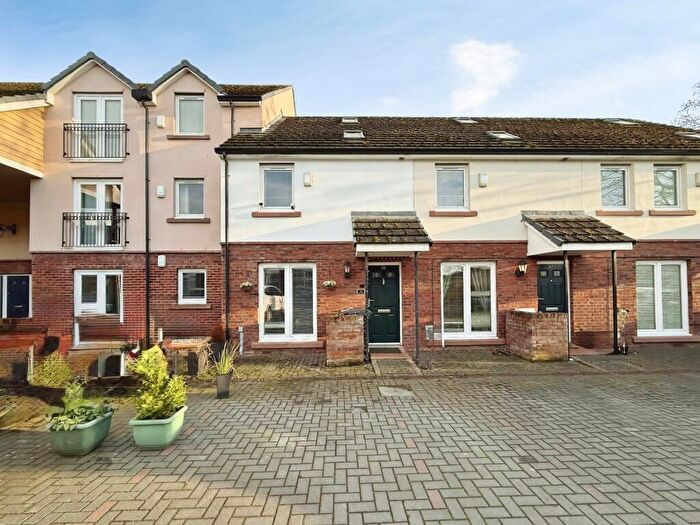
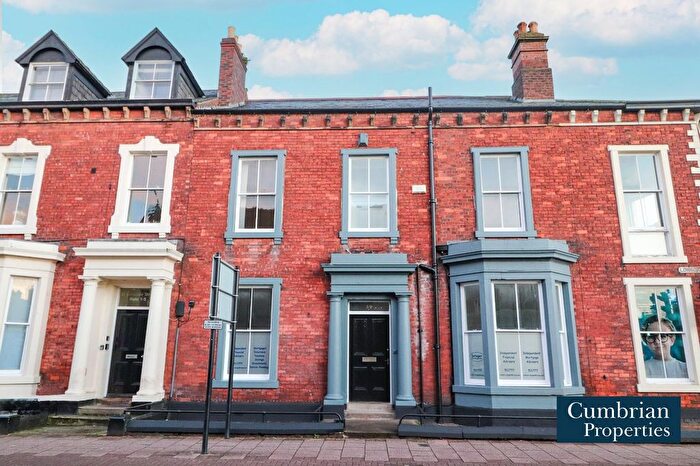
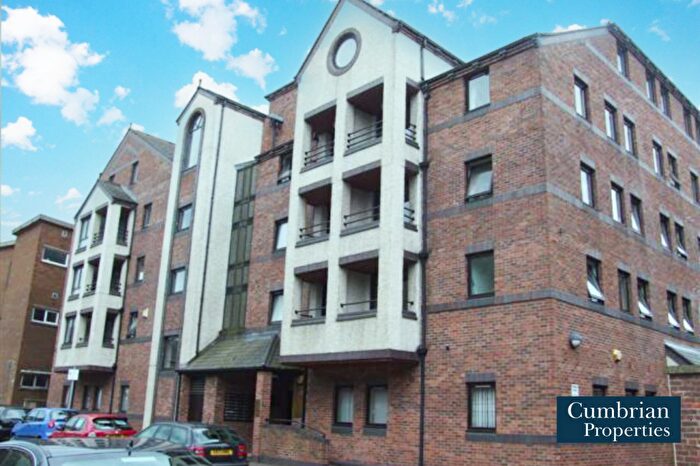
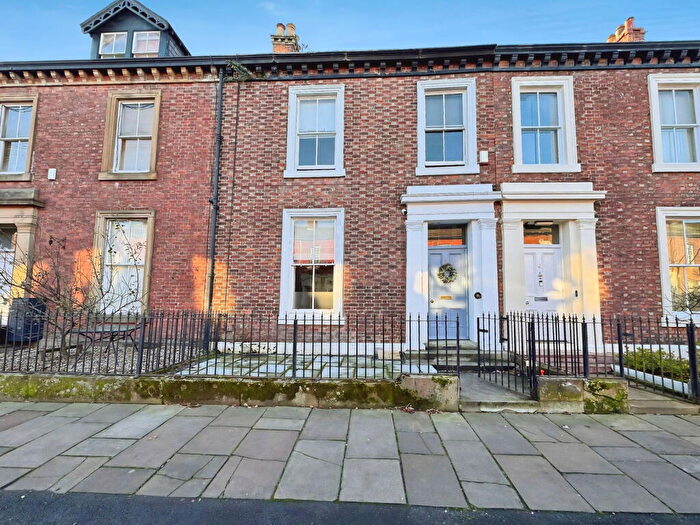
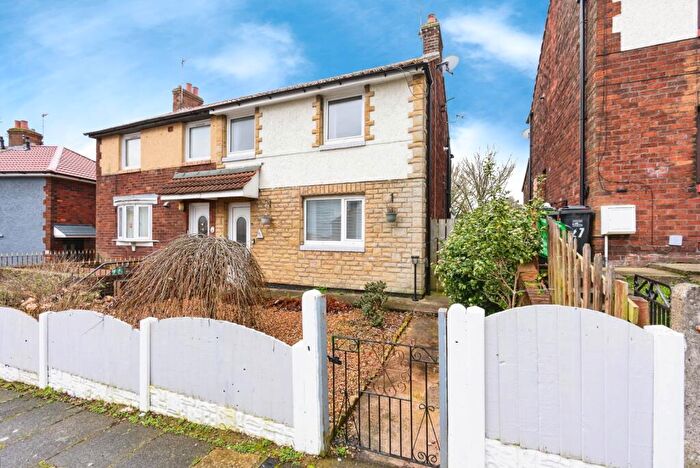
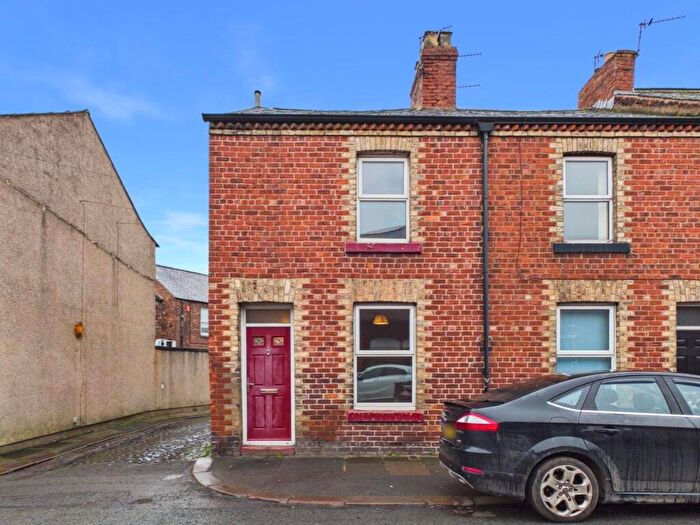
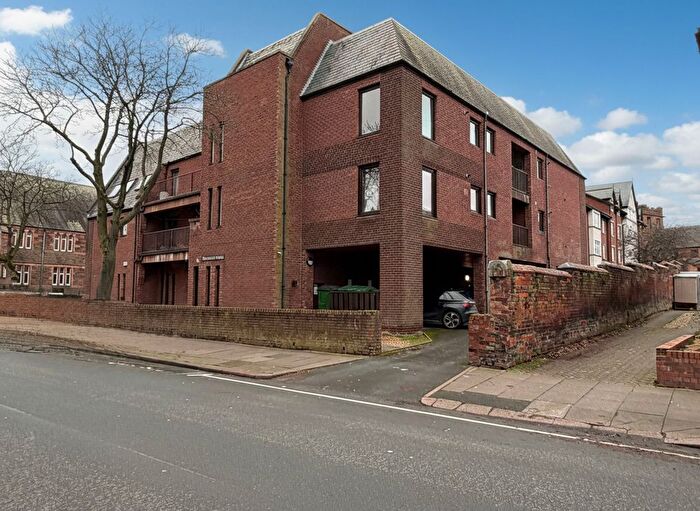
Properties for sale in St Aidans
Roads and Postcodes in St Aidans
Navigate through our locations to find the location of your next house in St Aidans, Carlisle for sale or to rent.
| Streets | Postcodes |
|---|---|
| Adelaide Street | CA1 2DR |
| Alexander Street | CA1 2LH CA1 2LJ |
| Barrock Street | CA1 2EU |
| Botchergate | CA1 1SG |
| Bowman Street | CA1 2HD CA1 2HR |
| Broad Street | CA1 2AG CA1 2AQ |
| Brook Street | CA1 2HP CA1 2HU CA1 2HW CA1 2HX CA1 2HY CA1 2JA |
| Brunton Avenue | CA1 2AU |
| Brunton Crescent | CA1 2AX |
| Charles Street | CA1 2ET |
| Church Close | CA1 2BH |
| Close Street | CA1 2HA CA1 2HB |
| Delagoa Street | CA1 2LZ |
| Delagoa Terrace | CA1 2NY |
| Edward Street | CA1 2EX CA1 2JB CA1 2JE CA1 2JF |
| Eldred Street | CA1 2AS CA1 2AT |
| Farneside Close | CA1 2FL |
| Flower Street | CA1 2JN CA1 2JW |
| Furze Street | CA1 2BW CA1 2DL |
| Fusehill Street | CA1 2ER CA1 2ES CA1 2HE CA1 2HL |
| Garden Street | CA1 2JQ |
| Grace Street | CA1 2AZ |
| Grey Street | CA1 2HJ CA1 2JP |
| Greystone Road | CA1 2BY CA1 2DB CA1 2DD CA1 2DG CA1 2DJ |
| Howe Street | CA1 2HQ CA1 2HS CA1 2HT |
| Irthing Street | CA1 2BB |
| Jack Watt Close | CA1 2FN |
| Jackson Street | CA1 2BD |
| Lindisfarne Court | CA1 2NE |
| Lindisfarne Street | CA1 2NB CA1 2ND |
| Linton Close | CA1 2FJ |
| Linton Street | CA1 2LY |
| London Road | CA1 2JU CA1 2JZ CA1 2LE CA1 2LF CA1 2LG CA1 2LS |
| Margaret Creighton Gardens | CA1 2DN |
| Margery Street | CA1 2BE |
| Melbourne Road | CA1 2DW |
| Melbourne Terrace | CA1 2FR |
| Melrose Terrace | CA1 2DP |
| Myddleton Terrace | CA1 2AD |
| Nook Street | CA1 2DF |
| Orchard Street | CA1 2JL |
| Oswald Street | CA1 2LU CA1 2LX |
| Petteril Street | CA1 2AJ CA1 2AN CA1 2AW |
| Raven Street | CA1 2DQ |
| River Street | CA1 2AL |
| Riverside Way | CA1 2DZ |
| Roseville Terrace | CA1 2JD |
| Rydal Street | CA1 1SQ CA1 2AF |
| Short Street | CA1 2AY |
| South Henry Street | CA1 1SE CA1 2BN |
| South Street | CA1 2EP CA1 2EW |
| St Aidans Road | CA1 1LS CA1 1LT |
| Sybil Street | CA1 2DS CA1 2DT |
| Thirlwell Avenue | CA1 2BU |
| Thirlwell Gardens | CA1 2DU |
| Thomson Street | CA1 2LP CA1 2LW |
| Threave Court | CA1 2DY |
| Tramside Way | CA1 2FH |
| Tullie Street | CA1 2AP CA1 2AR CA1 2BA |
| Vasey Crescent | CA1 2BG |
| Victoria Place | CA1 1LR |
| Waller Street | CA1 2DA |
| Warwick Road | CA1 1LF CA1 1LG CA1 1LH CA1 1LJ CA1 1LP CA1 1LQ CA1 1LU CA1 2BX |
| Watson Street | CA1 2LL |
Transport near St Aidans
- FAQ
- Price Paid By Year
- Property Type Price
Frequently asked questions about St Aidans
What is the average price for a property for sale in St Aidans?
The average price for a property for sale in St Aidans is £117,354. This amount is 36% lower than the average price in Carlisle. There are 1,337 property listings for sale in St Aidans.
What streets have the most expensive properties for sale in St Aidans?
The streets with the most expensive properties for sale in St Aidans are St Aidans Road at an average of £460,000, Warwick Road at an average of £213,479 and Petteril Street at an average of £192,136.
What streets have the most affordable properties for sale in St Aidans?
The streets with the most affordable properties for sale in St Aidans are Orchard Street at an average of £52,500, South Henry Street at an average of £60,000 and Threave Court at an average of £64,838.
Which train stations are available in or near St Aidans?
Some of the train stations available in or near St Aidans are Carlisle, Wetheral and Dalston.
Property Price Paid in St Aidans by Year
The average sold property price by year was:
| Year | Average Sold Price | Price Change |
Sold Properties
|
|---|---|---|---|
| 2025 | £123,580 | 8% |
117 Properties |
| 2024 | £113,446 | -2% |
134 Properties |
| 2023 | £115,802 | -25% |
132 Properties |
| 2022 | £144,188 | 17% |
147 Properties |
| 2021 | £119,185 | 12% |
178 Properties |
| 2020 | £105,291 | 4% |
110 Properties |
| 2019 | £100,982 | -4% |
103 Properties |
| 2018 | £104,742 | 10% |
123 Properties |
| 2017 | £93,979 | 11% |
131 Properties |
| 2016 | £83,579 | -18% |
112 Properties |
| 2015 | £98,287 | -6% |
119 Properties |
| 2014 | £104,667 | -0,5% |
110 Properties |
| 2013 | £105,182 | -9% |
106 Properties |
| 2012 | £114,529 | 2% |
99 Properties |
| 2011 | £111,864 | 3% |
105 Properties |
| 2010 | £108,292 | 6% |
104 Properties |
| 2009 | £101,299 | -18% |
84 Properties |
| 2008 | £119,676 | 5% |
100 Properties |
| 2007 | £113,470 | 12% |
246 Properties |
| 2006 | £100,100 | 15% |
199 Properties |
| 2005 | £85,430 | -1% |
143 Properties |
| 2004 | £85,946 | 27% |
201 Properties |
| 2003 | £62,885 | 28% |
228 Properties |
| 2002 | £45,016 | 8% |
221 Properties |
| 2001 | £41,262 | -3% |
206 Properties |
| 2000 | £42,608 | 1% |
163 Properties |
| 1999 | £42,023 | 4% |
152 Properties |
| 1998 | £40,340 | 10% |
133 Properties |
| 1997 | £36,465 | -3% |
163 Properties |
| 1996 | £37,665 | 3% |
129 Properties |
| 1995 | £36,393 | - |
123 Properties |
Property Price per Property Type in St Aidans
Here you can find historic sold price data in order to help with your property search.
The average Property Paid Price for specific property types in the last three years are:
| Property Type | Average Sold Price | Sold Properties |
|---|---|---|
| Semi Detached House | £151,941.00 | 41 Semi Detached Houses |
| Detached House | £295,750.00 | 4 Detached Houses |
| Terraced House | £114,392.00 | 310 Terraced Houses |
| Flat | £74,019.00 | 28 Flats |

