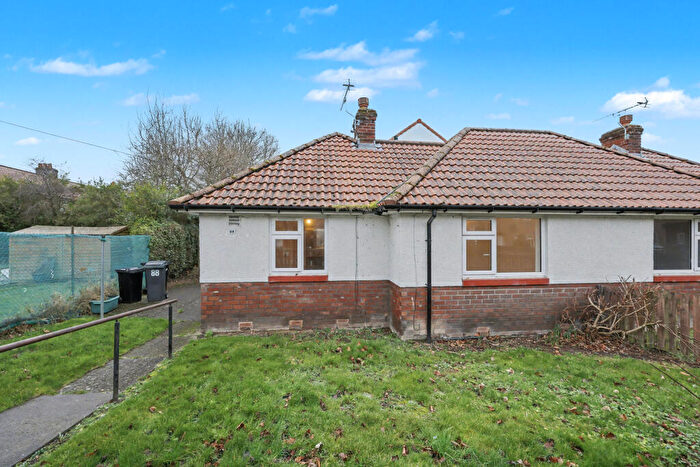
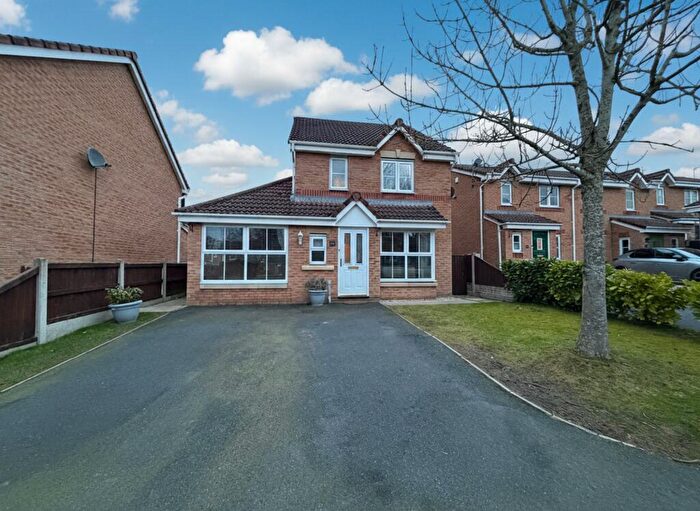
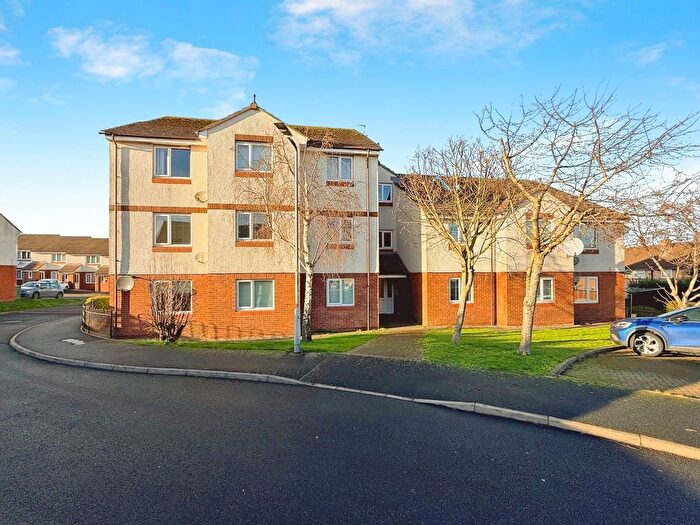
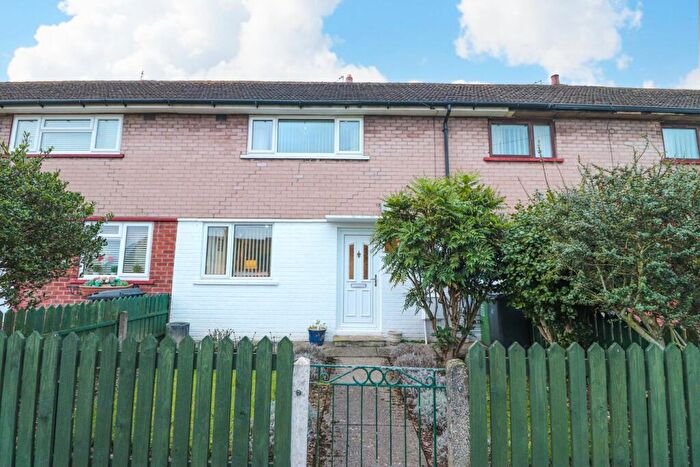
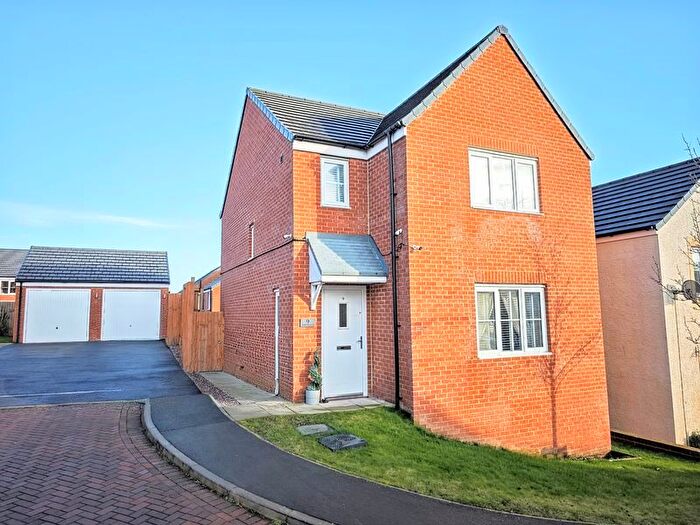
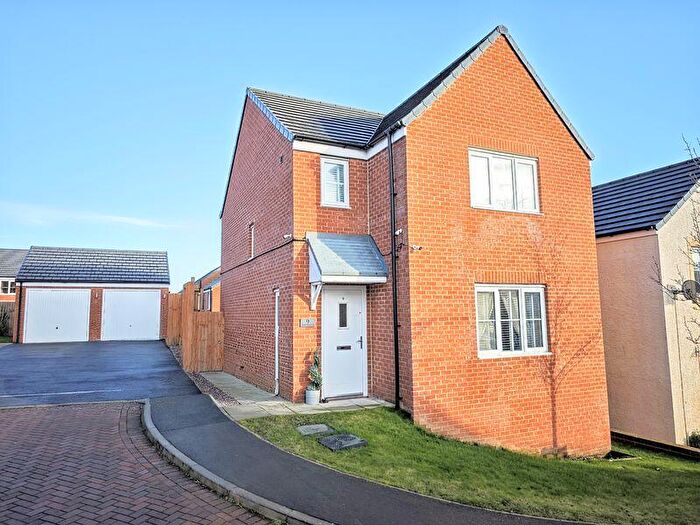
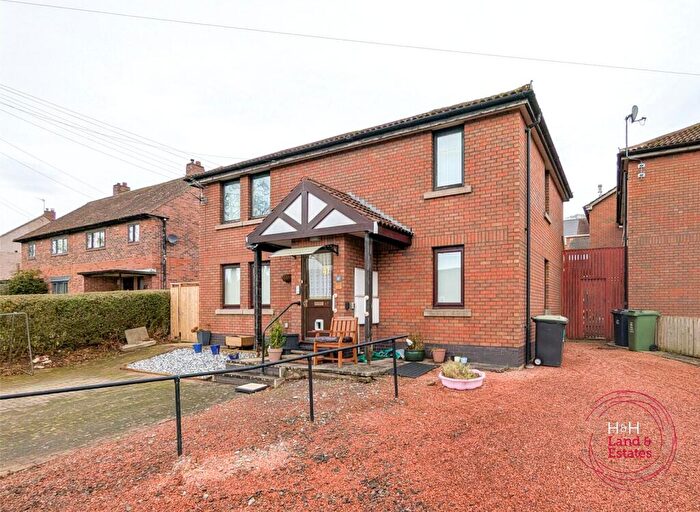
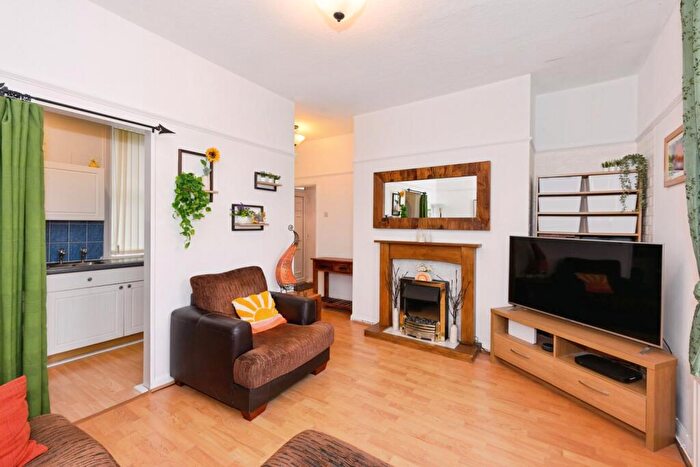
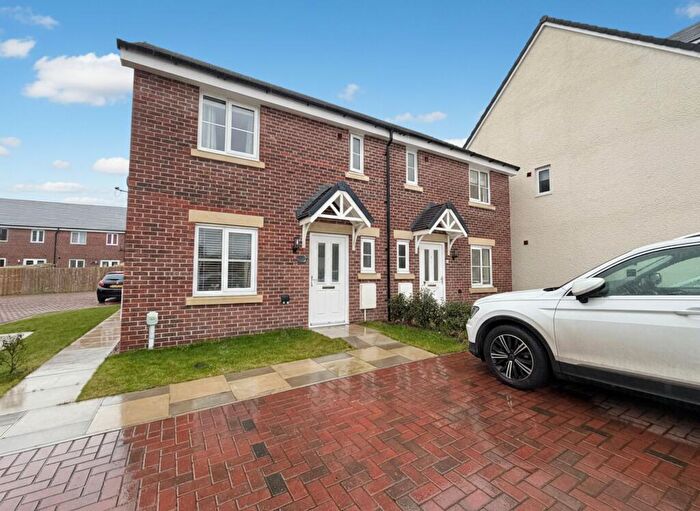
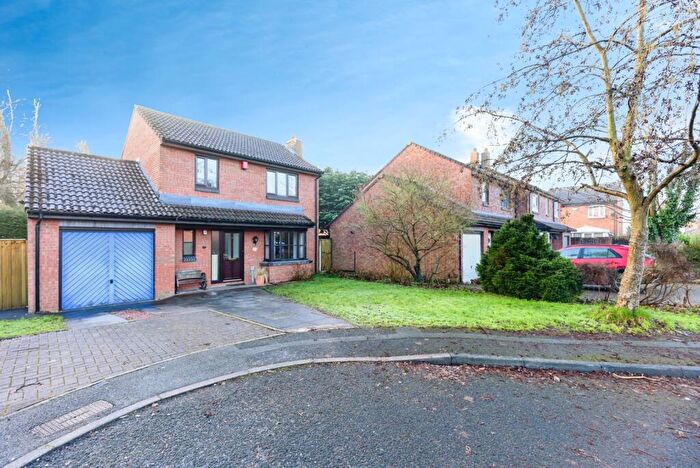
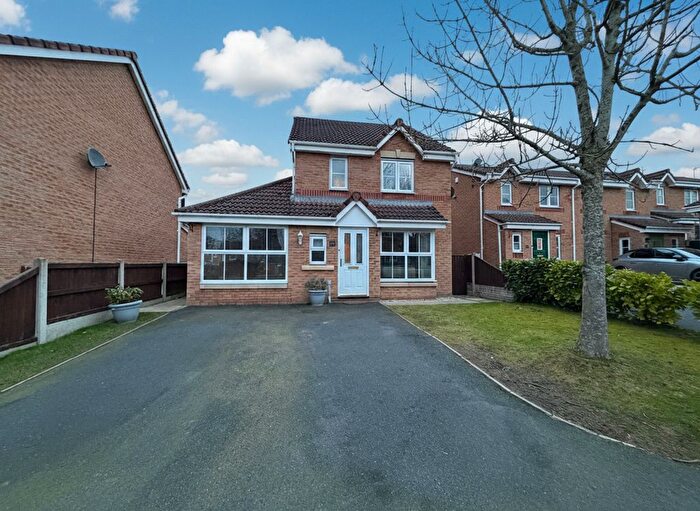
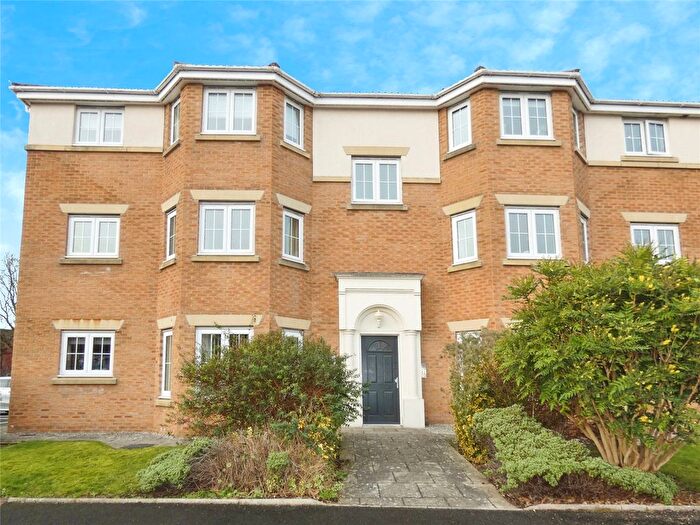
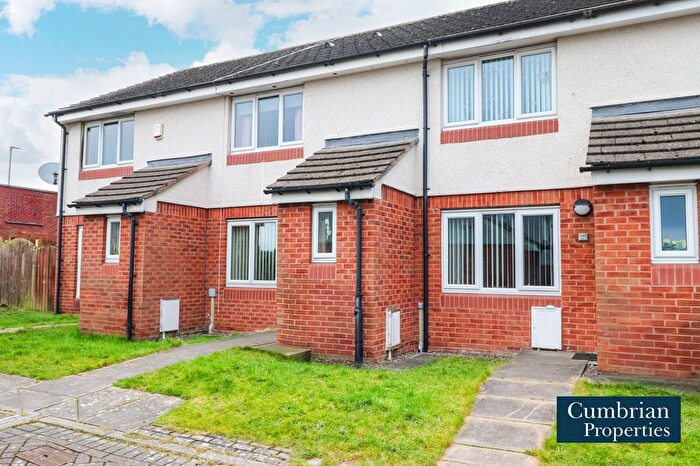
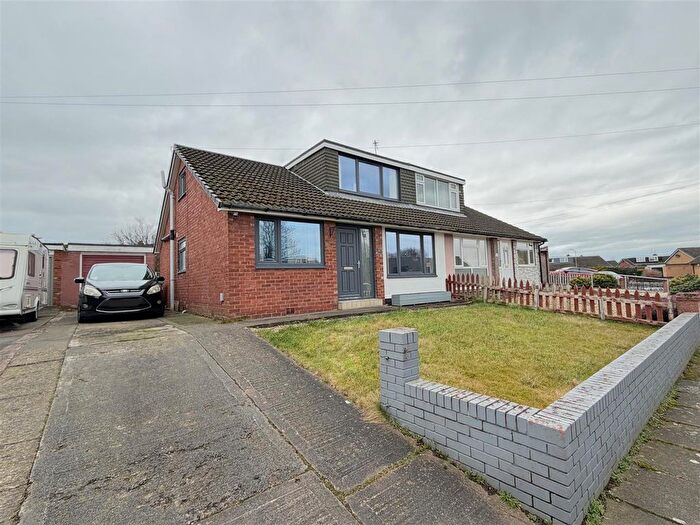
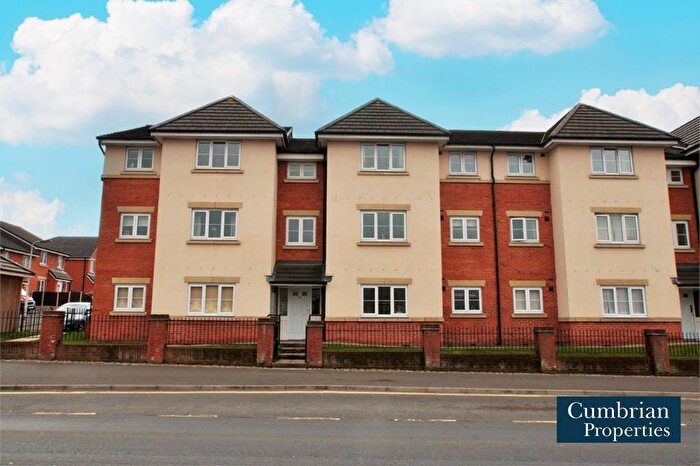
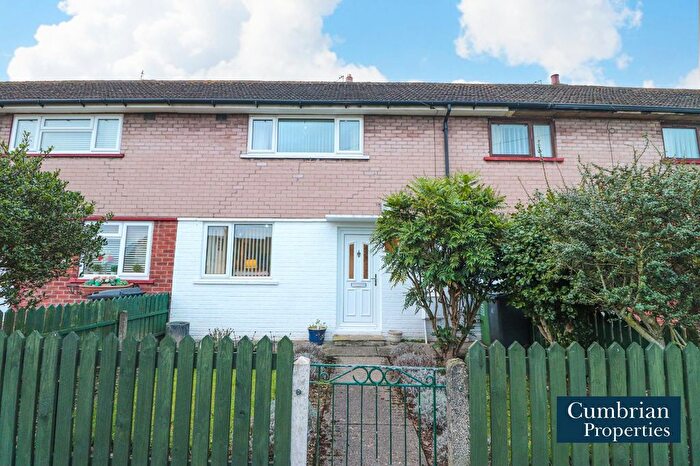
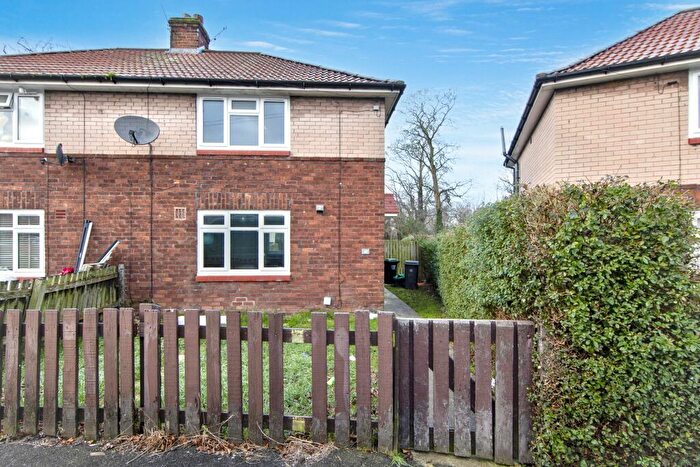
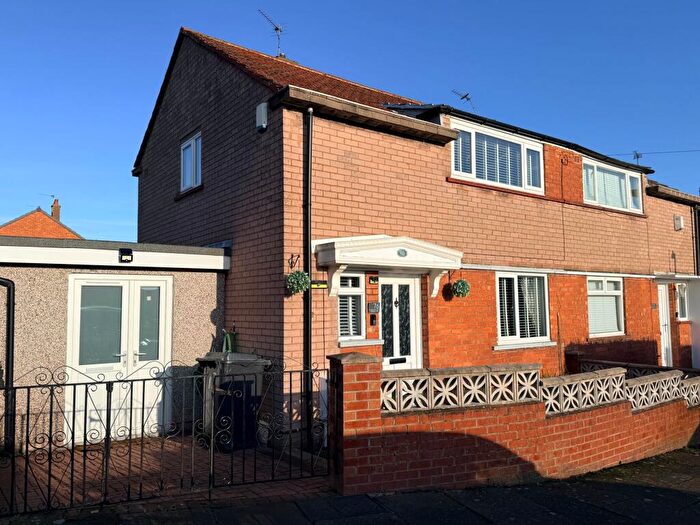
Houses for sale & to rent in Harraby, Carlisle
House Prices in Harraby
Properties in Harraby have an average house price of £150,235.00 and had 270 Property Transactions within the last 3 years¹.
Harraby is an area in Carlisle, Cumbria with 2,801 households², where the most expensive property was sold for £315,000.00.
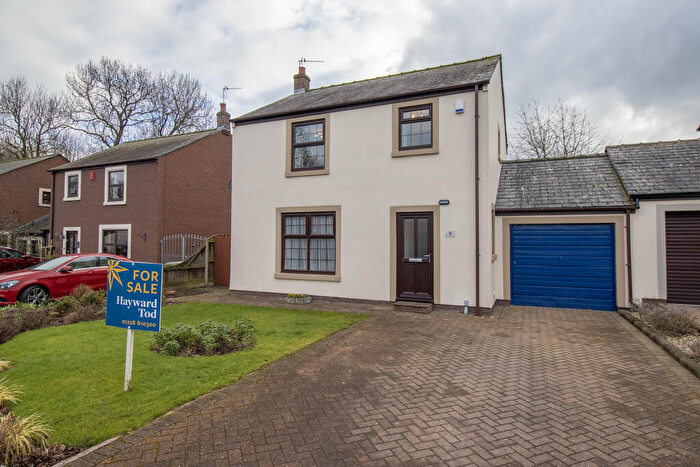
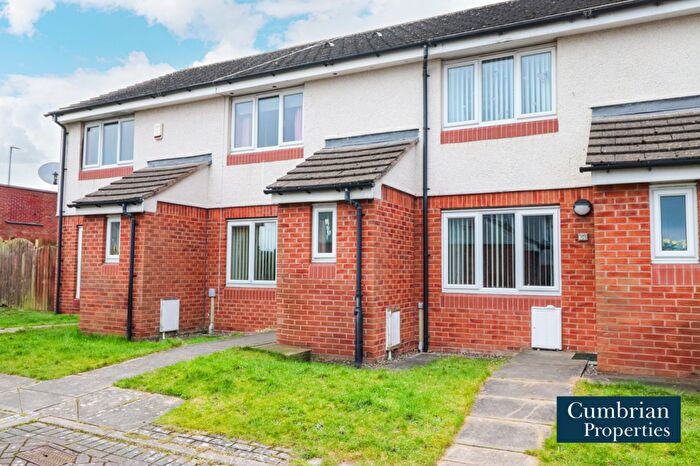
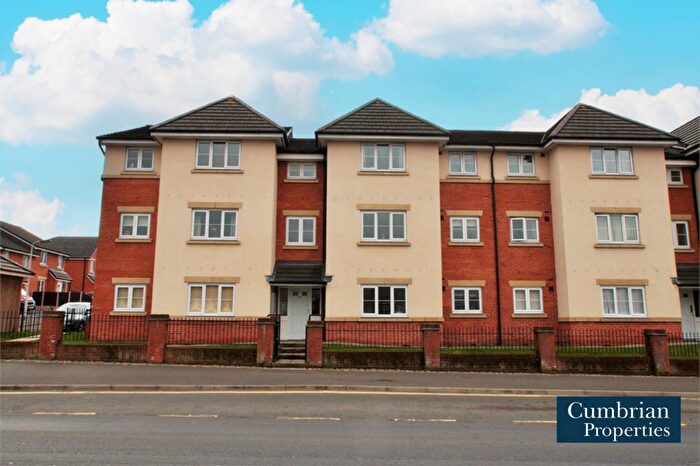
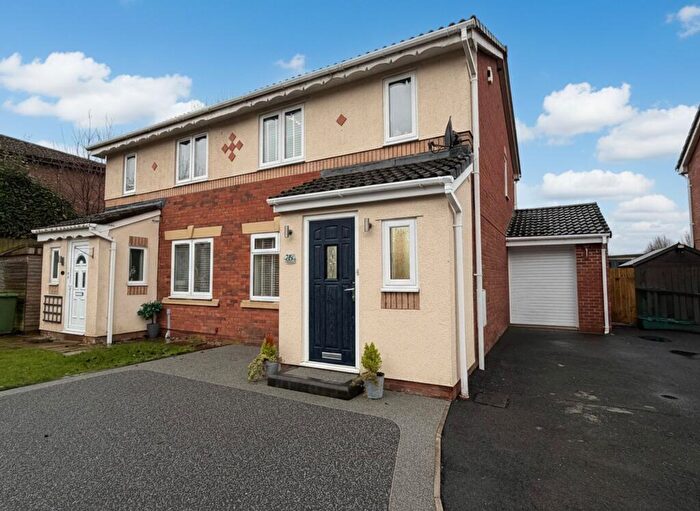
Properties for sale in Harraby
Previously listed properties in Harraby
Roads and Postcodes in Harraby
Navigate through our locations to find the location of your next house in Harraby, Carlisle for sale or to rent.
| Streets | Postcodes |
|---|---|
| Argyll Drive | CA1 3PB |
| Arnside Road | CA1 3PS |
| Ashford Way | CA1 3LG |
| Blackburn Drive | CA1 3HY |
| Brookfield Gardens | CA1 2PJ |
| Broome Court | CA1 2RA CA1 2RB |
| Carliol Close | CA1 2QP |
| Carliol Drive | CA1 2RD CA1 2RE CA1 2RF CA1 2RG |
| Cavaghan Gardens | CA1 3BF CA1 3BY |
| Central Avenue | CA1 3QB |
| Chertsey Bank | CA1 2QF |
| Chertsey Grove | CA1 2QY |
| Chertsey Mount | CA1 2PH |
| Crossways | CA1 3JG CA1 3JT CA1 3JU CA1 3JW |
| Cumwhinton Road | CA1 3JA CA1 3JB CA1 3JD CA1 3JE CA1 3LA CA1 3PA |
| Dalegarth Avenue | CA1 3LS CA1 3LT |
| Edgehill Road | CA1 3LJ CA1 3PE CA1 3PF CA1 3PG CA1 3PR CA1 3SN |
| Farbrow Road | CA1 3HW |
| Forest Hill | CA1 3HF CA1 3HS |
| Gooseland Head | CA1 3HG |
| Grange Road | CA1 2QT |
| Harraby Gardens | CA1 2QZ |
| Harraby Green Road | CA1 2QA |
| Harraby Grove | CA1 2QN |
| Harraby Grove Court | CA1 2QR |
| Hazel Dene | CA1 3JR CA1 3JS |
| Herbert Street | CA1 2QE |
| High Bank Close | CA1 2QG |
| High Green Croft | CA1 3HP CA1 3HR |
| High Road | CA1 2QU |
| Highwood Crescent | CA1 3LE CA1 3LF |
| Hillary Grove | CA1 3JH CA1 3JP CA1 3JQ |
| Hillcrest Avenue | CA1 2QJ |
| Hillcrest Close | CA1 2QL |
| Hillcrest Court | CA1 2PU |
| Hopes Hill Drive | CA1 3LB CA1 3LD CA1 3LH CA1 3LQ |
| Johnston Drive | CA1 2FE |
| Lazonby Terrace | CA1 2PZ |
| Leywell Drive | CA1 3TN |
| Linden Terrace | CA1 3PJ |
| Lingmoor Terrace | CA1 3NZ |
| Lingmoor Way | CA1 3LL CA1 3LW |
| London Road | CA1 2QH CA1 2QS CA1 2QW CA1 3DB CA1 3DF CA1 3DL CA1 3DQ CA1 3EJ CA1 3EP CA1 3ER CA1 3ES CA1 3EY CA1 3EZ CA1 3HA |
| London Road Terrace | CA1 2PF |
| Longdyke Drive | CA1 3HT |
| Longholme Road | CA1 3HN CA1 3HU |
| Longmans Close | CA1 3TL |
| Mallyclose Drive | CA1 3HB CA1 3HD CA1 3HE CA1 3HH CA1 3HJ CA1 3HQ |
| Mayfield Avenue | CA1 3LU CA1 3LY CA1 3LZ CA1 3NA CA1 3NB |
| Meadow View | CA1 3DR CA1 3JJ CA1 3JL CA1 3JN |
| Pennine Way | CA1 3QQ |
| Petteril Terrace | CA1 2PS |
| Richard James Avenue | CA1 2FD |
| School Road | CA1 3LX |
| Simmerson Drive | CA1 3HZ |
| Summerhill | CA1 2NW |
| Trevor Street | CA1 2NH CA1 2NJ CA1 2NQ |
| Warnell Drive | CA1 3LP CA1 3LR |
| Watermans Walk | CA1 3TJ CA1 3TU |
| Welsh Road | CA1 3AY |
| Whinsmoor Drive | CA1 3PT CA1 3PU CA1 3PX CA1 3PY |
| Winton Crescent | CA1 3JX CA1 3JY CA1 3JZ |
Transport near Harraby
- FAQ
- Price Paid By Year
- Property Type Price
Frequently asked questions about Harraby
What is the average price for a property for sale in Harraby?
The average price for a property for sale in Harraby is £150,235. This amount is 18% lower than the average price in Carlisle. There are 851 property listings for sale in Harraby.
What streets have the most expensive properties for sale in Harraby?
The streets with the most expensive properties for sale in Harraby are Farbrow Road at an average of £315,000, Highwood Crescent at an average of £265,000 and Chertsey Mount at an average of £246,333.
What streets have the most affordable properties for sale in Harraby?
The streets with the most affordable properties for sale in Harraby are Central Avenue at an average of £35,000, Welsh Road at an average of £73,000 and Longmans Close at an average of £80,000.
Which train stations are available in or near Harraby?
Some of the train stations available in or near Harraby are Carlisle, Wetheral and Dalston.
Property Price Paid in Harraby by Year
The average sold property price by year was:
| Year | Average Sold Price | Price Change |
Sold Properties
|
|---|---|---|---|
| 2025 | £167,883 | 9% |
58 Properties |
| 2024 | £153,100 | 10% |
102 Properties |
| 2023 | £138,271 | -2% |
110 Properties |
| 2022 | £140,800 | 4% |
120 Properties |
| 2021 | £134,658 | 2% |
141 Properties |
| 2020 | £131,424 | 6% |
81 Properties |
| 2019 | £123,894 | 2% |
118 Properties |
| 2018 | £121,015 | -3% |
107 Properties |
| 2017 | £125,011 | 3% |
106 Properties |
| 2016 | £121,280 | 2% |
93 Properties |
| 2015 | £118,740 | -7% |
125 Properties |
| 2014 | £126,857 | 3% |
104 Properties |
| 2013 | £123,445 | 8% |
81 Properties |
| 2012 | £114,159 | -4% |
92 Properties |
| 2011 | £118,441 | -6% |
104 Properties |
| 2010 | £125,395 | 6% |
104 Properties |
| 2009 | £118,153 | -0,3% |
103 Properties |
| 2008 | £118,562 | -8% |
86 Properties |
| 2007 | £128,536 | 6% |
141 Properties |
| 2006 | £120,261 | 5% |
167 Properties |
| 2005 | £113,729 | 1% |
199 Properties |
| 2004 | £112,551 | 34% |
194 Properties |
| 2003 | £73,809 | 16% |
122 Properties |
| 2002 | £61,860 | 16% |
121 Properties |
| 2001 | £51,957 | 5% |
113 Properties |
| 2000 | £49,468 | 4% |
116 Properties |
| 1999 | £47,368 | 3% |
91 Properties |
| 1998 | £45,739 | 2% |
88 Properties |
| 1997 | £44,634 | -2% |
83 Properties |
| 1996 | £45,308 | 4% |
77 Properties |
| 1995 | £43,382 | - |
74 Properties |
Property Price per Property Type in Harraby
Here you can find historic sold price data in order to help with your property search.
The average Property Paid Price for specific property types in the last three years are:
| Property Type | Average Sold Price | Sold Properties |
|---|---|---|
| Semi Detached House | £154,393.00 | 119 Semi Detached Houses |
| Detached House | £234,676.00 | 34 Detached Houses |
| Terraced House | £135,298.00 | 86 Terraced Houses |
| Flat | £83,093.00 | 31 Flats |

