
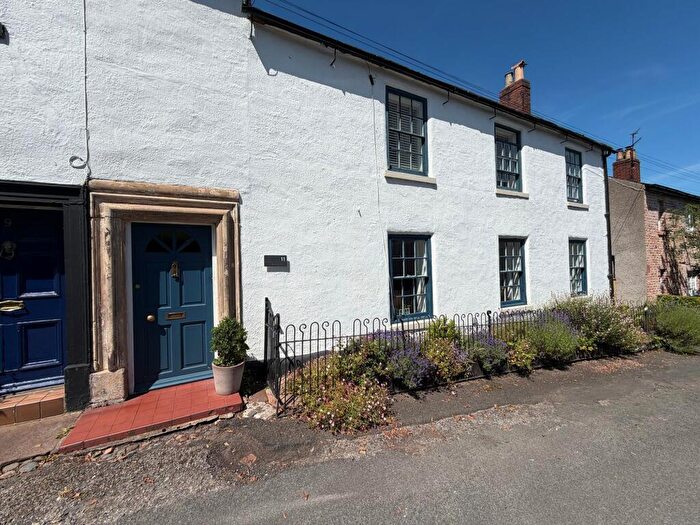
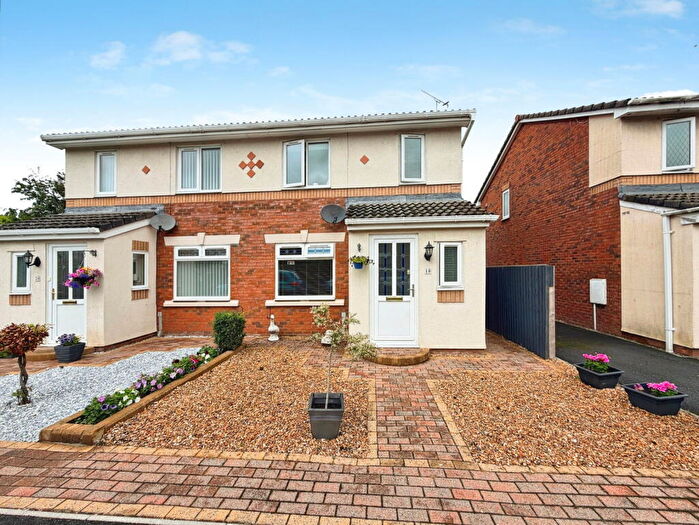
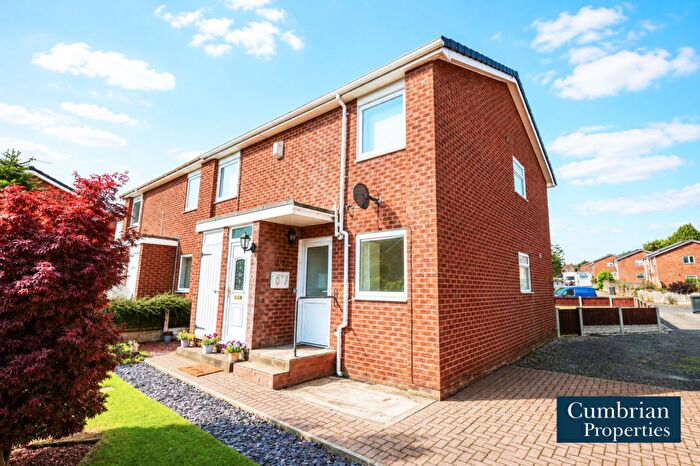
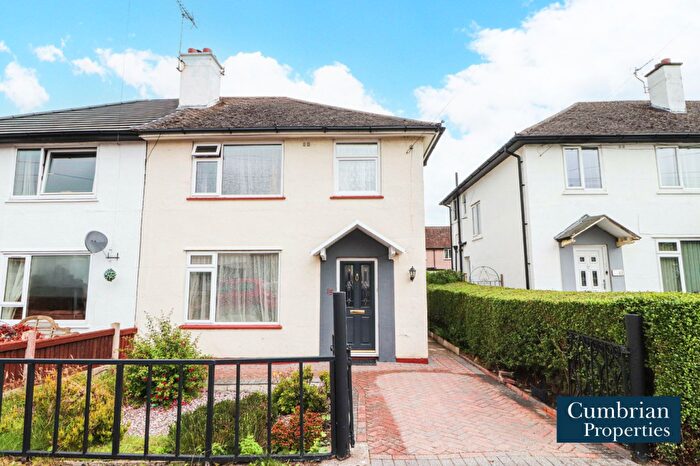
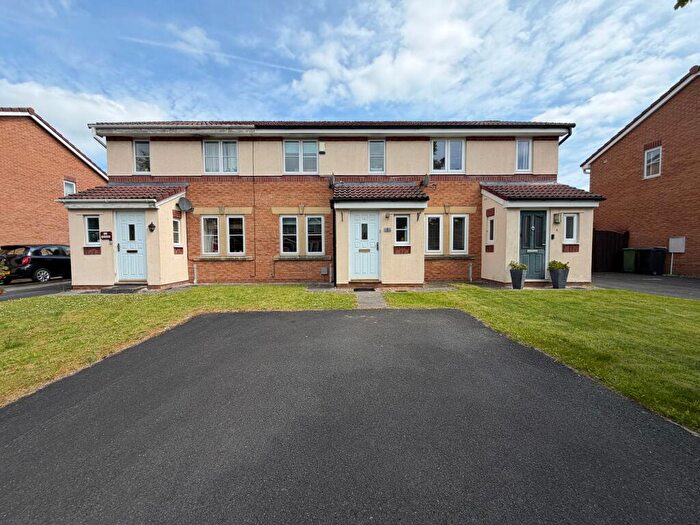
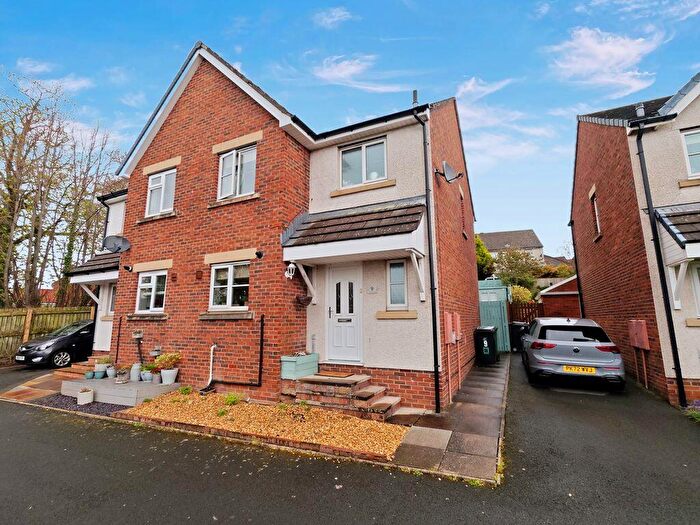
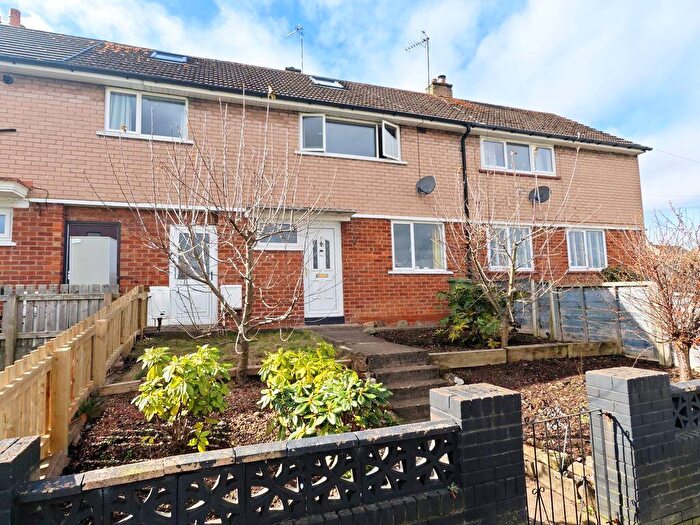
Houses for sale in Botcherby, Carlisle
House Prices in Botcherby
Properties in Botcherby have an average house price of £126k and had 232 Property Transactions within the last 3 years¹.
Botcherby is an area in Carlisle, Cumbria with 2,635 households², where the most expensive property was sold for £338k.
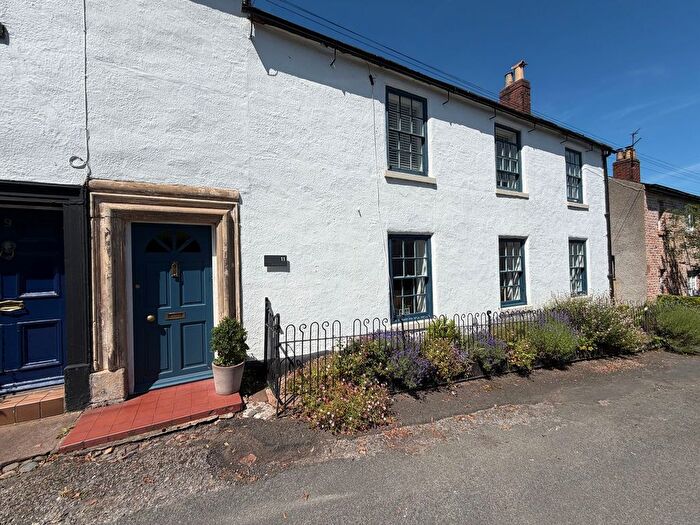
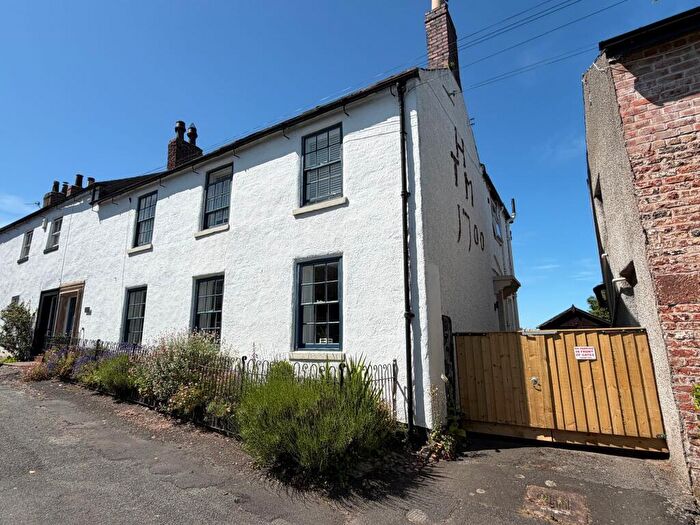
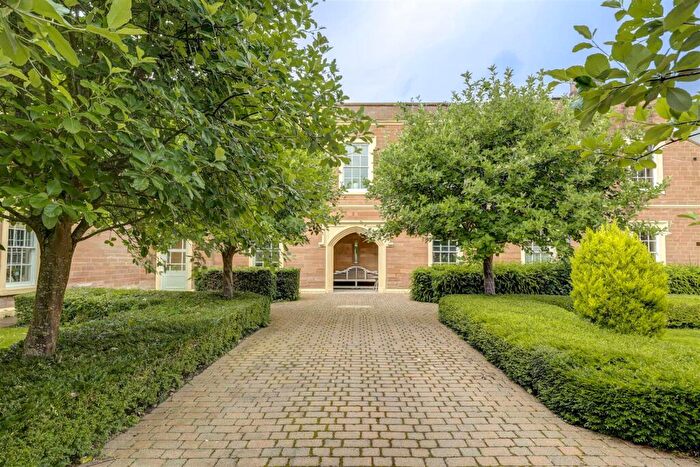
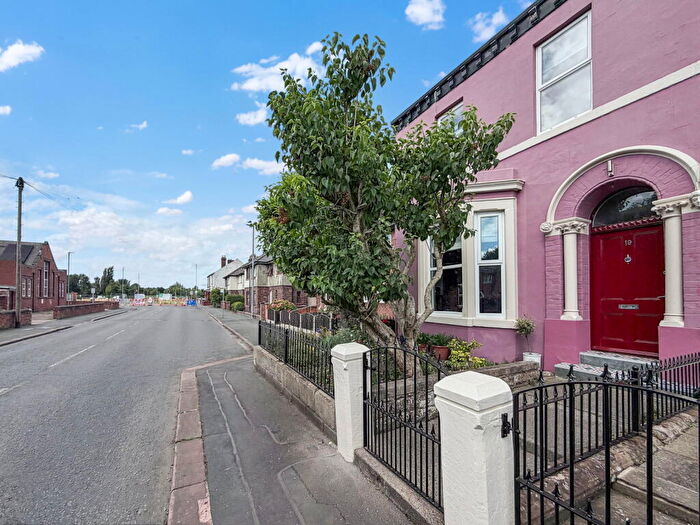
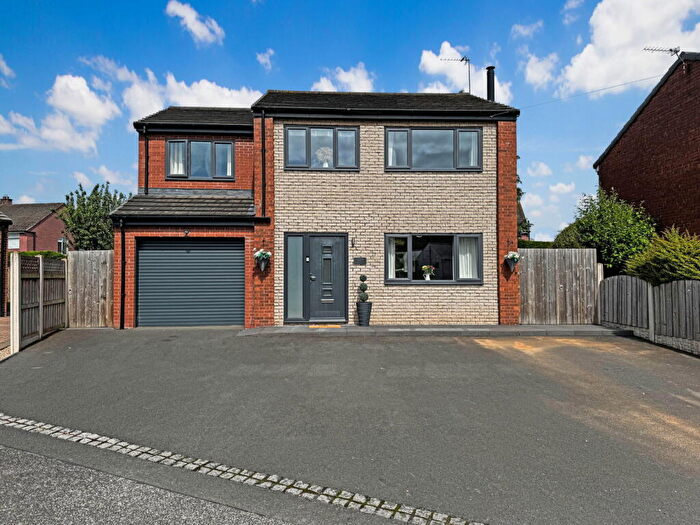
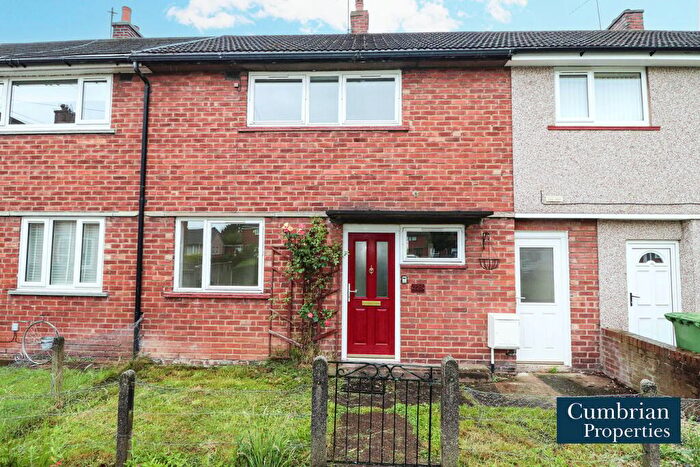
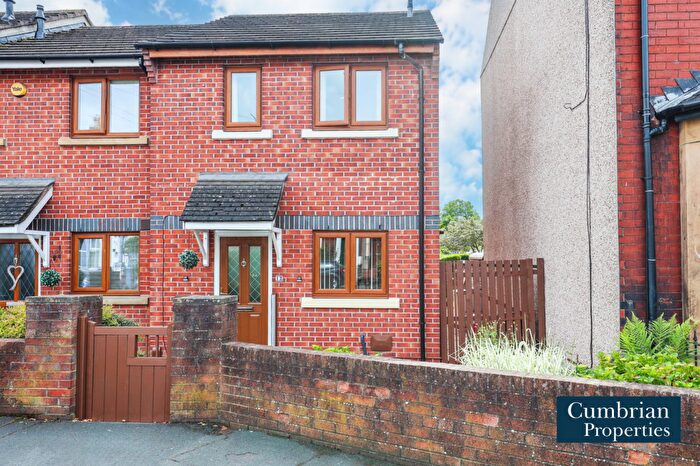
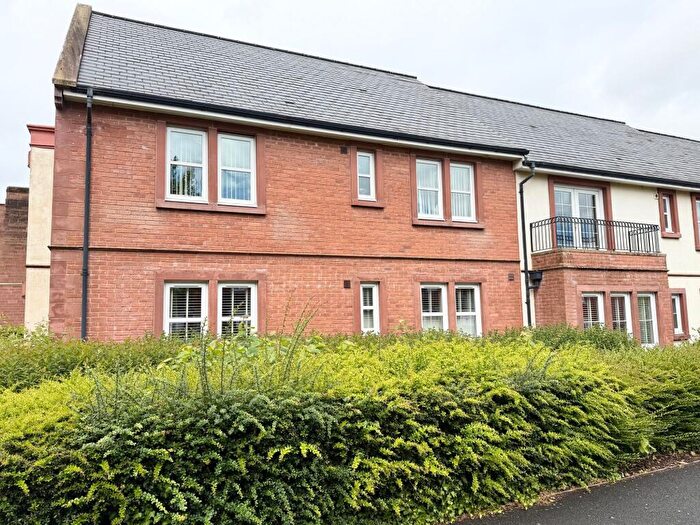
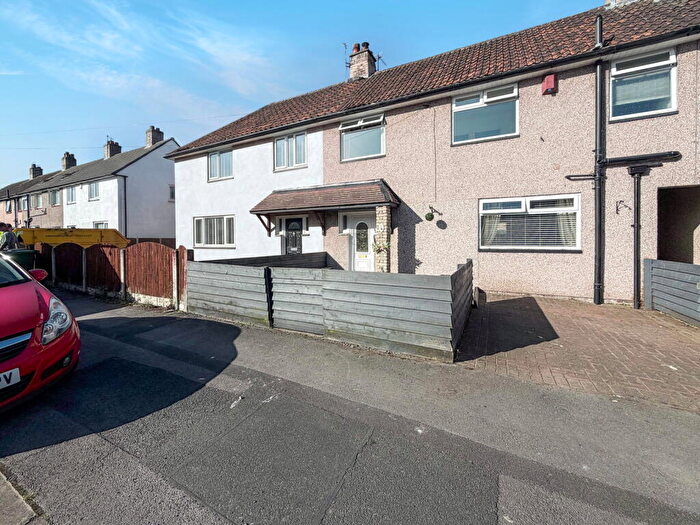
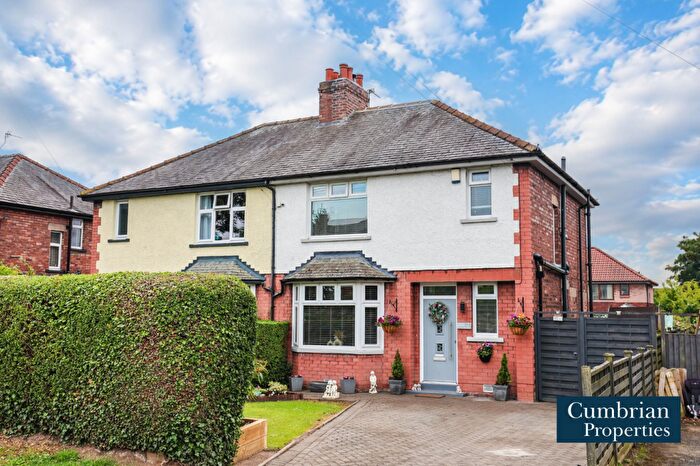
Properties for sale in Botcherby
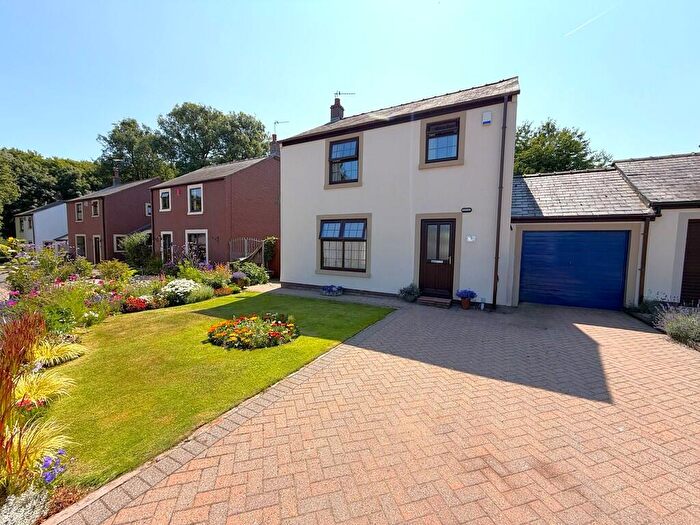
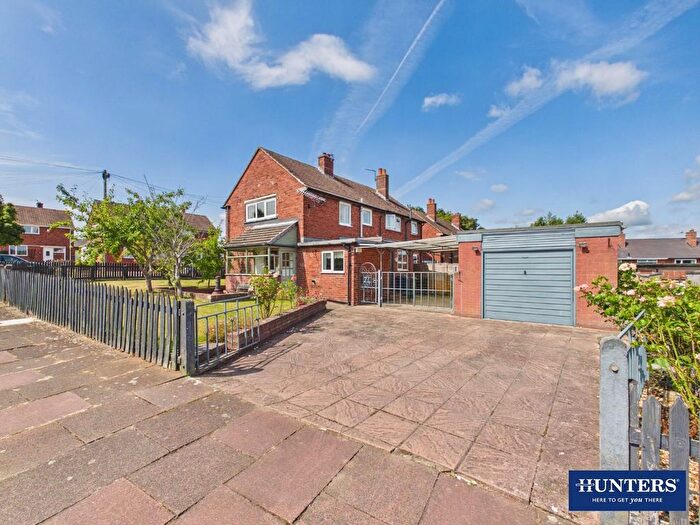
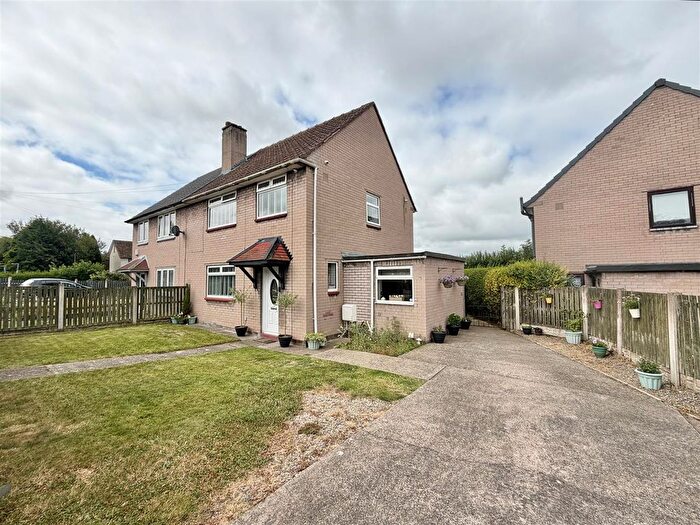
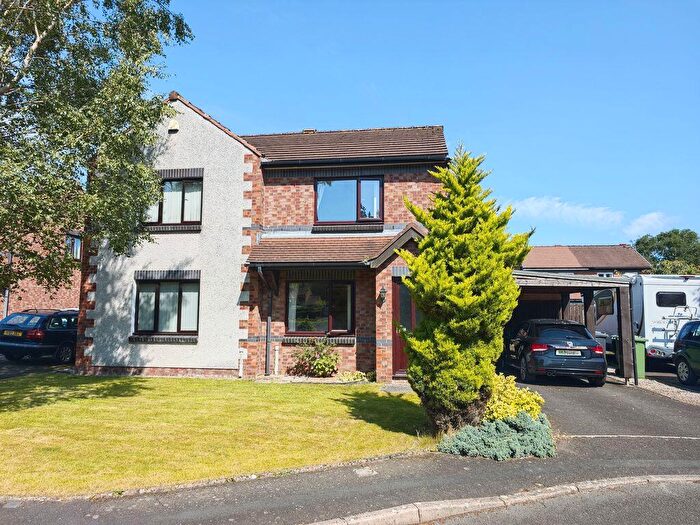
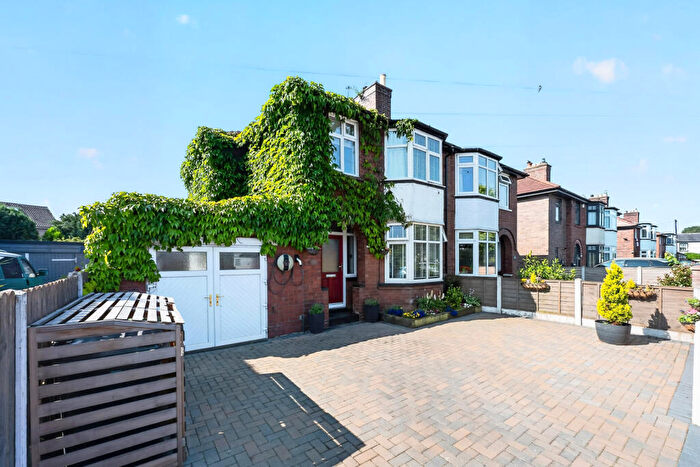
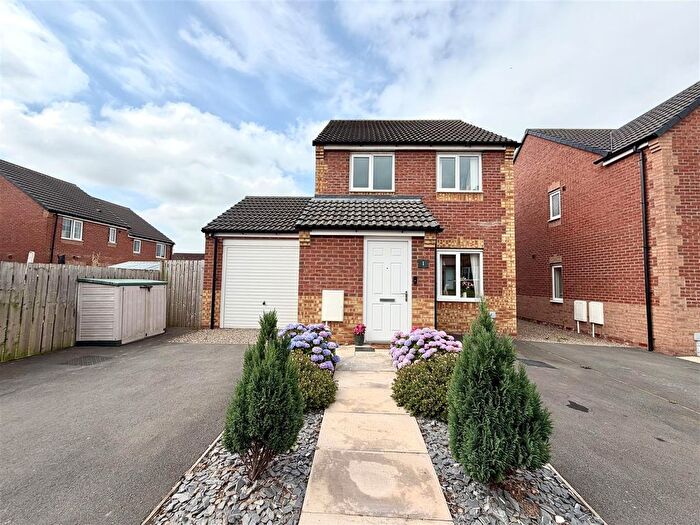
![]()
If you are looking to sell your house, let it out, or receive a property valuation, an expert can help you.
Click the button below to get started.

Roads and Postcodes in Botcherby
Navigate through our locations to find the location of your next house in Botcherby, Carlisle for sale or to rent.
| Streets | Postcodes |
|---|---|
| Agricola Way | CA1 2FX |
| Allandale Road | CA1 3SJ |
| Allenbrook Road | CA1 2UT |
| Auchinlek Drive | CA1 2UR |
| Banks Lane | CA1 2UD |
| Bedstone Place | CA1 2FU |
| Beverley Rise | CA1 3RX CA1 3RY CA1 3RZ |
| Borland Avenue | CA1 2SX CA1 2SY CA1 2TF CA1 2TJ |
| Botcherby Avenue | CA1 2TU CA1 2TX |
| Bramerton Orchard | CA1 2SH |
| Brantwood Avenue | CA1 3RP CA1 3RR CA1 3RW |
| Broadoaks Grange | CA1 2TA |
| Chapel Brow | CA1 2PP |
| Charlotte Terrace | CA1 2RX |
| Cresswell Avenue | CA1 3RL |
| Cumrew Close | CA1 2XA |
| Curlew Walk | CA1 2WD |
| Durranhill Road | CA1 2RQ CA1 2SP CA1 2SR CA1 2SZ |
| Eden Park Crescent | CA1 2UF CA1 2UG |
| Edgehill Road | CA1 3PW CA1 3SA CA1 3SB CA1 3SD CA1 3SE |
| Eldon Drive | CA1 3RS |
| Ennerdale Avenue | CA1 2TR CA1 2TS |
| Falcon Mews | CA1 2WE |
| Farlam Drive | CA1 2XB |
| Finch Close | CA1 2WB |
| Geltsdale Avenue | CA1 2RL |
| Gilsland Road | CA1 2XD |
| Heron Drive | CA1 2WA |
| Hespek Raise | CA1 2RN |
| Holywell Crescent | CA1 2TD |
| Linden Terrace | CA1 3PH |
| Merith Avenue | CA1 2TN CA1 2TP CA1 2TW |
| Mount Florida | CA1 2SL |
| Oakleigh Way | CA1 2TE |
| Pennine Gardens | CA1 3QG |
| Pennine Way | CA1 3AQ CA1 3QD CA1 3QF CA1 3QH CA1 3QJ CA1 3QL CA1 3QN CA1 3QP CA1 3QW CA1 3RJ CA1 3RN CA1 3RT CA1 3RU |
| Pillar Lane | CA1 2FY |
| Rosevale | CA1 3RG CA1 3RH |
| Scotby Close | CA1 2XG |
| Scotby Gardens | CA1 2XH |
| Silverdale Road | CA1 3SF |
| Springfield Road | CA1 3QR CA1 3QS CA1 3QT CA1 3QU CA1 3QX CA1 3QY |
| St Andrews Close | CA1 2SG |
| St Joseph's Gardens | CA1 2UQ |
| St Josephs Court | CA1 2UH |
| Swann Lane | CA1 2GW |
| Talkin Close | CA1 2RH |
| Tilbury Road | CA1 2SD |
| Tindale Drive | CA1 3SG |
| Victoria Road | CA1 2UE |
| Walkmill Crescent | CA1 2WF |
| Warwick Road | CA1 2BS CA1 2BT CA1 2RU CA1 2RZ CA1 2SB CA1 2UA |
| Westville | CA1 3QE |
| Whimbrel Drive | CA1 2WG |
| Willow Park | CA1 2UB |
| Wingate Road | CA1 2RJ |
| Wood Street | CA1 2SF |
Property price trends in Botcherby
According to the latest Land Registry data, the average home in Botcherby sold for £139,500 in 2026. That figure comes from 2,968 sales logged over the past 31 years.
Prices have continued to climb over the last three years. Compared with 2023, when the typical sale came in around £117,832, that's a rise of roughly 18.4%.
Looking back five years, average prices are up about 24.2% since 2021, a gain of around £27,152 in cash terms.
Zoom out to the past decade for the fuller picture. Back in 2016, homes here averaged £97,108, so the typical sold price has climbed about 43.7% since then, roughly 3.7% a year. Stretch the view to fifteen years and that annual pace eases back to about 3.2%.
Frequently asked questions about Botcherby
What is the average price for a property for sale in Botcherby?
The average price for a property for sale in Botcherby is £126,069. This amount is 31% lower than the average price in Carlisle. There are 877 property listings for sale in Botcherby.
What streets have the most expensive properties for sale in Botcherby?
The streets with the most expensive properties for sale in Botcherby are Banks Lane at an average of £250,000, Bramerton Orchard at an average of £248,333 and Wood Street at an average of £232,500.
What streets have the most affordable properties for sale in Botcherby?
The streets with the most affordable properties for sale in Botcherby are Botcherby Avenue at an average of £66,280, Durranhill Road at an average of £78,833 and Borland Avenue at an average of £80,600.
Which train stations are available in or near Botcherby?
Some of the train stations available in or near Botcherby are Carlisle, Wetheral and Dalston.
Property Price Paid in Botcherby by Year
The average sold property price by year was:
| Year | Average Sold Price | Price Change |
Sold Properties
|
|---|---|---|---|
| 2026 | £139,500 | 4% |
5 Properties |
| 2025 | £133,619 | 7% |
83 Properties |
| 2024 | £123,624 | 5% |
85 Properties |
| 2023 | £117,832 | -4% |
59 Properties |
| 2022 | £121,990 | 8% |
99 Properties |
| 2021 | £112,348 | 11% |
114 Properties |
| 2020 | £99,459 | -6% |
76 Properties |
| 2019 | £104,982 | 2% |
76 Properties |
| 2018 | £102,958 | 2% |
100 Properties |
| 2017 | £101,055 | 4% |
95 Properties |
Property Price per Property Type in Botcherby
Here you can find historic sold price data in order to help with your property search.
The average Property Paid Price for specific property types in the last three years are:
| Property Type | Average Sold Price | Sold Properties |
|---|---|---|
| Semi Detached House | £126,945.00 | 89 Semi Detached Houses |
| Detached House | £229,657.00 | 19 Detached Houses |
| Terraced House | £110,319.00 | 111 Terraced Houses |
| Flat | £103,153.00 | 13 Flats |
