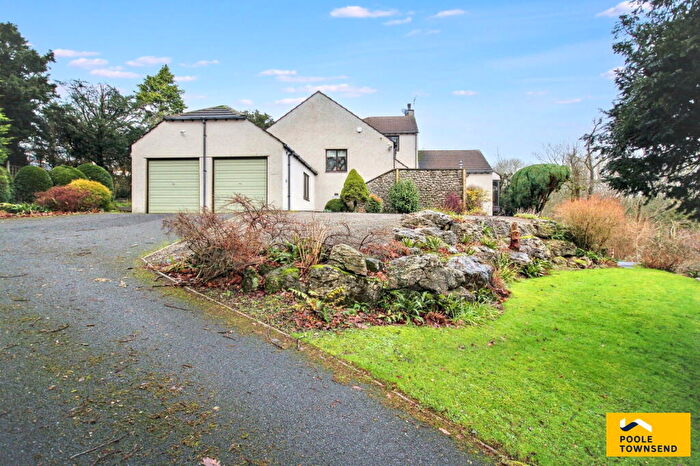
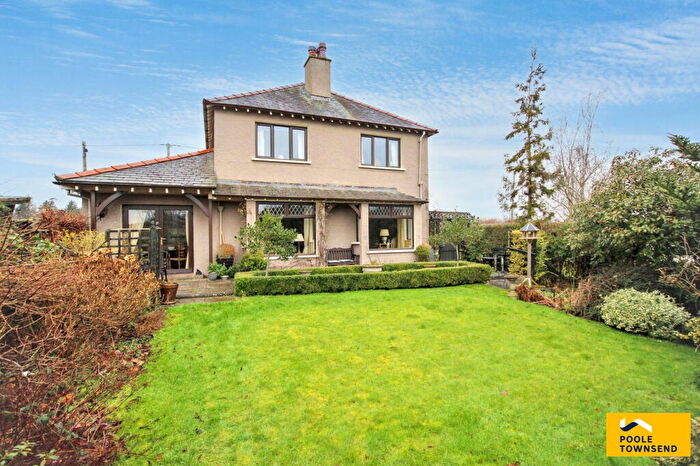
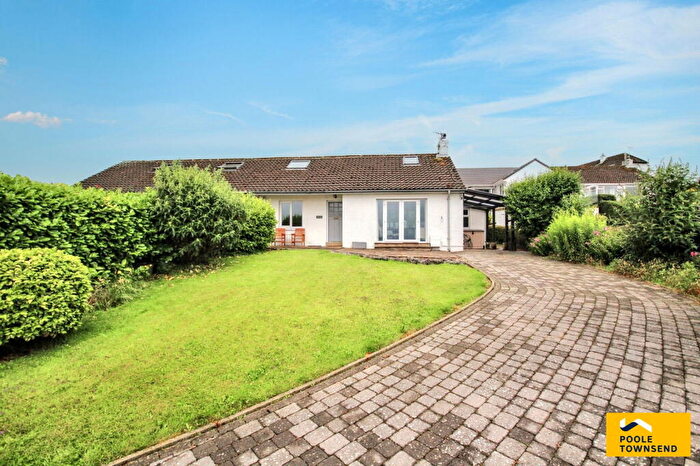
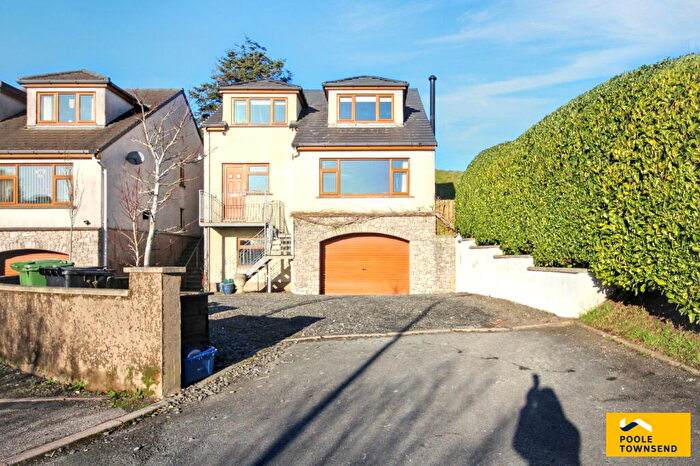
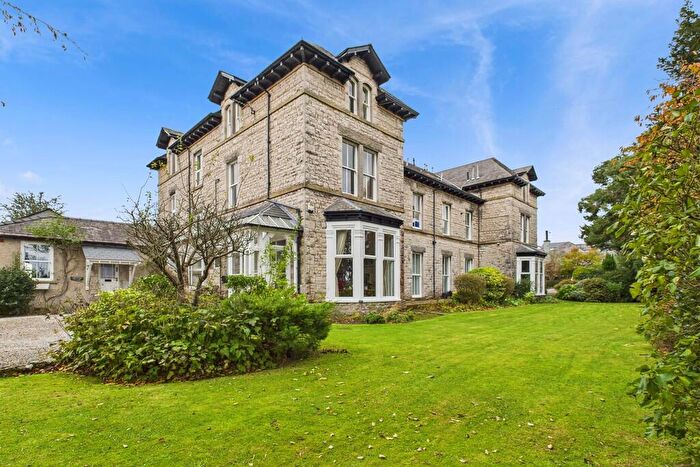
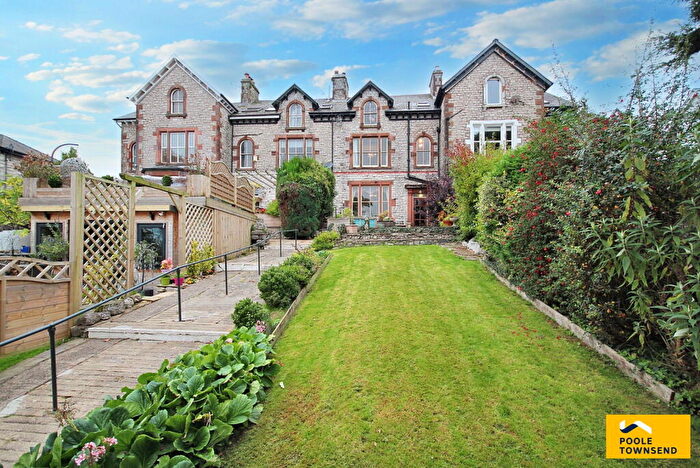
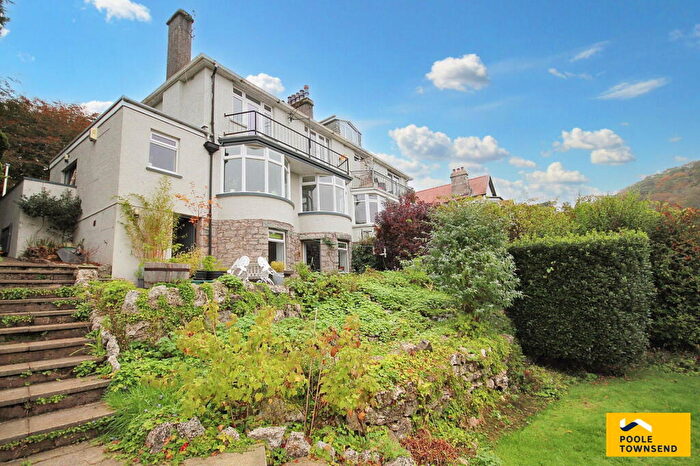
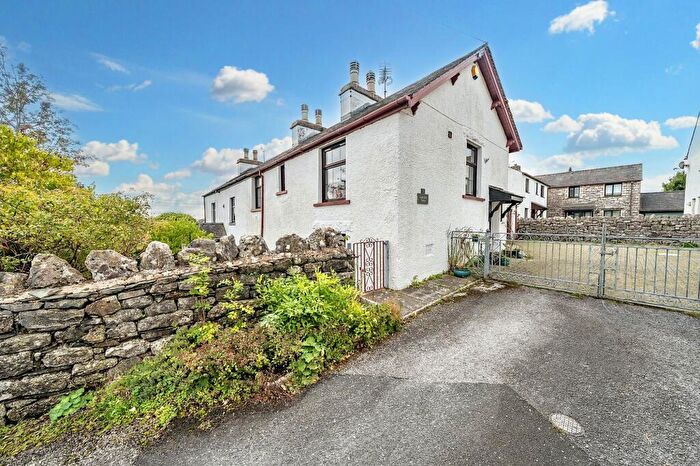
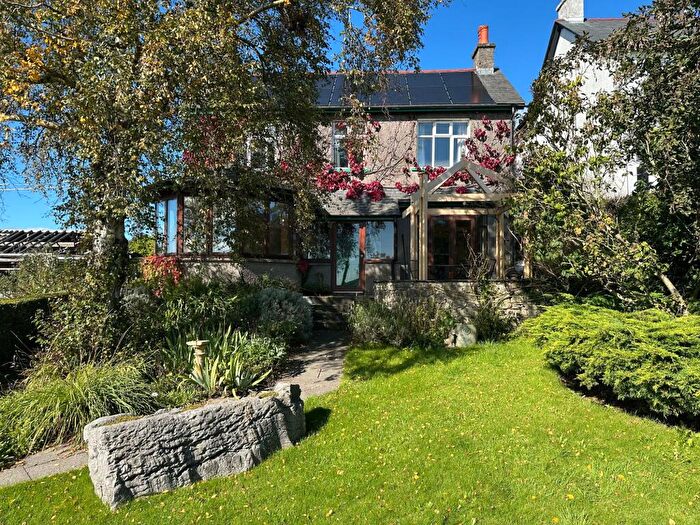
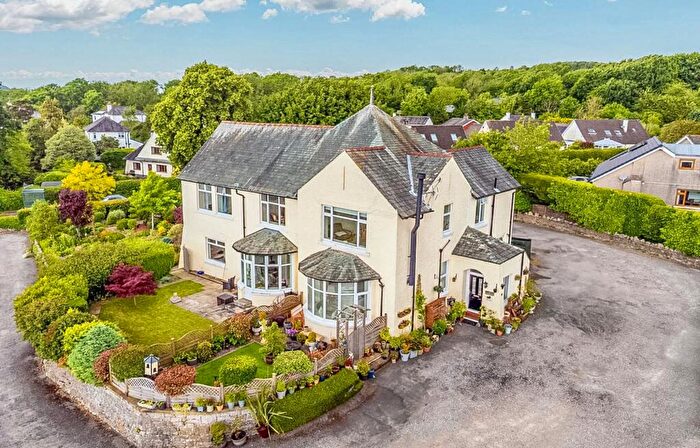
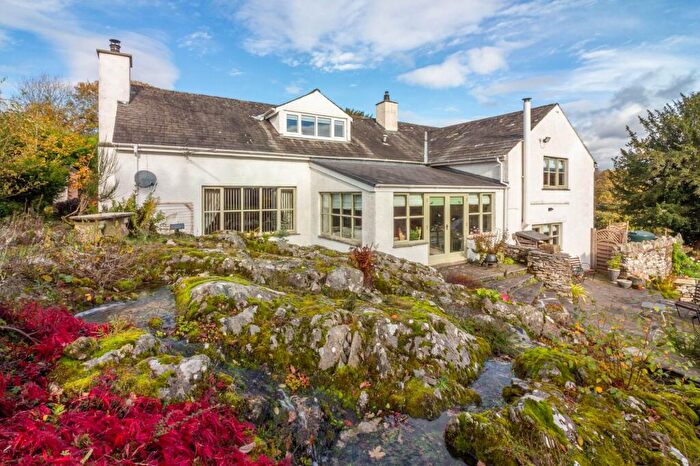
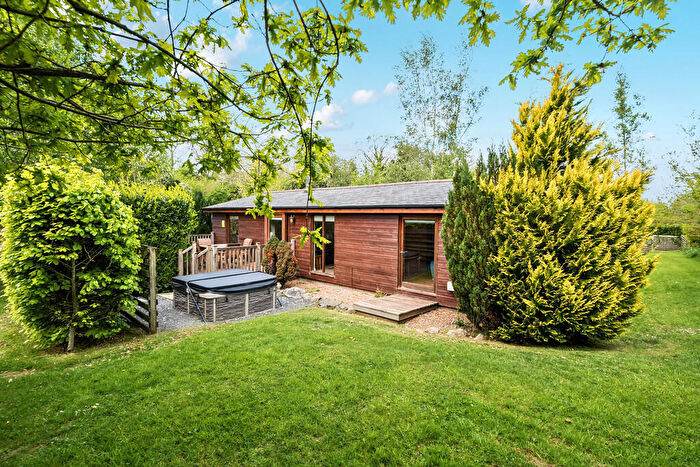
Houses for sale & to rent in Cartmel And Grange West, Grange-over-sands
House Prices in Cartmel And Grange West
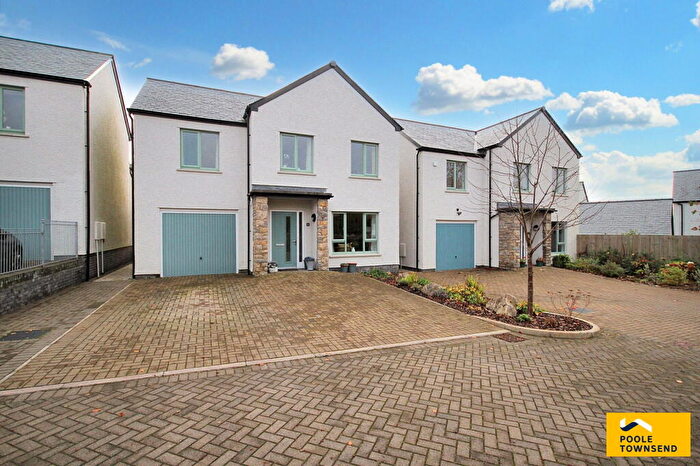
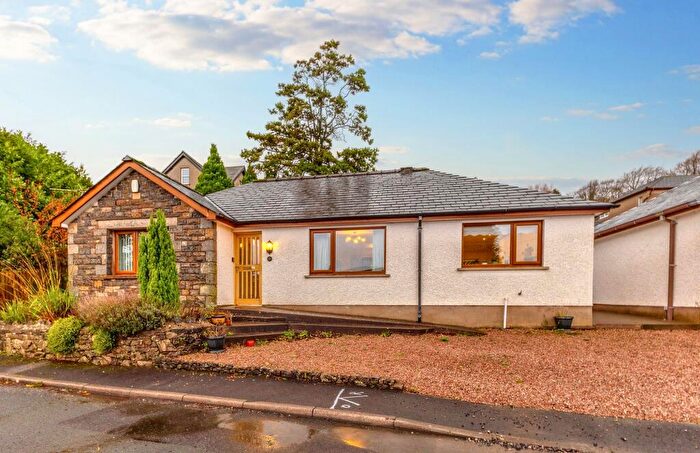
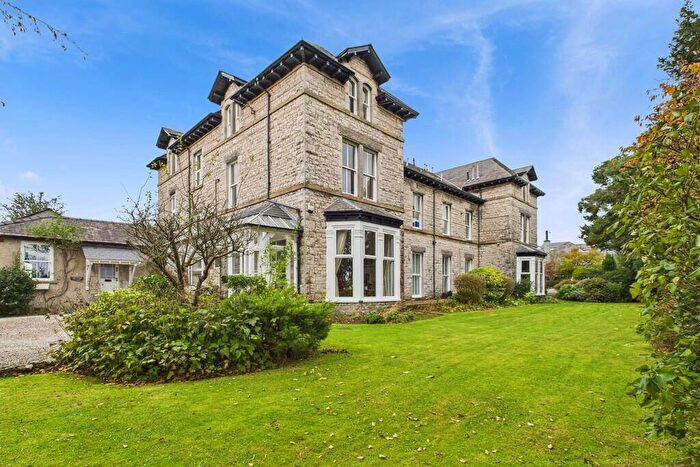
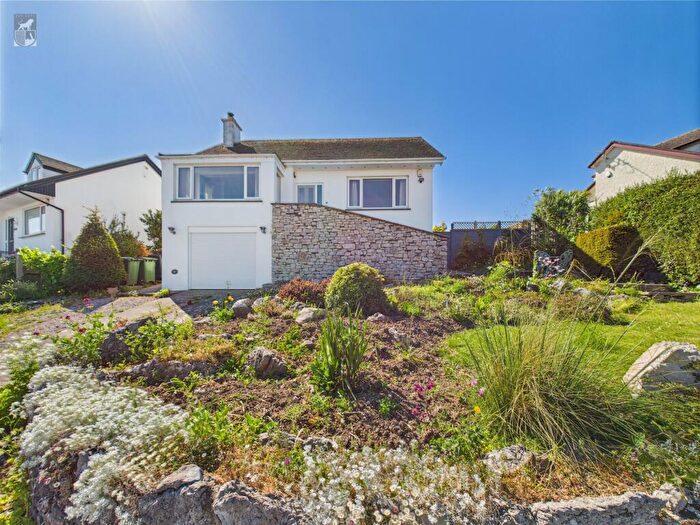
Properties in Cartmel And Grange West have an average house price of £339,714.00 and had 142 Property Transactions within the last 3 years¹.
Cartmel And Grange West is an area in Grange-over-sands, Cumbria with 834 households², where the most expensive property was sold for £940,000.00.
Properties for sale in Cartmel And Grange West
Roads and Postcodes in Cartmel And Grange West
Navigate through our locations to find the location of your next house in Cartmel And Grange West, Grange-over-sands for sale or to rent.
| Streets | Postcodes |
|---|---|
| Allithwaite Road | LA11 7SB |
| Aynsome Road | LA11 6PR LA11 6PS |
| Barn Garth | LA11 6PP |
| Blenket Close | LA11 7RP |
| Boarbank Lane | LA11 7QR |
| Cark Road | LA11 7SE LA11 7SF |
| Cartmel Road | LA11 7QZ |
| Cavendish Street | LA11 6QA |
| Church Road | LA11 7QH LA11 7QQ LA11 7RD LA11 7RE LA11 7RF |
| Devonshire Square | LA11 6QD |
| Fellside | LA11 7RN |
| Flookburgh Road | LA11 7RG LA11 7RJ LA11 7RQ |
| Friars Garth | LA11 6PJ |
| Green Lane | LA11 7QP |
| Greendales | LA11 7RU |
| Haggs Lane | LA11 6HD LA11 6PH |
| Hazelgarth | LA11 7RS |
| Headless Close | LA11 7SD |
| Highcroft Drive | LA11 7QL |
| Holme Lane | LA11 7QD |
| Jack Hill | LA11 7QB LA11 7RL |
| Kentsford Road | LA11 7BB |
| Kirkhead End | LA11 7BD |
| Kirkhead Road | LA11 7BG LA11 7DB LA11 7DD |
| Locker Lane | LA11 7QT |
| Maychells Orchard | LA11 7PY |
| Park View | LA11 6QF |
| Priest Lane | LA11 6PT LA11 6PU |
| Priory Close | LA11 6QQ |
| Quarry Lane | LA11 7QJ |
| Templand Garth | LA11 7QW |
| Templand Gate | LA11 7PW |
| Templand Park | LA11 7QS |
| Templands Lane | LA11 7QX LA11 7QY |
| The Causeway | LA11 6PW |
| The Square | LA11 6QB LA11 7QE LA11 7QF |
| Town End Meadow | LA11 6QG |
| Underfell | LA11 7RW |
| Uplin Crescent | LA11 7RR |
| Vicarage Lane | LA11 7QN |
| Wart Barrow Lane | LA11 7RA |
| West View | LA11 7RB |
| Woodlands Drive | LA11 7PZ |
| Yew Tree Cottages | LA11 7RH |
| LA11 6PL LA11 6PN LA11 6PY LA11 7NJ LA11 7NL LA11 7NP LA11 7QG LA11 7QU |
Transport near Cartmel And Grange West
- FAQ
- Price Paid By Year
- Property Type Price
Frequently asked questions about Cartmel And Grange West
What is the average price for a property for sale in Cartmel And Grange West?
The average price for a property for sale in Cartmel And Grange West is £339,714. This amount is 10% higher than the average price in Grange-over-sands. There are 145 property listings for sale in Cartmel And Grange West.
What streets have the most expensive properties for sale in Cartmel And Grange West?
The streets with the most expensive properties for sale in Cartmel And Grange West are Locker Lane at an average of £700,000, Vicarage Lane at an average of £653,000 and Priest Lane at an average of £581,666.
What streets have the most affordable properties for sale in Cartmel And Grange West?
The streets with the most affordable properties for sale in Cartmel And Grange West are Blenket Close at an average of £83,666, Templands Lane at an average of £186,875 and Hazelgarth at an average of £190,000.
Which train stations are available in or near Cartmel And Grange West?
Some of the train stations available in or near Cartmel And Grange West are Kents Bank, Cark and Cartmel and Grange-Over-Sands.
Property Price Paid in Cartmel And Grange West by Year
The average sold property price by year was:
| Year | Average Sold Price | Price Change |
Sold Properties
|
|---|---|---|---|
| 2025 | £368,328 | 13% |
19 Properties |
| 2024 | £321,166 | -6% |
29 Properties |
| 2023 | £339,107 | -0,4% |
52 Properties |
| 2022 | £340,327 | -7% |
42 Properties |
| 2021 | £363,667 | -1% |
42 Properties |
| 2020 | £368,359 | 24% |
36 Properties |
| 2019 | £278,789 | 3% |
43 Properties |
| 2018 | £270,544 | -2% |
51 Properties |
| 2017 | £275,670 | 8% |
43 Properties |
| 2016 | £252,715 | -7% |
53 Properties |
| 2015 | £271,521 | 5% |
50 Properties |
| 2014 | £258,160 | 22% |
37 Properties |
| 2013 | £202,381 | -22% |
26 Properties |
| 2012 | £246,625 | 25% |
36 Properties |
| 2011 | £184,250 | -37% |
24 Properties |
| 2010 | £252,357 | -7% |
32 Properties |
| 2009 | £270,796 | 6% |
27 Properties |
| 2008 | £255,833 | -10% |
36 Properties |
| 2007 | £282,202 | 21% |
49 Properties |
| 2006 | £222,257 | 7% |
47 Properties |
| 2005 | £205,988 | -2% |
43 Properties |
| 2004 | £210,424 | 25% |
57 Properties |
| 2003 | £157,020 | 21% |
47 Properties |
| 2002 | £123,463 | 12% |
64 Properties |
| 2001 | £108,341 | 3% |
53 Properties |
| 2000 | £105,347 | 4% |
58 Properties |
| 1999 | £101,409 | 19% |
57 Properties |
| 1998 | £82,286 | 5% |
74 Properties |
| 1997 | £77,931 | 8% |
56 Properties |
| 1996 | £71,402 | -15% |
36 Properties |
| 1995 | £81,763 | - |
29 Properties |
Property Price per Property Type in Cartmel And Grange West
Here you can find historic sold price data in order to help with your property search.
The average Property Paid Price for specific property types in the last three years are:
| Property Type | Average Sold Price | Sold Properties |
|---|---|---|
| Semi Detached House | £341,071.00 | 32 Semi Detached Houses |
| Detached House | £373,642.00 | 71 Detached Houses |
| Terraced House | £329,161.00 | 22 Terraced Houses |
| Flat | £209,114.00 | 17 Flats |

