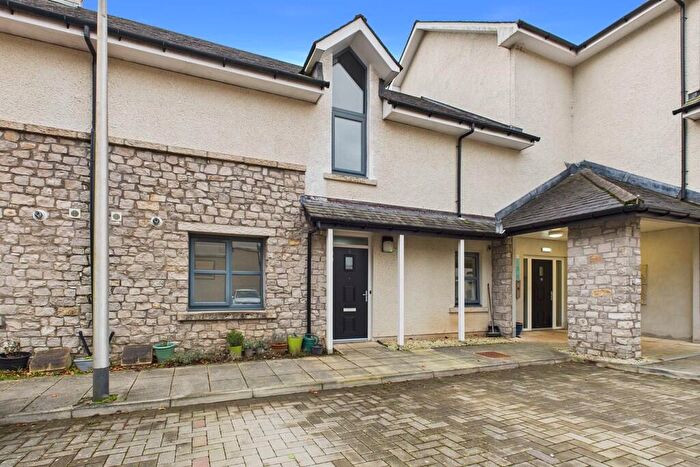
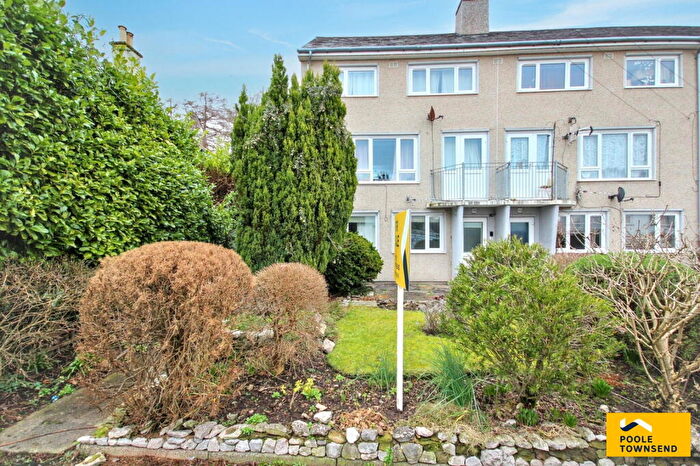
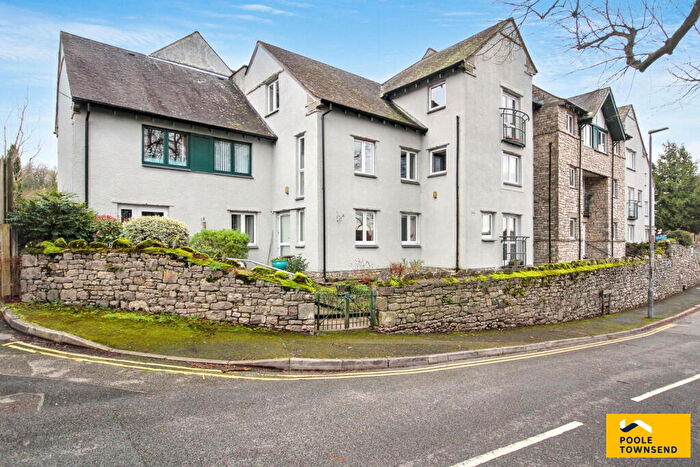
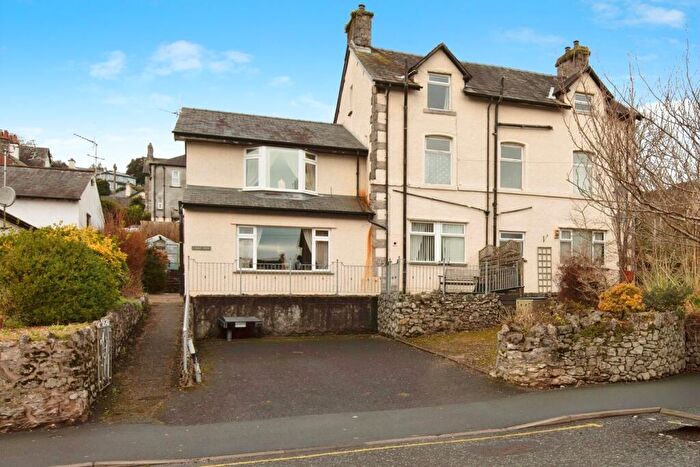
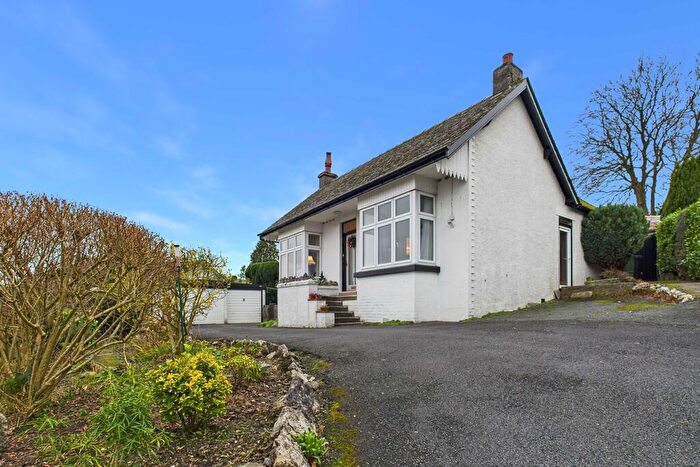
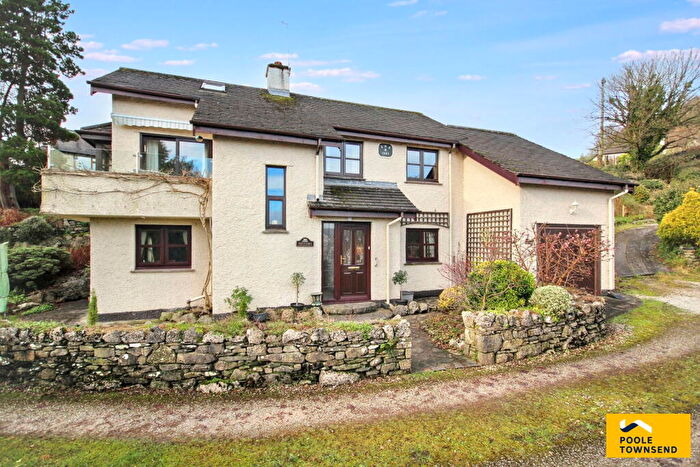
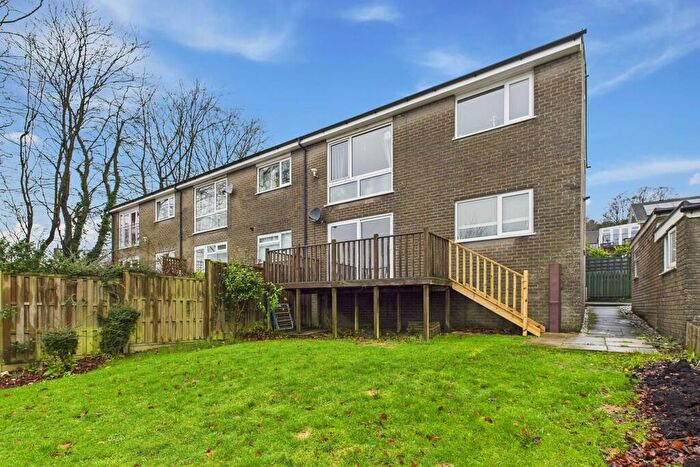
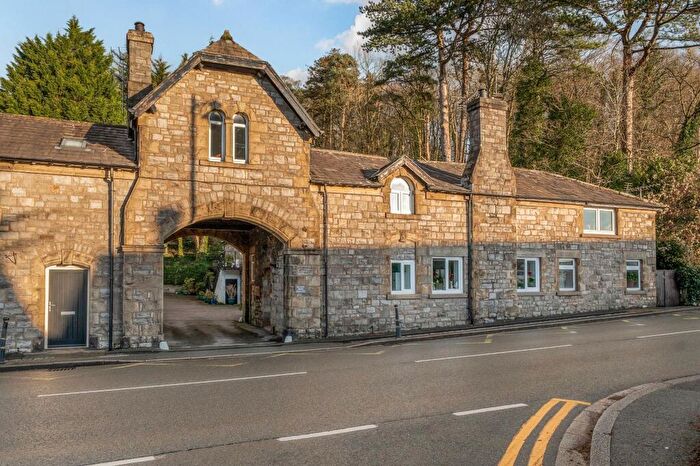
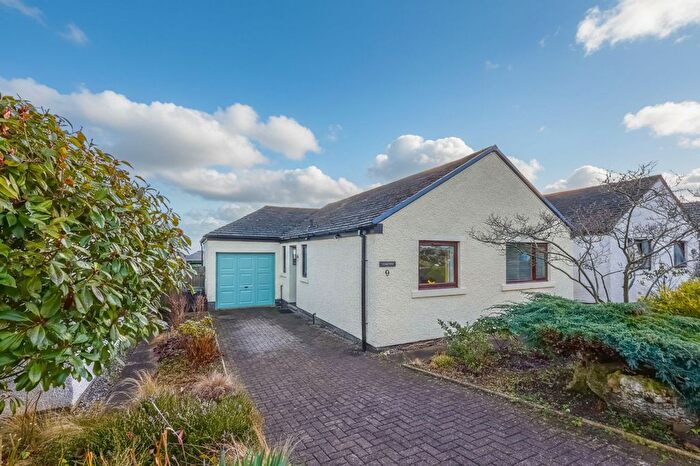
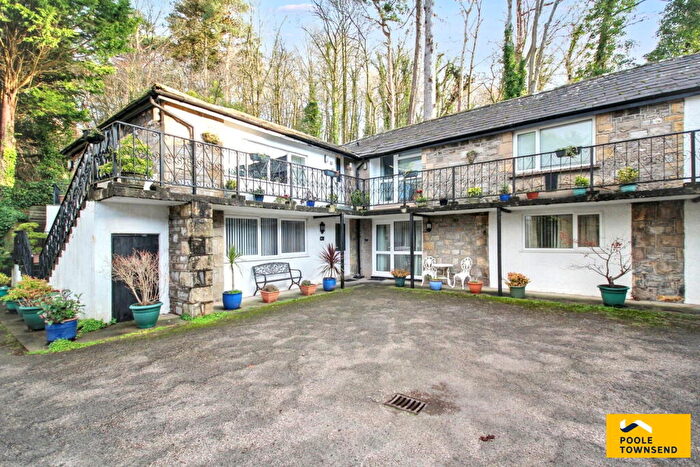
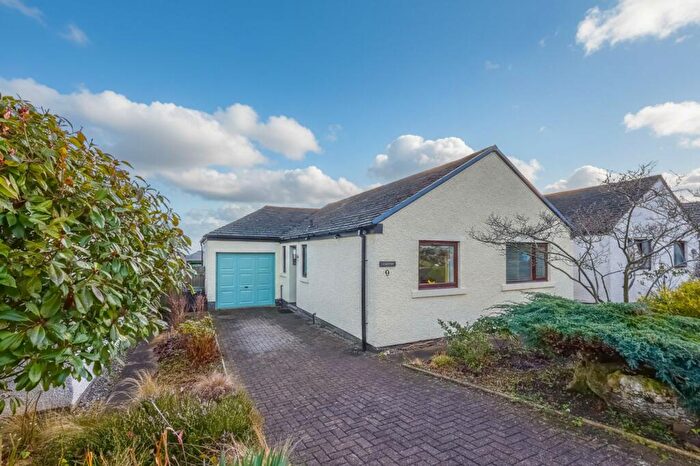
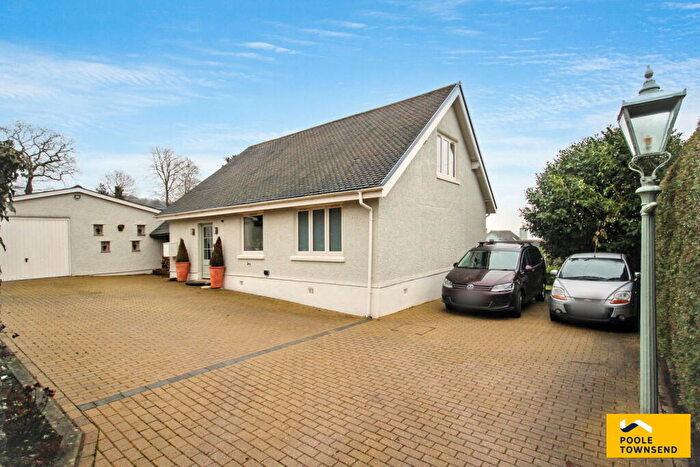
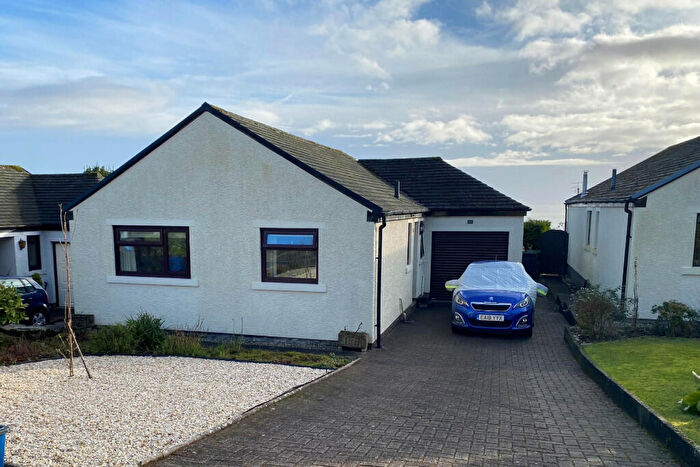
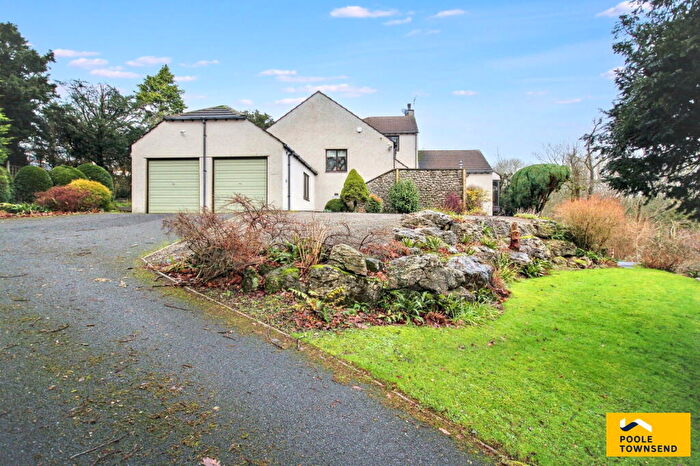
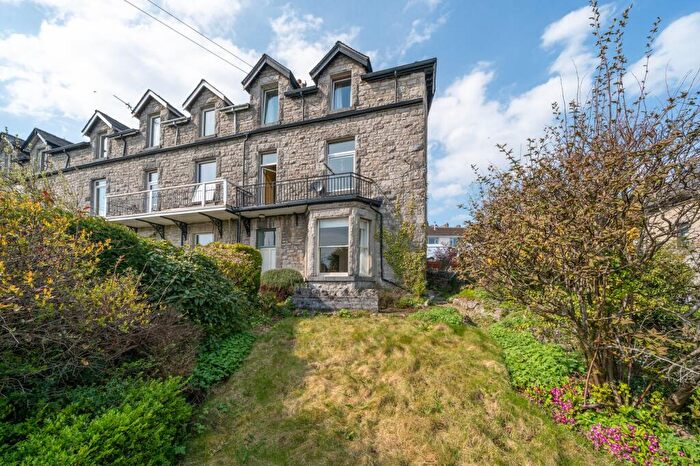
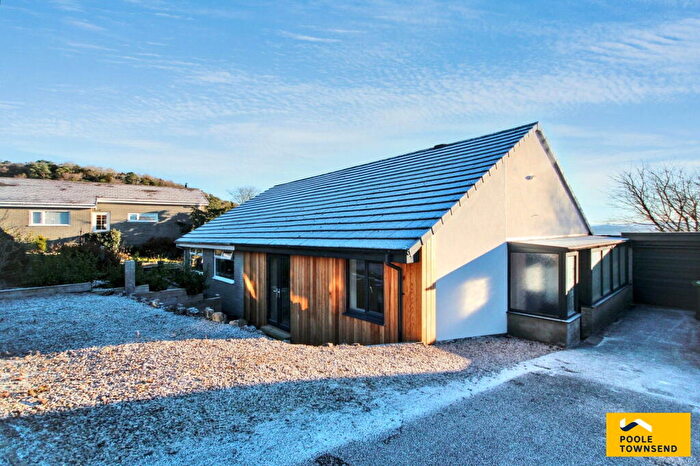
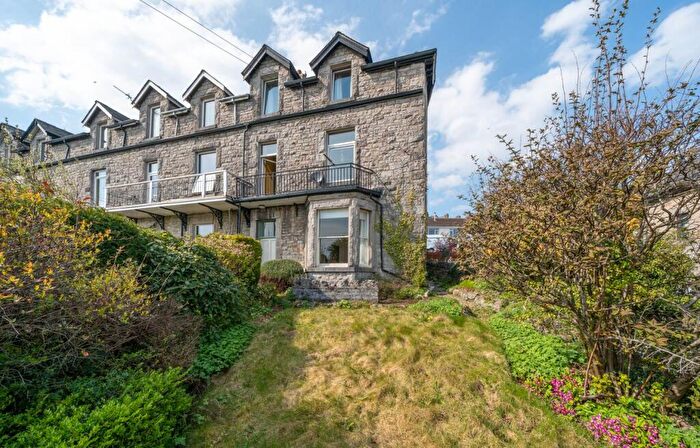
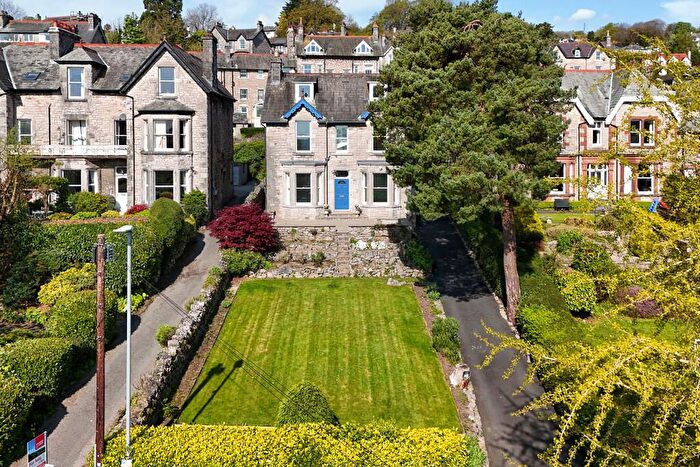
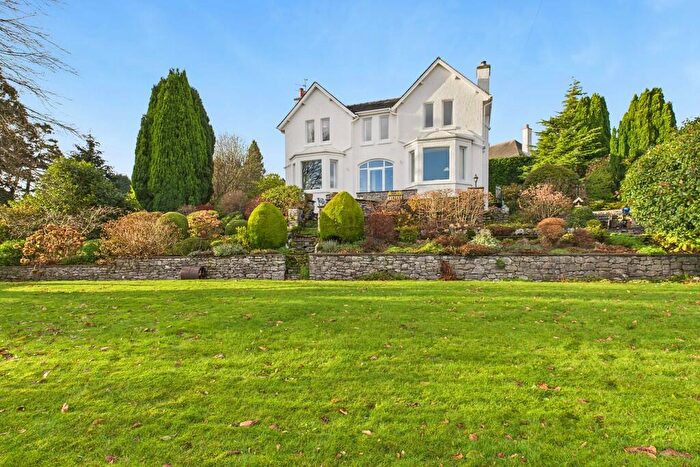
Houses for sale & to rent in Grange North, Grange-over-sands
House Prices in Grange North
Properties in Grange North have an average house price of £257,112.00 and had 169 Property Transactions within the last 3 years¹.
Grange North is an area in Grange-over-sands, Cumbria with 1,070 households², where the most expensive property was sold for £727,865.00.
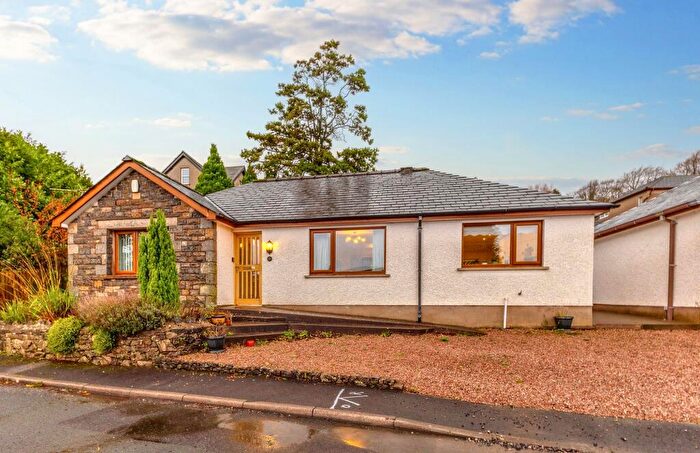
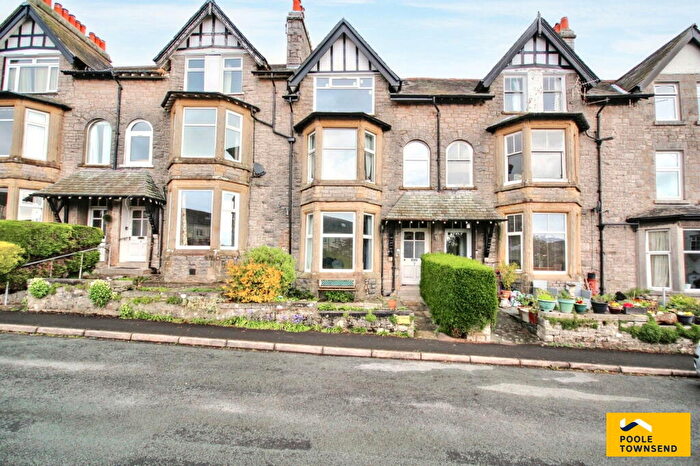
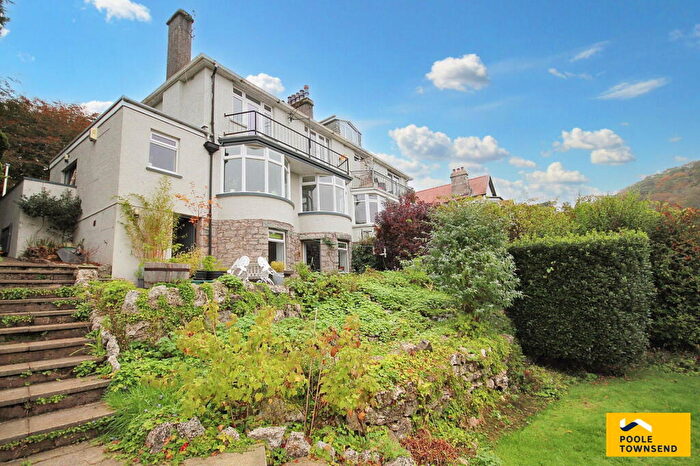
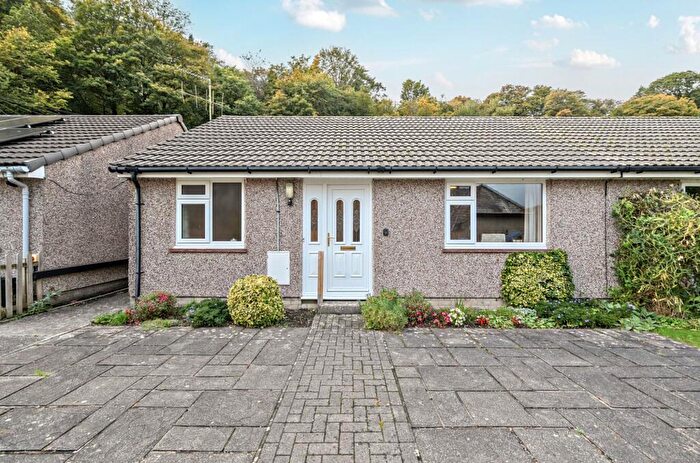
Properties for sale in Grange North
Roads and Postcodes in Grange North
Navigate through our locations to find the location of your next house in Grange North, Grange-over-sands for sale or to rent.
| Streets | Postcodes |
|---|---|
| Albert Road | LA11 7EZ |
| Ashmount Gardens | LA11 6DN |
| Ashmount Road | LA11 6BX |
| Back Main Street | LA11 6DE |
| Beech Road | LA11 6AL |
| Belle Isle Terrace | LA11 6EA |
| Berners Close | LA11 7DQ |
| Berriedale Terrace | LA11 6ER |
| Charney Court | LA11 6DL |
| Charney Road | LA11 6BP |
| Charney Well Lane | LA11 6DB |
| Church Hill | LA11 6BD |
| Cragg Drive | LA11 6BL |
| Eden Mount | LA11 6BZ |
| Eden Mount Close | LA11 6FL |
| Eden Mount Road | LA11 6BN |
| Eden Park Road | LA11 6BW |
| Eggerslack Terrace | LA11 6EQ |
| Fell Drive | LA11 7JF |
| Fellside Court | LA11 6BY |
| Fernleigh Avenue | LA11 7HW |
| Fernleigh Road | LA11 7HN LA11 7HP LA11 7HT |
| Glenedyth Flats | LA11 6EP |
| Grange Fell Road | LA11 6AD LA11 6AF LA11 6AH LA11 6AN LA11 6BJ LA11 6BU |
| Grange Mews | LA11 6EH |
| Hampsfell Road | LA11 6AZ LA11 6BE LA11 6BG |
| Hardcragg Way | LA11 6BH |
| Hawthorn Terrace | LA11 7HA |
| Hazelwood Terrace | LA11 6ES |
| Highfield Road | LA11 7JA LA11 7JB |
| Holme Island | LA11 6QY |
| Kent Gardens | LA11 7SY |
| Kents Bank Road | LA11 7DJ LA11 7EY LA11 7HD |
| Laundry Hill | LA11 7HB |
| Lindale Road | LA11 6EL LA11 6EU |
| Lowther Gardens | LA11 7EX |
| Lyndene Drive | LA11 6QP |
| Main Street | LA11 6AB LA11 6DP LA11 6DY LA11 6EB |
| Mayfield Terrace | LA11 7DW |
| Milton Terrace | LA11 6AG |
| Morecambe Bank | LA11 6DX |
| Netherleigh Drive | LA11 7JQ |
| Nutwood Crescent | LA11 6EZ |
| Park Road | LA11 7HQ |
| Pengarth | LA11 6BF |
| Riggs Close | LA11 6SX |
| Rockery Terrace | LA11 7HS |
| Rockland Road | LA11 7HR |
| Rockwell Gardens | LA11 6DJ |
| Rufford Drive | LA11 6DQ |
| Station Square | LA11 6EF |
| Stone Terrace | LA11 6AJ |
| The Esplanade | LA11 7HH |
| The Mews | LA11 7HU |
| Vicarage Close | LA11 6DG |
| Westcliffe Gardens | LA11 6BT |
| Westcliffe Gardens Flats | LA11 6BS |
| Windermere Road | LA11 6EG LA11 6EX LA11 6EY LA11 6JT |
| Woodhead Terrace | LA11 6AE |
| Yewbarrow Terrace | LA11 6ED |
Transport near Grange North
- FAQ
- Price Paid By Year
- Property Type Price
Frequently asked questions about Grange North
What is the average price for a property for sale in Grange North?
The average price for a property for sale in Grange North is £257,112. This amount is 18% lower than the average price in Grange-over-sands. There are 134 property listings for sale in Grange North.
What streets have the most expensive properties for sale in Grange North?
The streets with the most expensive properties for sale in Grange North are Rockland Road at an average of £725,000, Pengarth at an average of £723,932 and Eden Mount Close at an average of £570,000.
What streets have the most affordable properties for sale in Grange North?
The streets with the most affordable properties for sale in Grange North are Hampsfell Road at an average of £124,666, Yewbarrow Terrace at an average of £150,000 and The Esplanade at an average of £151,538.
Which train stations are available in or near Grange North?
Some of the train stations available in or near Grange North are Grange-Over-Sands, Kents Bank and Cark and Cartmel.
Property Price Paid in Grange North by Year
The average sold property price by year was:
| Year | Average Sold Price | Price Change |
Sold Properties
|
|---|---|---|---|
| 2025 | £272,927 | 6% |
55 Properties |
| 2024 | £256,336 | 6% |
60 Properties |
| 2023 | £241,867 | -6% |
54 Properties |
| 2022 | £257,116 | 7% |
57 Properties |
| 2021 | £239,837 | 8% |
65 Properties |
| 2020 | £221,166 | -4% |
51 Properties |
| 2019 | £230,066 | 14% |
60 Properties |
| 2018 | £198,283 | -4% |
71 Properties |
| 2017 | £206,488 | 4% |
64 Properties |
| 2016 | £197,671 | 6% |
78 Properties |
| 2015 | £185,767 | -13% |
51 Properties |
| 2014 | £210,128 | 0,3% |
67 Properties |
| 2013 | £209,504 | 4% |
55 Properties |
| 2012 | £201,792 | 16% |
62 Properties |
| 2011 | £169,257 | -20% |
33 Properties |
| 2010 | £203,681 | 1% |
44 Properties |
| 2009 | £201,771 | -15% |
53 Properties |
| 2008 | £232,580 | 8% |
47 Properties |
| 2007 | £214,033 | 8% |
81 Properties |
| 2006 | £197,785 | 3% |
68 Properties |
| 2005 | £192,160 | 11% |
70 Properties |
| 2004 | £171,669 | 8% |
67 Properties |
| 2003 | £158,500 | 25% |
90 Properties |
| 2002 | £118,250 | 29% |
101 Properties |
| 2001 | £84,152 | 4% |
107 Properties |
| 2000 | £80,747 | -3% |
98 Properties |
| 1999 | £82,896 | 1% |
87 Properties |
| 1998 | £82,403 | 13% |
85 Properties |
| 1997 | £71,997 | 12% |
77 Properties |
| 1996 | £63,058 | -16% |
44 Properties |
| 1995 | £73,325 | - |
56 Properties |
Property Price per Property Type in Grange North
Here you can find historic sold price data in order to help with your property search.
The average Property Paid Price for specific property types in the last three years are:
| Property Type | Average Sold Price | Sold Properties |
|---|---|---|
| Semi Detached House | £311,128.00 | 27 Semi Detached Houses |
| Detached House | £419,113.00 | 41 Detached Houses |
| Terraced House | £245,375.00 | 24 Terraced Houses |
| Flat | £155,570.00 | 77 Flats |

