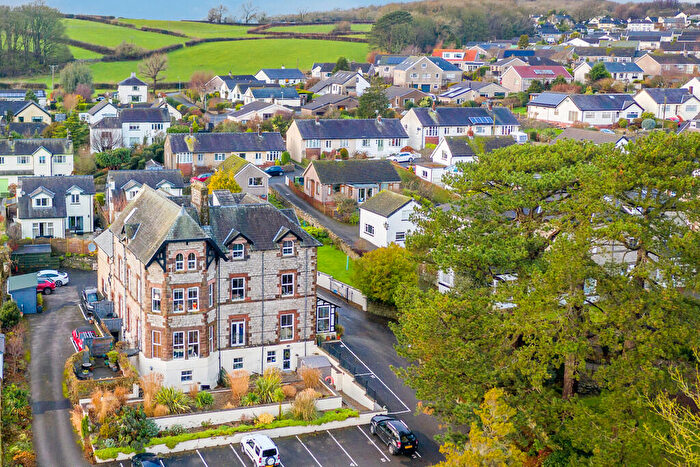
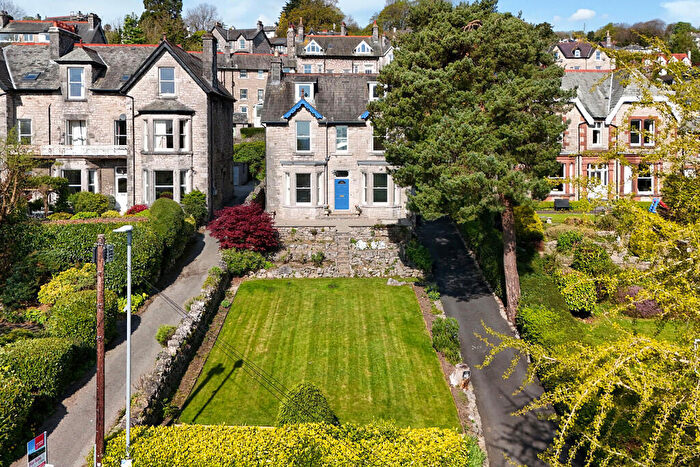
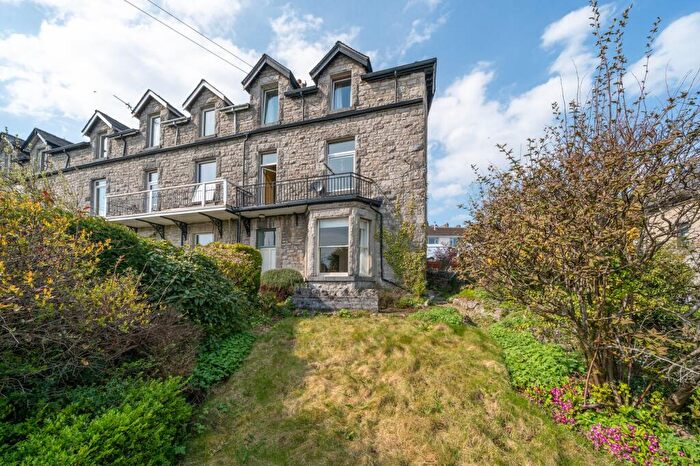
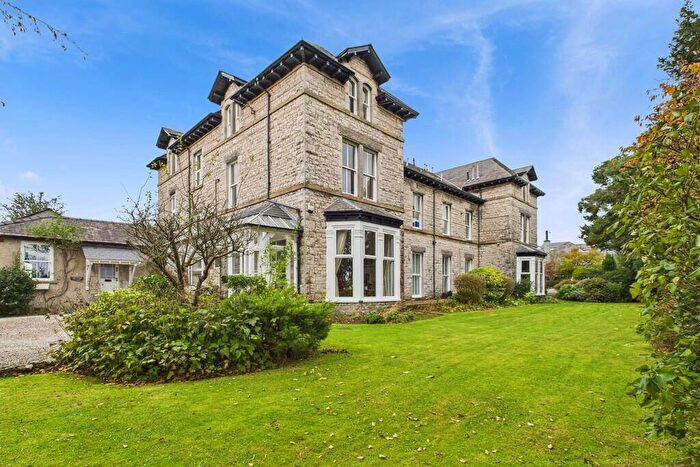
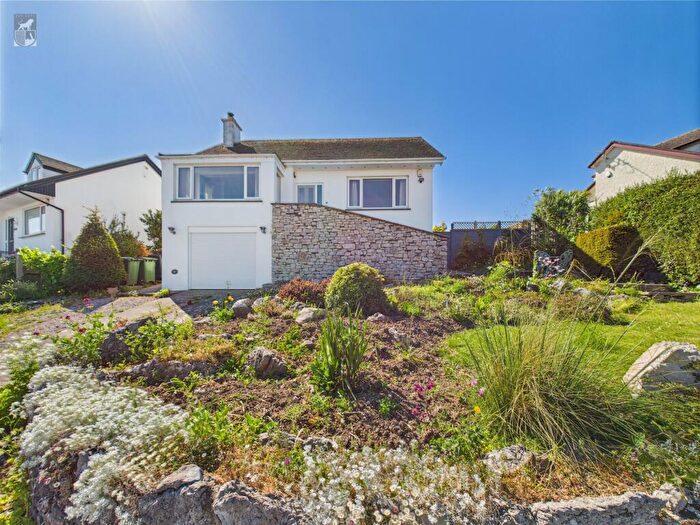
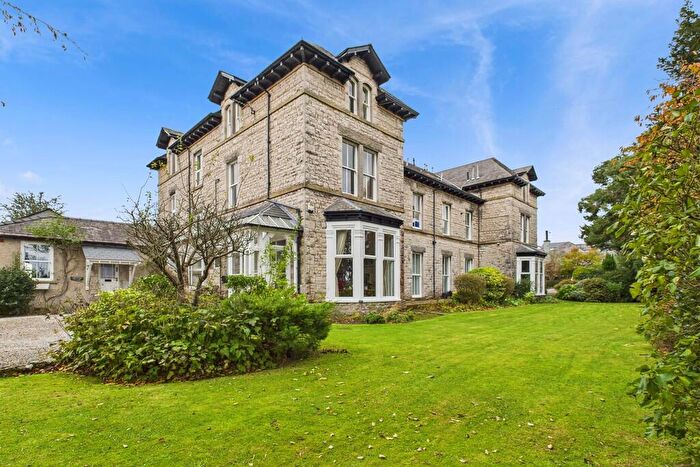
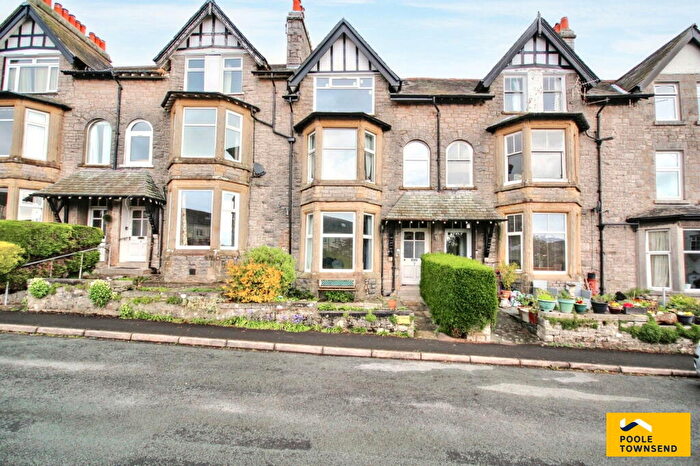
Houses for sale & to rent in Grange South, Grange-over-sands
House Prices in Grange South
Properties in Grange South have an average house price of £363,457.00 and had 100 Property Transactions within the last 3 years¹.
Grange South is an area in Grange-over-sands, Cumbria with 828 households², where the most expensive property was sold for £780,000.00.
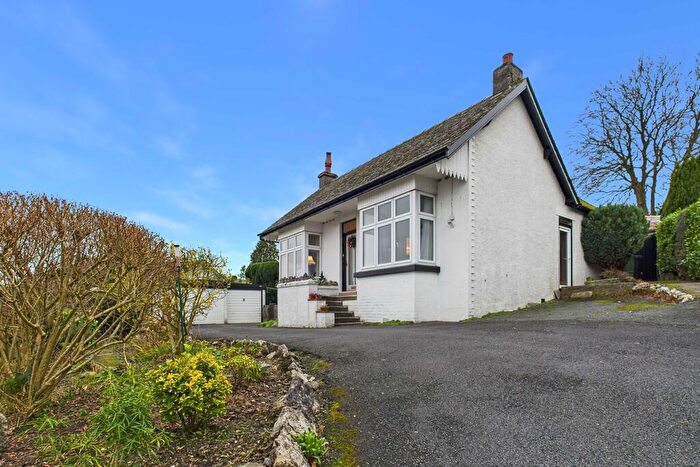
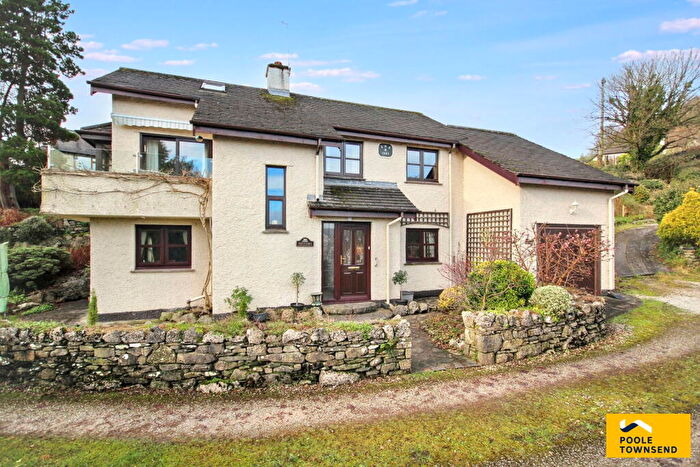
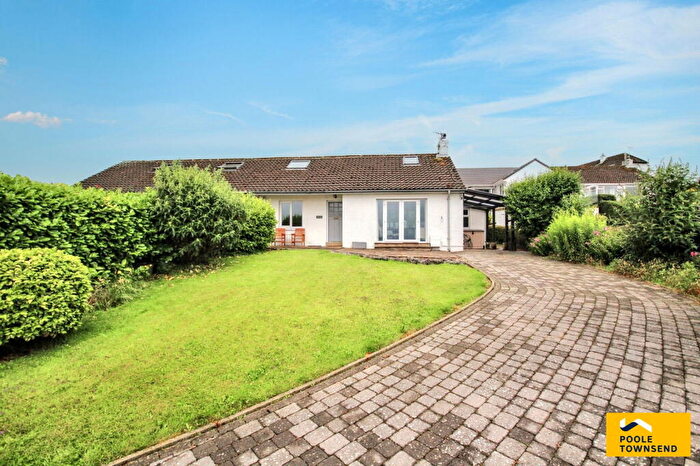
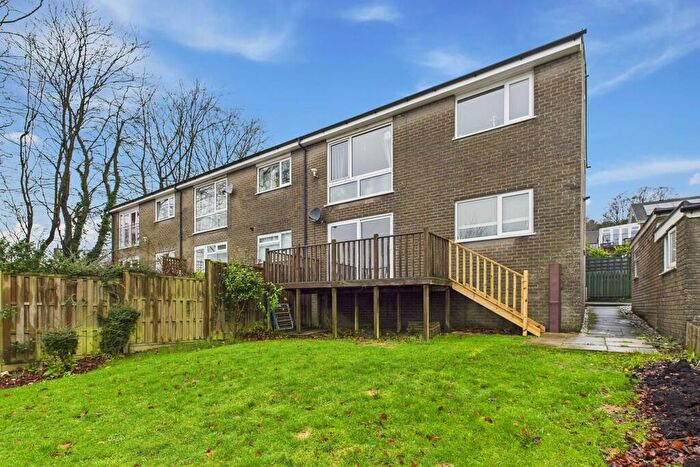
Properties for sale in Grange South
Roads and Postcodes in Grange South
Navigate through our locations to find the location of your next house in Grange South, Grange-over-sands for sale or to rent.
| Streets | Postcodes |
|---|---|
| Abbots Close | LA11 7BZ |
| Abbots Way | LA11 7BP |
| Allithwaite Road | LA11 7EH LA11 7EN LA11 7EP |
| Back Yewbarrow Terrace | LA11 6AX |
| Berry Bank Road | LA11 7EJ |
| Cardrona Court | LA11 7AW |
| Cardrona Road | LA11 7EW |
| Cart Lane | LA11 7AB LA11 7AF |
| Carter Road | LA11 7AG LA11 7AN LA11 7AS |
| Cartmel Road | LA11 7EG LA11 7QA |
| Cat Tree Road | LA11 7EB LA11 7ED |
| Fell Close | LA11 7JG |
| Fell Drive | LA11 7JH |
| Fernhill Road | LA11 7JD |
| Granby Road | LA11 7AU |
| Grange Fell Road | LA11 6AQ LA11 6AR |
| Graythwaite Court | LA11 7BN |
| Graythwaite Gardens | LA11 7BF |
| Great Heads Road | LA11 7EA |
| Greaves Wood Road | LA11 7ES |
| Greenacres | LA11 7ER |
| Heads Drive | LA11 7DY |
| Kents Bank Road | LA11 7DT LA11 7EF |
| Kentsford Road | LA11 7AP |
| Kilmidyke Drive | LA11 7AH LA11 7AJ LA11 7AL |
| Kilmidyke Road | LA11 7AQ |
| Laneside Road | LA11 7BS LA11 7BT LA11 7BU LA11 7BX LA11 7BY |
| Linden Fold | LA11 7AY |
| Little Heads | LA11 7DZ |
| Meadow Grove | LA11 7AT |
| Meadowbank Fold | LA11 6AU |
| Meadowbank Lane | LA11 6AT |
| Methven Close | LA11 7DX |
| Methven Road | LA11 7DU |
| Methven Terrace | LA11 7DP |
| Pine Close | LA11 7JJ |
| Priory Crescent | LA11 7BL |
| Priory Lane | LA11 7BH LA11 7BJ |
| Risedale Fold | LA11 7ET |
| Rowanside | LA11 7EQ |
| Seawood Place | LA11 7AR |
| The Avenue | LA11 6AP |
| The Crescent | LA11 6AW |
| The Heads | LA11 7EE |
| The Old Nurseries | LA11 7AD |
| The Orchard | LA11 7AE |
| Thornfield Road | LA11 7DR |
| Yew Tree Road | LA11 7AA |
Transport near Grange South
- FAQ
- Price Paid By Year
- Property Type Price
Frequently asked questions about Grange South
What is the average price for a property for sale in Grange South?
The average price for a property for sale in Grange South is £363,457. This amount is 17% higher than the average price in Grange-over-sands. There are 128 property listings for sale in Grange South.
What streets have the most expensive properties for sale in Grange South?
The streets with the most expensive properties for sale in Grange South are The Heads at an average of £775,000, Greenacres at an average of £661,666 and Methven Road at an average of £517,250.
What streets have the most affordable properties for sale in Grange South?
The streets with the most affordable properties for sale in Grange South are Thornfield Road at an average of £150,400, Fell Close at an average of £204,333 and Fell Drive at an average of £205,000.
Which train stations are available in or near Grange South?
Some of the train stations available in or near Grange South are Kents Bank, Grange-Over-Sands and Cark and Cartmel.
Property Price Paid in Grange South by Year
The average sold property price by year was:
| Year | Average Sold Price | Price Change |
Sold Properties
|
|---|---|---|---|
| 2025 | £380,961 | 7% |
26 Properties |
| 2024 | £355,772 | -1% |
34 Properties |
| 2023 | £358,612 | 12% |
40 Properties |
| 2022 | £316,581 | -5% |
33 Properties |
| 2021 | £333,949 | 10% |
51 Properties |
| 2020 | £300,534 | - |
44 Properties |
| 2019 | £300,621 | -2% |
44 Properties |
| 2018 | £306,175 | 9% |
38 Properties |
| 2017 | £278,917 | 9% |
53 Properties |
| 2016 | £254,931 | 2% |
51 Properties |
| 2015 | £249,232 | -4% |
57 Properties |
| 2014 | £258,720 | 6% |
51 Properties |
| 2013 | £243,185 | 9% |
36 Properties |
| 2012 | £221,689 | -20% |
41 Properties |
| 2011 | £265,242 | 14% |
38 Properties |
| 2010 | £228,856 | -7% |
39 Properties |
| 2009 | £245,091 | -13% |
48 Properties |
| 2008 | £275,810 | -5% |
24 Properties |
| 2007 | £290,468 | 5% |
62 Properties |
| 2006 | £276,874 | 25% |
53 Properties |
| 2005 | £208,239 | -10% |
48 Properties |
| 2004 | £229,990 | 15% |
52 Properties |
| 2003 | £195,041 | 17% |
56 Properties |
| 2002 | £161,285 | 17% |
49 Properties |
| 2001 | £133,905 | 5% |
46 Properties |
| 2000 | £127,491 | 27% |
53 Properties |
| 1999 | £92,787 | -12% |
56 Properties |
| 1998 | £104,056 | -1% |
49 Properties |
| 1997 | £105,598 | 19% |
58 Properties |
| 1996 | £85,126 | 5% |
42 Properties |
| 1995 | £80,842 | - |
31 Properties |
Property Price per Property Type in Grange South
Here you can find historic sold price data in order to help with your property search.
The average Property Paid Price for specific property types in the last three years are:
| Property Type | Average Sold Price | Sold Properties |
|---|---|---|
| Semi Detached House | £290,444.00 | 18 Semi Detached Houses |
| Detached House | £434,345.00 | 60 Detached Houses |
| Terraced House | £238,250.00 | 4 Terraced Houses |
| Flat | £228,000.00 | 18 Flats |

