
Houses for sale & to rent in Flimby, Maryport
House Prices in Flimby
Properties in Flimby have an average house price of £97k and had 59 Property Transactions within the last 3 years¹.
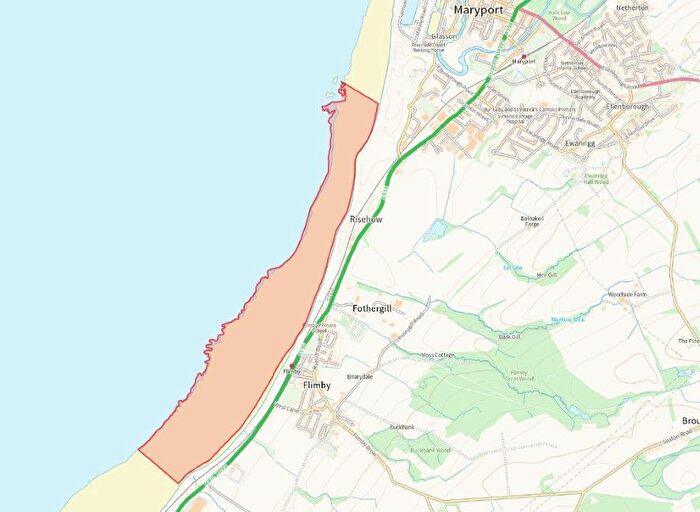
Flimby is an area in Maryport, Cumbria with 748 households², where the most expensive property was sold for £305k.
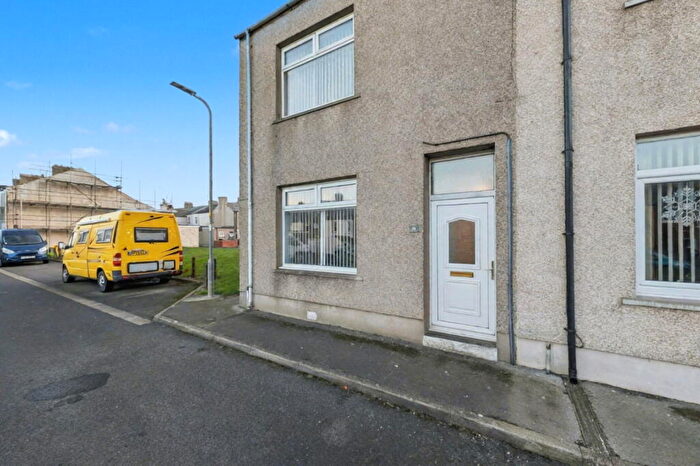
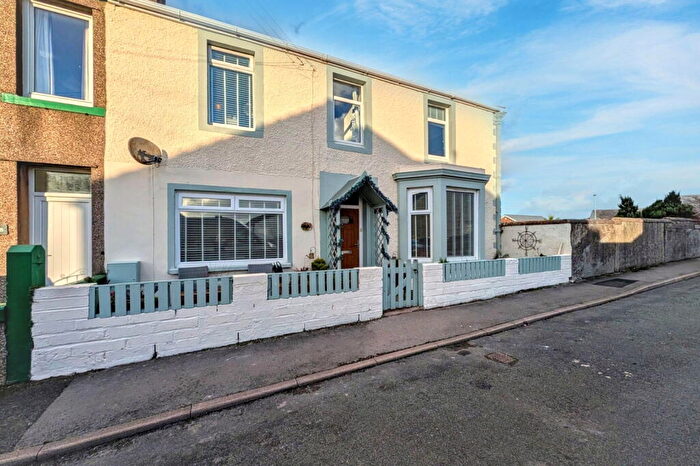
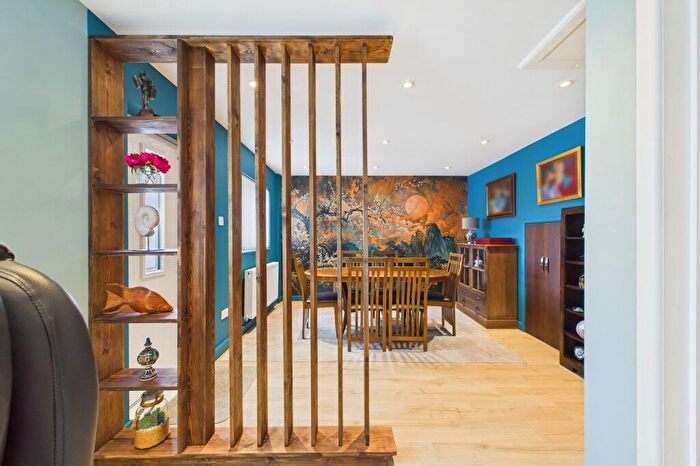
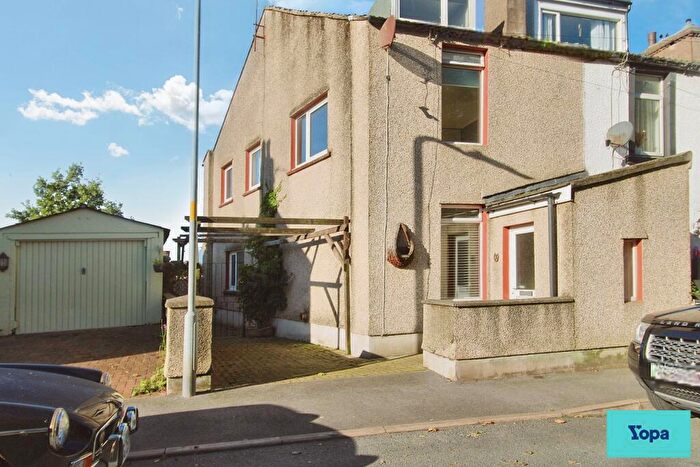
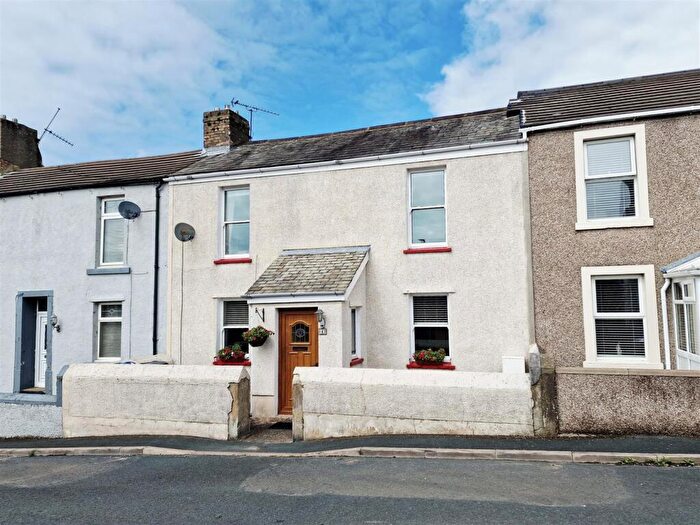
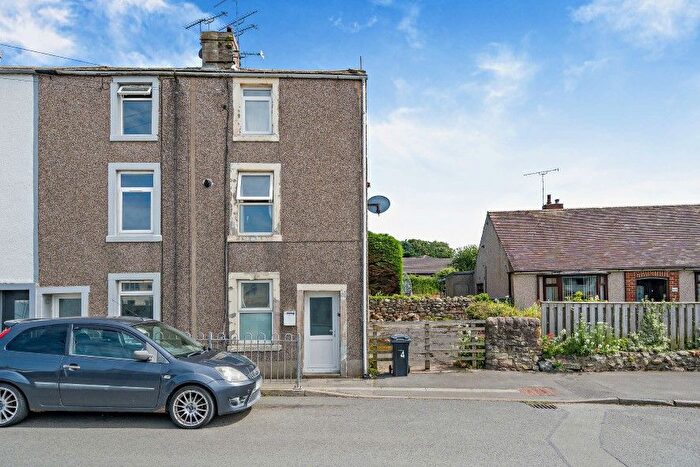
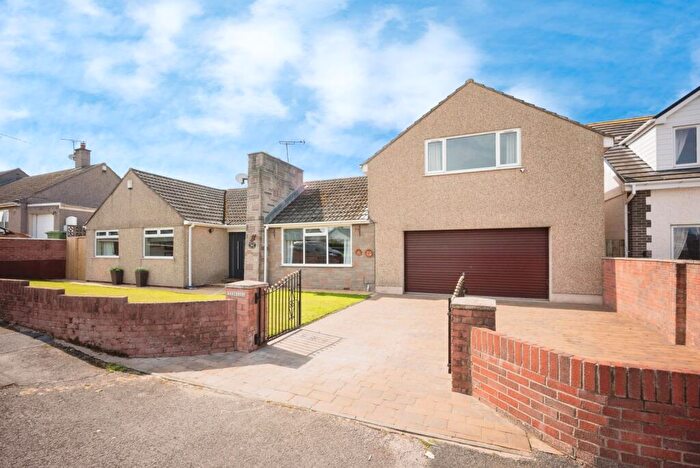
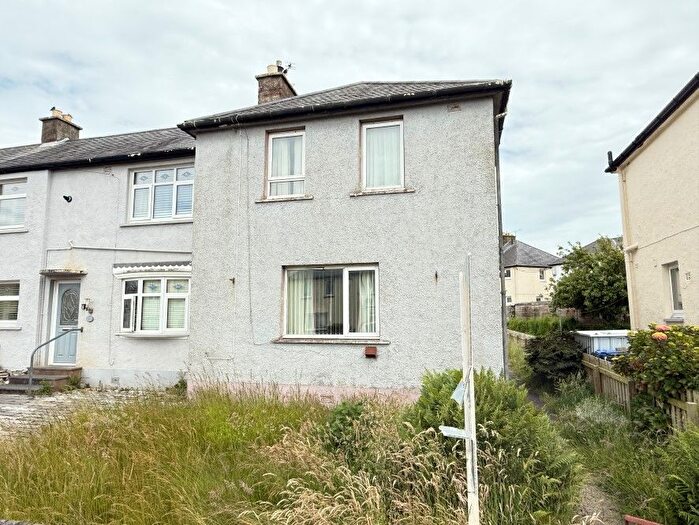
Properties for sale in Flimby
Previously listed properties in Flimby
![]()
If you are looking to sell your house, let it out, or receive a property valuation, an expert can help you.
Click the button below to get started.


Roads and Postcodes in Flimby
Navigate through our locations to find the location of your next house in Flimby, Maryport for sale or to rent.
| Streets | Postcodes |
|---|---|
| Allan Hill | CA15 8SZ |
| Allanby Close | CA15 8QP |
| Allanby Street | CA15 8QF |
| Andersons Court | CA15 8PT |
| Beckside | CA15 8TQ |
| Brook Street | CA15 8QD CA15 8QE |
| Cabin Villas | CA15 8TH |
| Chapel Street | CA15 8QG |
| Church Road | CA15 8TJ |
| Co Operative Terrace | CA15 8PR |
| Coniston Avenue | CA15 8RG |
| Criffel View | CA15 8QL |
| Dovers Yard | CA15 8SX |
| Eaigle Terrace | CA15 8RT |
| Elm Avenue | CA15 8RF CA15 8RQ |
| Farmers Way | CA15 8PQ |
| Field View | CA15 8QB |
| Flimby Brow | CA15 8TB CA15 8TD CA15 8TL |
| Grange Avenue | CA15 8RE |
| Kiln Hill | CA15 8QQ |
| Leeches Terrace | CA15 8RS |
| Lonsdale Place | CA15 8TP |
| Low Lane | CA15 8TN |
| Lowther Street | CA15 8QJ |
| Main Road | CA15 8PB CA15 8RP CA15 8RN CA15 8RR |
| Margaret Street | CA15 8PP |
| Mason Terrace | CA15 8QT |
| Miller Place | CA15 8PF |
| Nairn Street | CA15 8QH |
| Pennygill | CA15 8TS |
| Risehow Industrial Estate | CA15 8PD |
| Ruby Hill | CA15 8TA |
| Rye Hill Crescent | CA15 8PN |
| Rye Hill Road | CA15 8PJ CA15 8PS CA15 8PW |
| Sand Lane | CA15 8QS |
| School Drive | CA15 8PL |
| Solway Avenue | CA15 8RH |
| St Helens Avenue | CA15 8RA CA15 8RB |
| St Nicholas Avenue | CA15 8QZ |
| Station Road | CA15 8QN CA15 8PE |
| The Fothergills | CA15 8PG |
| Thompsons Terrace | CA15 8QA |
| Wedgwood Road | CA15 8QU CA15 8QX |
| Wesley Court | CA15 8PH |
| West End Close | CA15 8TF |
| West End Court | CA15 8TG |
| West End Villas | CA15 8RW |
| West Lane | CA15 8QY CA15 8RL CA15 8RD |
| Westfield Terrace | CA15 8QW |
| Westfield View | CA15 8RJ |
| Whites Yard | CA15 8SY |
| CA15 8PA CA15 8SU CA15 8RU CA15 8TW |
Transport near Flimby

- FAQ
- Price Paid By Year
- Property Type Price
Frequently asked questions about Flimby
What is the average price for a property for sale in Flimby?
The average price for a property for sale in Flimby is £97,179. This amount is 38% lower than the average price in Maryport. There are 106 property listings for sale in Flimby.
What streets have the most expensive properties for sale in Flimby?
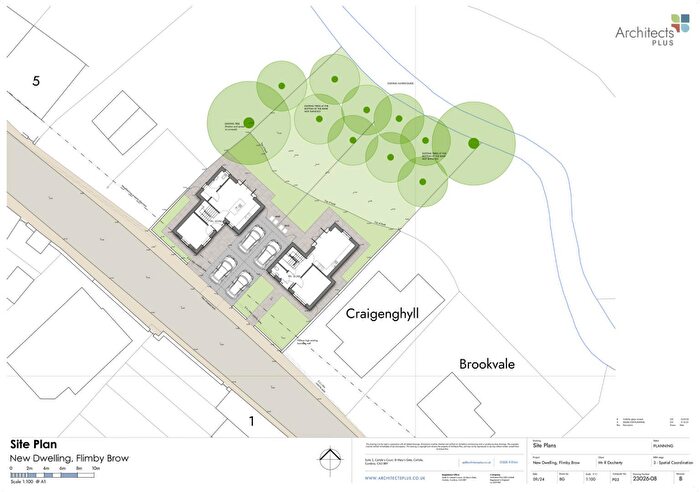
The streets with the most expensive properties for sale in Flimby are Flimby Brow at an average of £152,500, Allanby Street at an average of £150,000 and Leeches Terrace at an average of £150,000.
What streets have the most affordable properties for sale in Flimby?
The streets with the most affordable properties for sale in Flimby are Criffel View at an average of £49,000, Thompsons Terrace at an average of £54,500 and St. Helens Avenue at an average of £60,000.
Which train stations are available in or near Flimby?
Some of the train stations available in or near Flimby are Flimby, Maryport and Workington.
Property Price Paid in Flimby by Year
The average sold property price by year was:
| Year | Average Sold Price | Price Change |
Sold Properties
|
|---|---|---|---|
| 2026 | £160,666 | 36% |
3 Properties |
| 2025 | £102,164 | 15% |
25 Properties |
| 2024 | £86,473 | -2% |
19 Properties |
| 2023 | £87,875 | -17% |
12 Properties |
| 2022 | £102,525 | -5% |
26 Properties |
| 2021 | £107,592 | 6% |
42 Properties |
| 2020 | £101,204 | -2% |
23 Properties |
| 2019 | £103,156 | 1% |
22 Properties |
| 2018 | £101,887 | 20% |
28 Properties |
| 2017 | £81,281 | -12% |
16 Properties |
| 2016 | £91,426 | -9% |
19 Properties |
| 2015 | £99,739 | -6% |
25 Properties |
| 2014 | £105,321 | 7% |
24 Properties |
| 2013 | £98,051 | -5% |
38 Properties |
| 2012 | £103,196 | 3% |
15 Properties |
| 2011 | £100,414 | -1% |
31 Properties |
| 2010 | £101,238 | 29% |
21 Properties |
| 2009 | £71,636 | 2% |
11 Properties |
| 2008 | £70,058 | -61% |
12 Properties |
| 2007 | £112,608 | 30% |
36 Properties |
| 2006 | £79,059 | 2% |
44 Properties |
| 2005 | £77,704 | 22% |
34 Properties |
| 2004 | £60,399 | 29% |
48 Properties |
| 2003 | £43,095 | 4% |
41 Properties |
| 2002 | £41,422 | 20% |
46 Properties |
| 2001 | £33,002 | 17% |
25 Properties |
| 2000 | £27,530 | -15% |
23 Properties |
| 1999 | £31,752 | -41% |
23 Properties |
| 1998 | £44,737 | 43% |
24 Properties |
| 1997 | £25,641 | -36% |
17 Properties |
| 1996 | £34,877 | 4% |
31 Properties |
| 1995 | £33,645 | - |
12 Properties |
Property Price per Property Type in Flimby
Here you can find historic sold price data in order to help with your property search.
The average Property Paid Price for specific property types in the last three years are:
| Property Type | Average Sold Price | Sold Properties |
|---|---|---|
| Detached House | £216,000.00 | 4 Detached Houses |
| Terraced House | £82,012.00 | 49 Terraced Houses |
| Semi Detached House | £141,833.00 | 6 Semi Detached Houses |