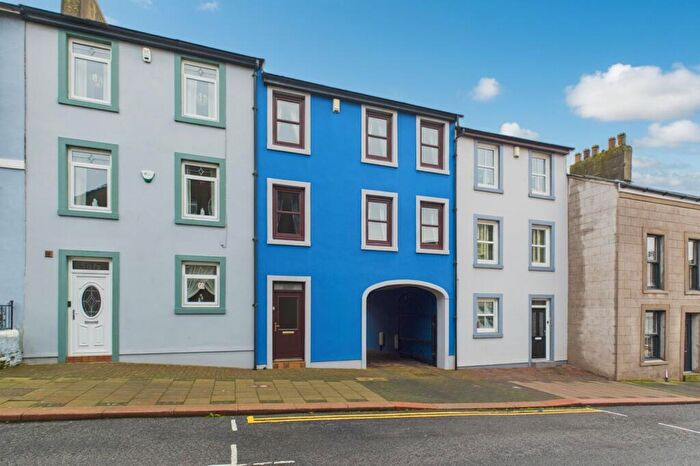
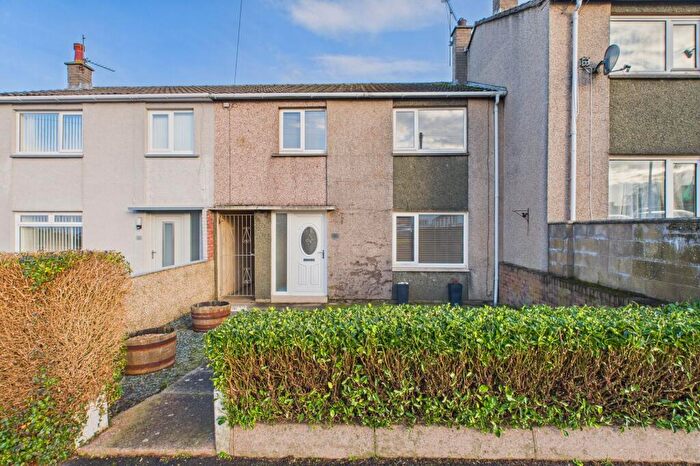
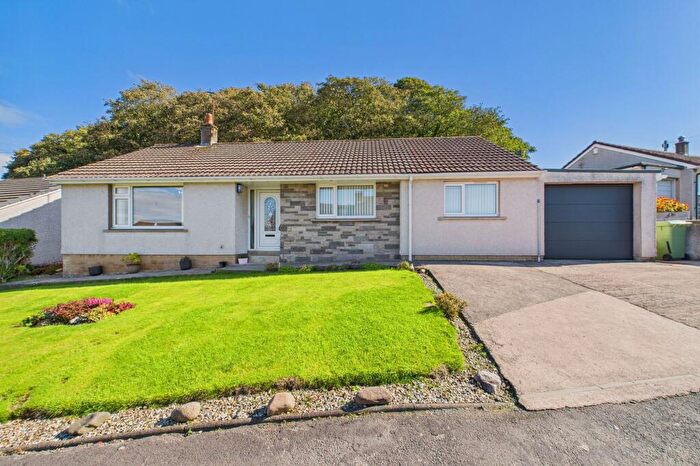
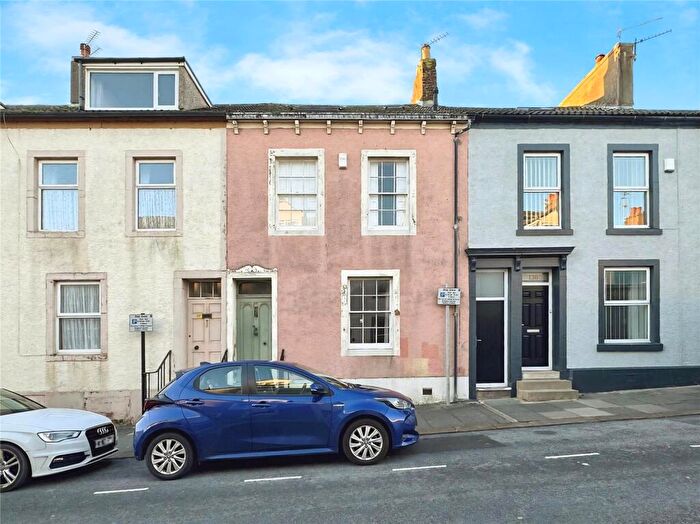
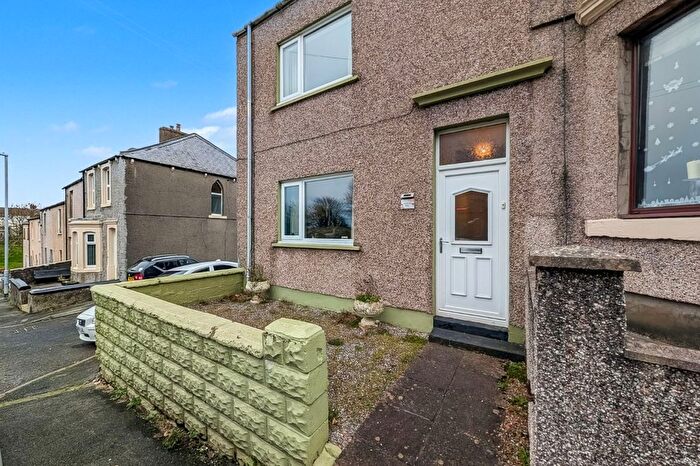
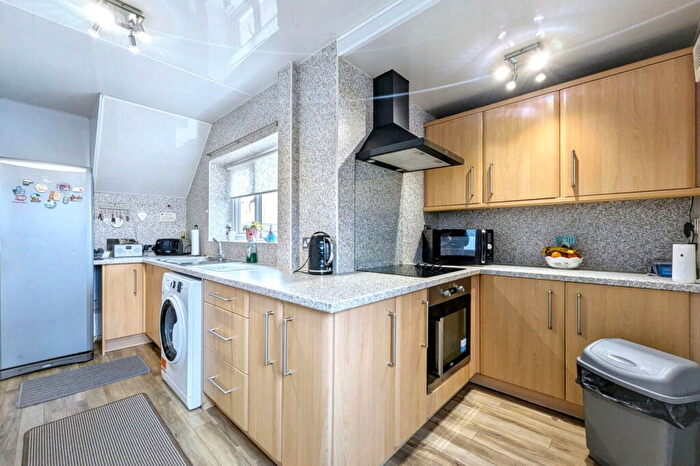
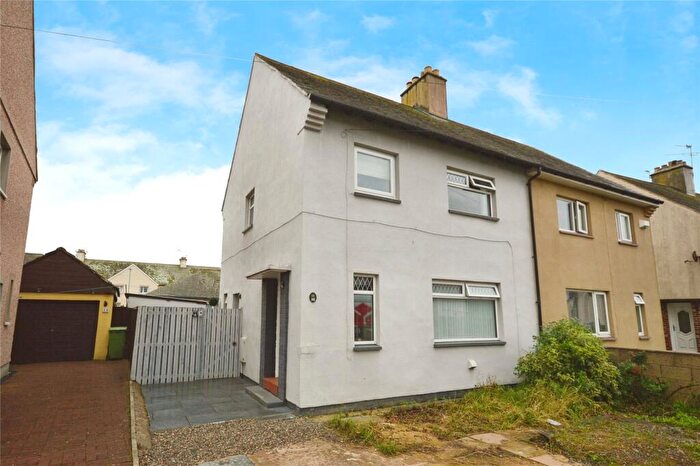
Houses for sale & to rent in Maryport North, Maryport
House Prices in Maryport North
Properties in Maryport North have an average house price of £147,656.00 and had 8 Property Transactions within the last 3 years¹.
Maryport North is an area in Maryport, Cumbria with 290 households², where the most expensive property was sold for £285,000.00.
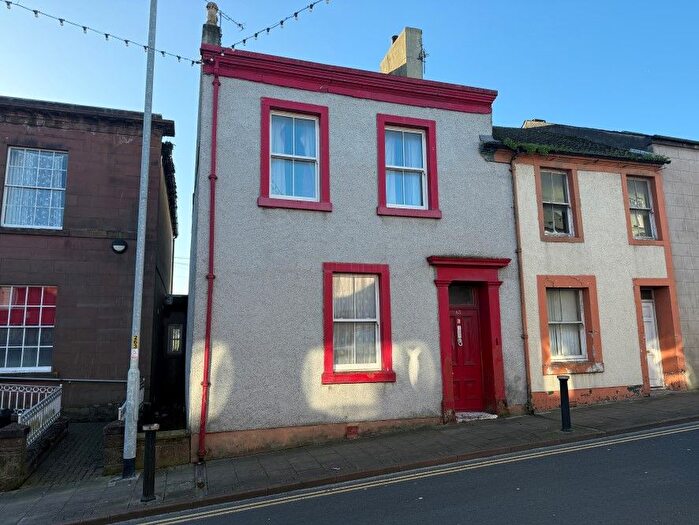
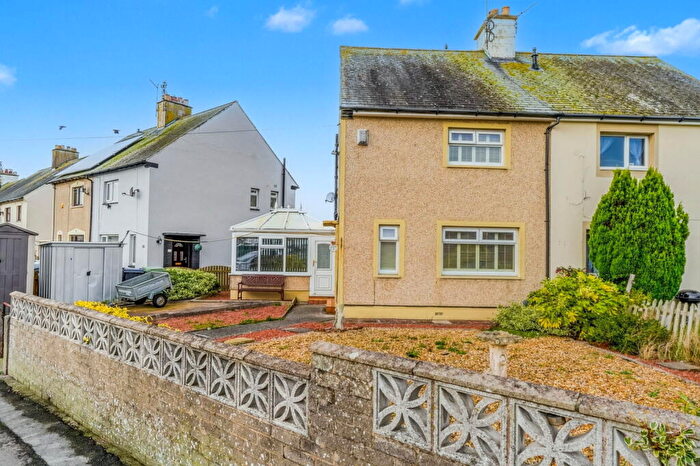
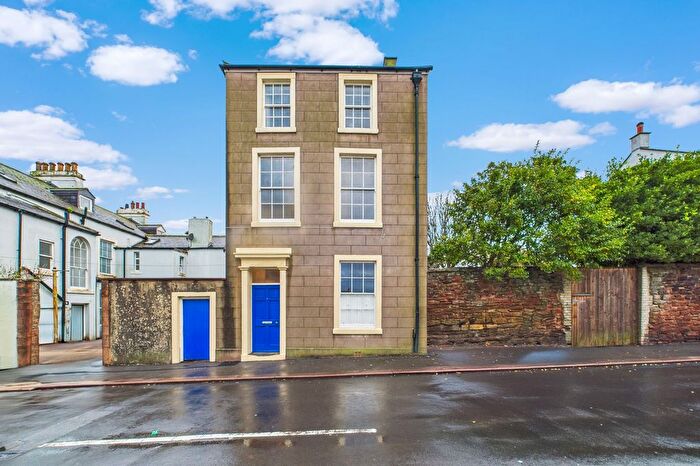
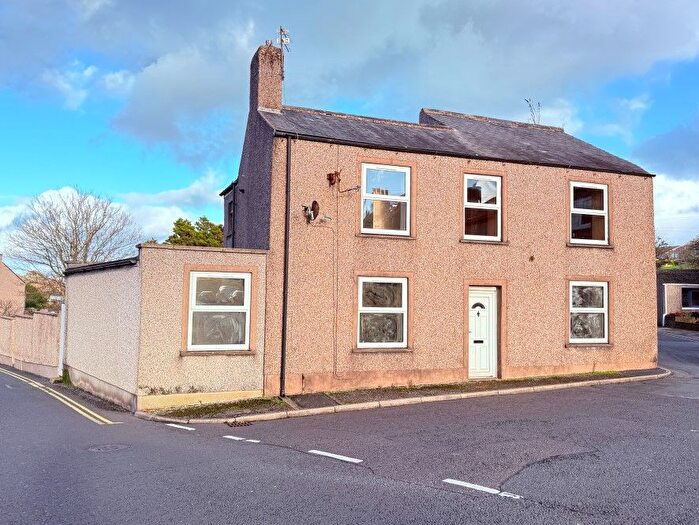
Properties for sale in Maryport North
Previously listed properties in Maryport North
Roads and Postcodes in Maryport North
Navigate through our locations to find the location of your next house in Maryport North, Maryport for sale or to rent.
| Streets | Postcodes |
|---|---|
| Argyle Terrace | CA15 7PB |
| Ashby Street | CA15 7NJ |
| Bridge Street | CA15 8AE |
| Church Street | CA15 6HN |
| Church Terrace | CA15 7PT |
| Collingwood Close | CA15 6NS |
| Curzon Street | CA15 6BY CA15 6LP |
| Dan Wilson Avenue | CA15 7DY |
| Ellen Court | CA15 7PR |
| Ellenfoot Drive | CA15 7DB |
| Fleming Square | CA15 6HW |
| Furnace Road | CA15 6DG |
| Galloway Close | CA15 7QR |
| Galloway Cross | CA15 6AL |
| Harbour Business Park | CA15 8BF |
| High Street | CA15 6AA |
| Inglis Court | CA15 7AU |
| Irish Street | CA15 8AD |
| Ismay Close | CA15 7QS |
| Mealpot Road | CA15 6NE CA15 6NQ |
| Netherhall Road | CA15 6NT |
| Netherholme Drive | CA15 6NJ |
| Pecklewell Lane | CA15 7PJ CA15 7PU |
| Queen Street | CA15 6DX CA15 6DY |
| Rose Vale Terrace | CA15 7NS |
| Salmoor Way | CA15 8AZ |
| Selby Terrace | CA15 6LX |
| Senhouse Court | CA15 6HF |
| Senhouse Street | CA15 6BH CA15 6BN CA15 6BT |
| Solway Court | CA15 6LF |
| Solway View | CA15 6EN |
| South Quay | CA15 8AB |
| St Georges Place | CA15 6DU |
| Station Street | CA15 6DB CA15 6LT |
| The Ghyll | CA15 7BD |
| The Netherdales | CA15 7AQ |
| The Steele | CA15 7PX |
| West Quay | CA15 8BD |
| West Street | CA15 6AH |
| CA15 6PA CA15 7BE |
Transport near Maryport North
- FAQ
- Price Paid By Year
- Property Type Price
Frequently asked questions about Maryport North
What is the average price for a property for sale in Maryport North?
The average price for a property for sale in Maryport North is £147,656. This amount is 3% lower than the average price in Maryport. There are 438 property listings for sale in Maryport North.
What streets have the most expensive properties for sale in Maryport North?
The street with the most expensive properties for sale in Maryport North is The Netherdales at an average of £132,000.
What streets have the most affordable properties for sale in Maryport North?
The street with the most affordable properties for sale in Maryport North is Argyle Terrace at an average of £108,125.
Which train stations are available in or near Maryport North?
Some of the train stations available in or near Maryport North are Maryport, Flimby and Workington.
Property Price Paid in Maryport North by Year
The average sold property price by year was:
| Year | Average Sold Price | Price Change |
Sold Properties
|
|---|---|---|---|
| 2025 | £285,000 | 58% |
1 Property |
| 2024 | £121,000 | -23% |
2 Properties |
| 2023 | £149,333 | 31% |
3 Properties |
| 2022 | £103,125 | 10% |
2 Properties |
| 2021 | £92,500 | -17% |
4 Properties |
| 2019 | £108,000 | 59% |
1 Property |
| 2017 | £44,000 | -277% |
1 Property |
| 2015 | £166,000 | 40% |
1 Property |
| 2014 | £99,950 | -100% |
1 Property |
| 2008 | £200,000 | - |
1 Property |
Property Price per Property Type in Maryport North
Here you can find historic sold price data in order to help with your property search.
The average Property Paid Price for specific property types in the last three years are:
| Property Type | Average Sold Price | Sold Properties |
|---|---|---|
| Detached House | £199,000.00 | 3 Detached Houses |
| Terraced House | £116,850.00 | 5 Terraced Houses |

