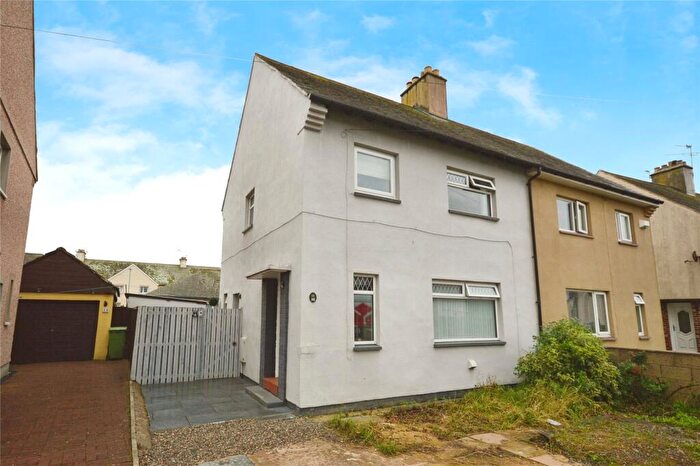
Houses for sale & to rent in Netherhall, Maryport
House Prices in Netherhall
Properties in Netherhall have an average house price of £146,546.00 and had 139 Property Transactions within the last 3 years¹.
Netherhall is an area in Maryport, Cumbria with 1,291 households², where the most expensive property was sold for £370,000.00.
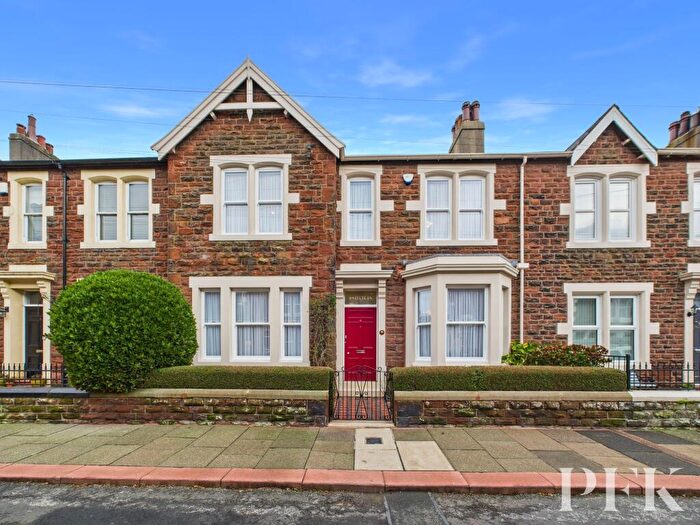
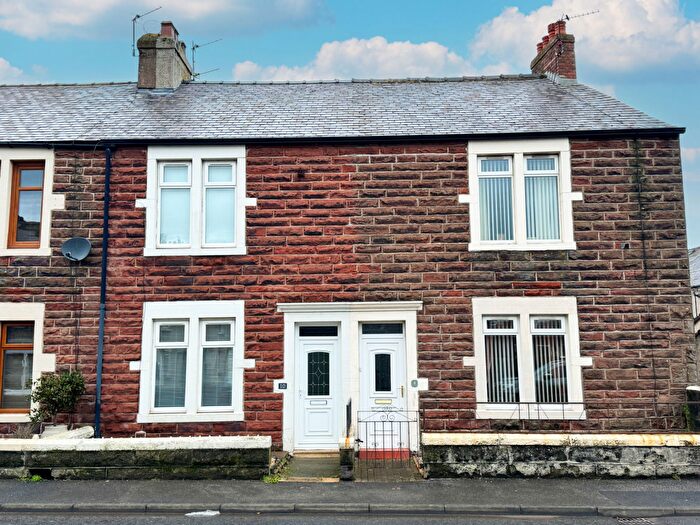
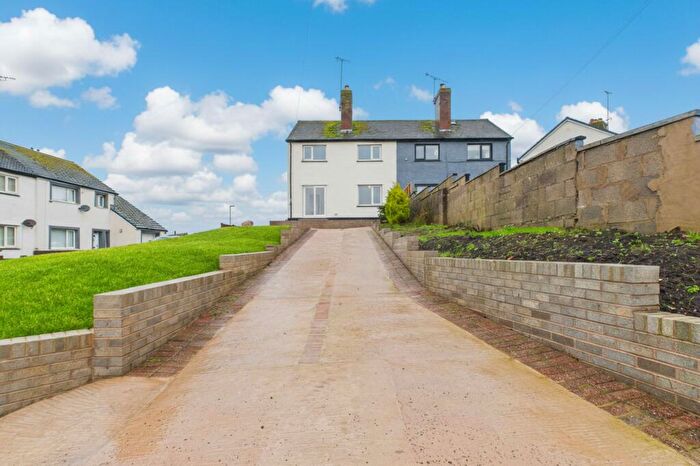
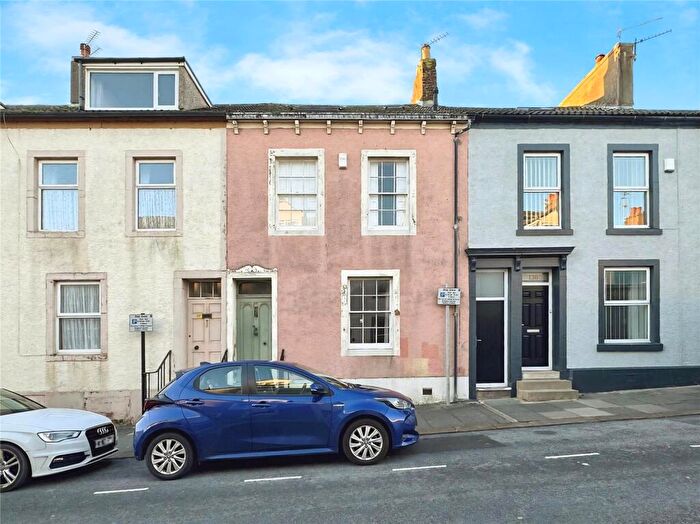
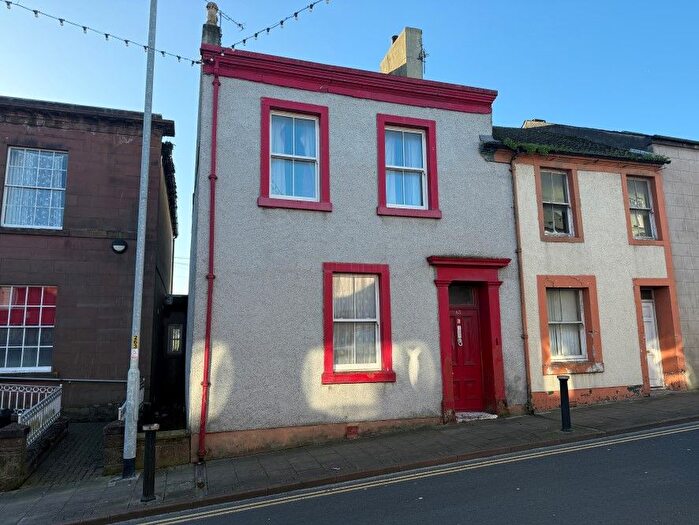
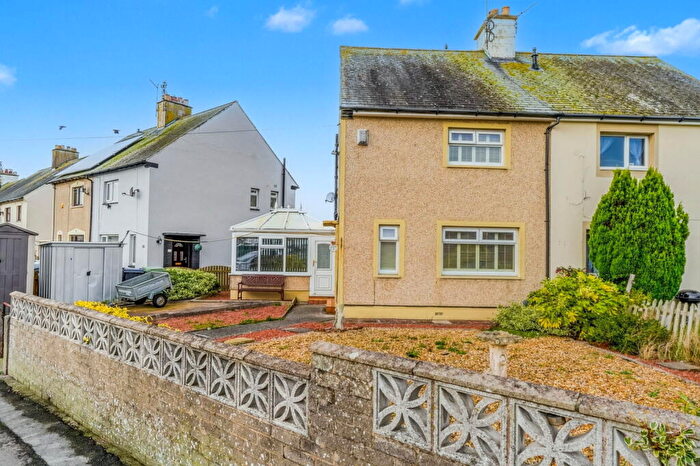
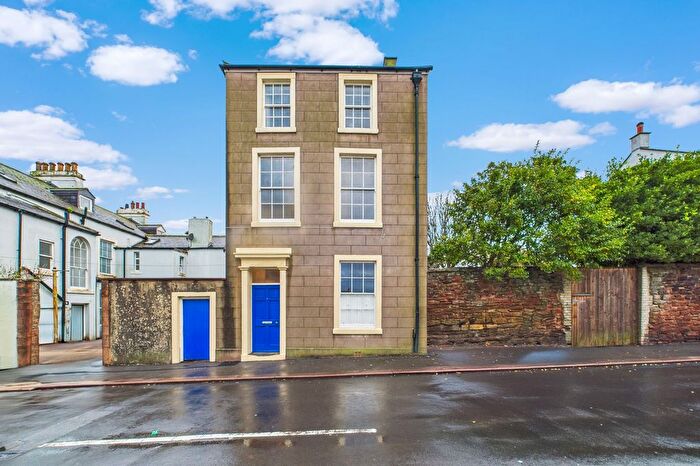
Properties for sale in Netherhall
Previously listed properties in Netherhall
Roads and Postcodes in Netherhall
Navigate through our locations to find the location of your next house in Netherhall, Maryport for sale or to rent.
| Streets | Postcodes |
|---|---|
| Alauna Drive | CA15 6JQ |
| Brow Street | CA15 6EF |
| Camp Road | CA15 6HZ CA15 6JA CA15 6JH CA15 6JL CA15 6JN |
| Camp Side | CA15 6NX |
| Camp Street | CA15 6HP |
| Careys Yard | CA15 6HH |
| Catherine Street | CA15 6DW CA15 6DZ |
| Christian Street | CA15 6HT |
| Church Street | CA15 6HA CA15 6HE |
| Churchill Place | CA15 6AU |
| Criffel Avenue | CA15 6JJ |
| Crosby Street | CA15 6BP CA15 6DP CA15 6DR CA15 6DS CA15 6JX CA15 6LA CA15 6LB |
| Crossings Terrace | CA15 8EA |
| Curzon Street | CA15 6DA CA15 6LL CA15 6LN CA15 6LW |
| Eaglesfield Street | CA15 6EU CA15 6HG |
| Ellen Wharf | CA15 8BG |
| Ellenborough Place | CA15 8EE CA15 8EF |
| Fleming Place | CA15 6ES |
| Fleming Square | CA15 6ET CA15 6HQ |
| Fleming Street | CA15 6HJ |
| Furnace Lane | CA15 6DQ |
| George Street | CA15 6DT |
| Gilmour Street | CA15 8DZ |
| Grasslot Street | CA15 8DB |
| High Street | CA15 6BE CA15 6BG CA15 6BQ CA15 6EH CA15 6EJ CA15 6EQ |
| Ingleby Terrace | CA15 6JB |
| Ismay Wharf | CA15 8AX |
| John Street | CA15 6JT CA15 6JU CA15 6LJ |
| King Street | CA15 6AJ CA15 6AS CA15 6AT CA15 6AZ |
| Kirkby Street | CA15 6EX CA15 6EZ |
| Lawson Street | CA15 6LY CA15 6LZ CA15 6ND |
| Lower Church Street | CA15 6JE CA15 6LE |
| Main Road | CA15 8BT CA15 8DD |
| Marine Road | CA15 8AY |
| Mill Street | CA15 6DF |
| Mill Street North | CA15 6DE |
| Nelson Street | CA15 6BB CA15 6BD |
| Norman Terrace | CA15 8EB |
| North Quay | CA15 6AN |
| North Street | CA15 6HR |
| Park Terrace | CA15 6HS |
| Ritson Wharf | CA15 8AF |
| Ropery Street | CA15 8DY |
| Selby Terrace | CA15 6NF |
| Senhouse Street | CA15 6AB CA15 6BL CA15 6BS CA15 6BU CA15 6NA CA15 6NB |
| Skiddaw Avenue | CA15 6JG |
| Solway Terrace | CA15 6EL |
| Station Court | CA15 6NH |
| Station Street | CA15 6DD CA15 6LR CA15 6LS |
| Strand Street | CA15 6AW |
| The Promenade | CA15 6EW CA15 6JD |
| Wallace Lane | CA15 6AX |
| Well Lane | CA15 6AE |
| Whitecroft | CA15 8NQ |
| Whitecroft Court | CA15 8NP |
| William Street | CA15 6HL |
| Wood Street | CA15 6EG CA15 6JZ CA15 6LD CA15 6LH |
| CA15 8DP |
Transport near Netherhall
- FAQ
- Price Paid By Year
- Property Type Price
Frequently asked questions about Netherhall
What is the average price for a property for sale in Netherhall?
The average price for a property for sale in Netherhall is £146,546. This amount is 5% lower than the average price in Maryport. There are 382 property listings for sale in Netherhall.
What streets have the most expensive properties for sale in Netherhall?
The streets with the most expensive properties for sale in Netherhall are Alauna Drive at an average of £297,500, Camp Road at an average of £251,666 and Ingleby Terrace at an average of £242,500.
What streets have the most affordable properties for sale in Netherhall?
The streets with the most affordable properties for sale in Netherhall are Norman Terrace at an average of £39,999, Well Lane at an average of £51,920 and Wood Street at an average of £71,666.
Which train stations are available in or near Netherhall?
Some of the train stations available in or near Netherhall are Maryport, Flimby and Workington.
Property Price Paid in Netherhall by Year
The average sold property price by year was:
| Year | Average Sold Price | Price Change |
Sold Properties
|
|---|---|---|---|
| 2025 | £158,014 | 6% |
34 Properties |
| 2024 | £148,021 | 8% |
61 Properties |
| 2023 | £135,640 | 4% |
44 Properties |
| 2022 | £129,678 | 5% |
46 Properties |
| 2021 | £122,835 | 5% |
58 Properties |
| 2020 | £116,147 | 4% |
46 Properties |
| 2019 | £111,467 | -11% |
44 Properties |
| 2018 | £123,211 | 10% |
40 Properties |
| 2017 | £111,094 | -1% |
59 Properties |
| 2016 | £112,212 | - |
46 Properties |
| 2015 | £112,213 | 14% |
50 Properties |
| 2014 | £96,825 | -22% |
52 Properties |
| 2013 | £118,254 | 13% |
41 Properties |
| 2012 | £102,414 | 1% |
32 Properties |
| 2011 | £101,535 | -13% |
41 Properties |
| 2010 | £114,508 | 9% |
30 Properties |
| 2009 | £103,869 | -17% |
31 Properties |
| 2008 | £121,841 | -8% |
46 Properties |
| 2007 | £131,668 | 23% |
80 Properties |
| 2006 | £101,597 | -1% |
82 Properties |
| 2005 | £102,343 | 9% |
62 Properties |
| 2004 | £93,445 | 31% |
76 Properties |
| 2003 | £64,228 | 25% |
85 Properties |
| 2002 | £48,180 | 16% |
67 Properties |
| 2001 | £40,241 | -3% |
68 Properties |
| 2000 | £41,495 | 5% |
61 Properties |
| 1999 | £39,507 | 1% |
55 Properties |
| 1998 | £39,011 | 14% |
50 Properties |
| 1997 | £33,509 | -6% |
71 Properties |
| 1996 | £35,407 | -5% |
59 Properties |
| 1995 | £37,210 | - |
50 Properties |
Property Price per Property Type in Netherhall
Here you can find historic sold price data in order to help with your property search.
The average Property Paid Price for specific property types in the last three years are:
| Property Type | Average Sold Price | Sold Properties |
|---|---|---|
| Semi Detached House | £193,225.00 | 20 Semi Detached Houses |
| Detached House | £280,555.00 | 9 Detached Houses |
| Terraced House | £132,320.00 | 96 Terraced Houses |
| Flat | £91,267.00 | 14 Flats |

