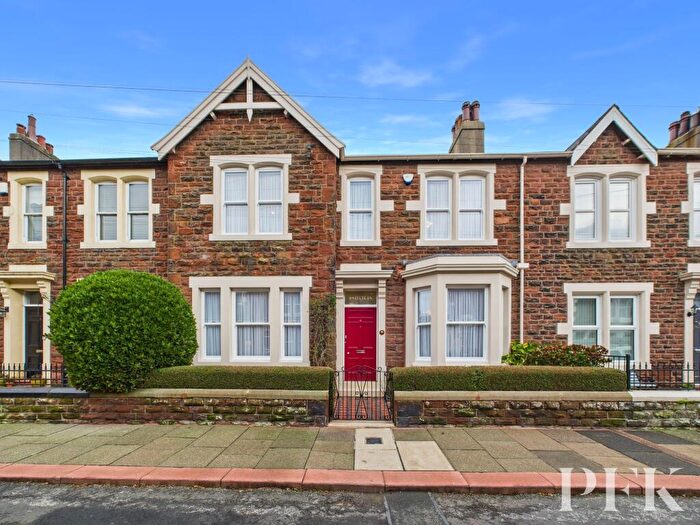
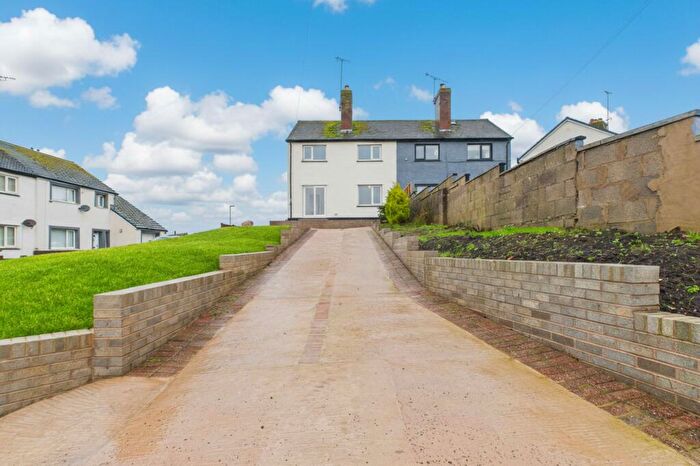
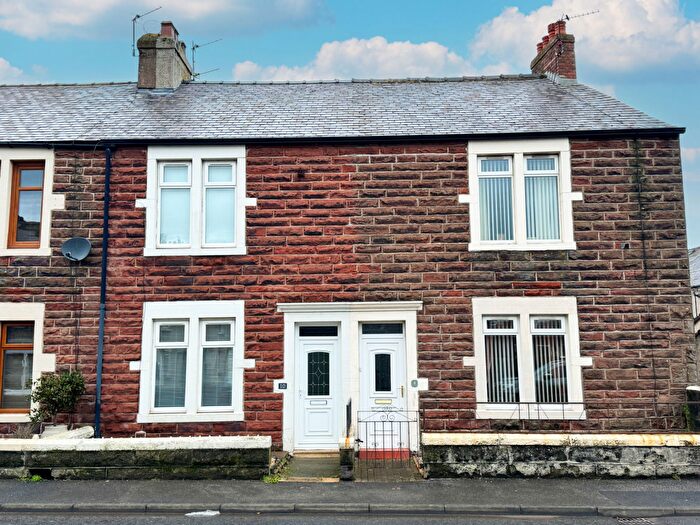
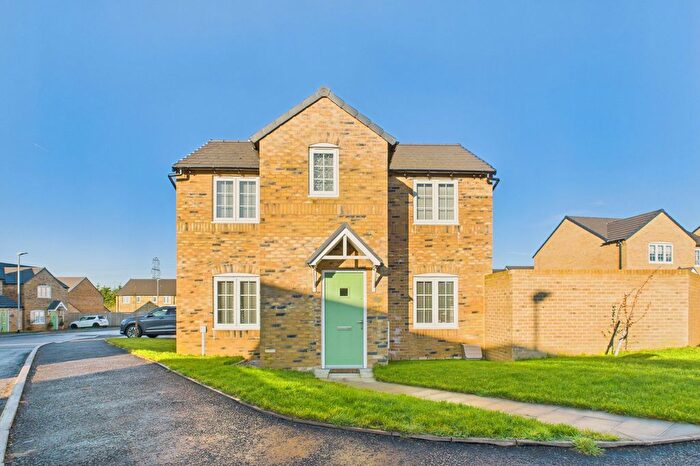
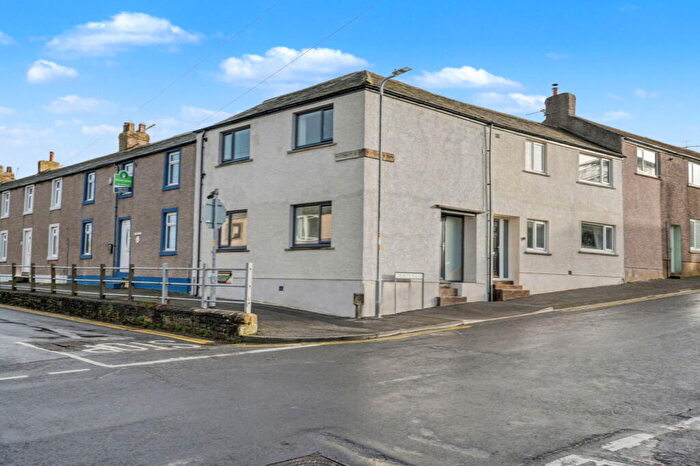
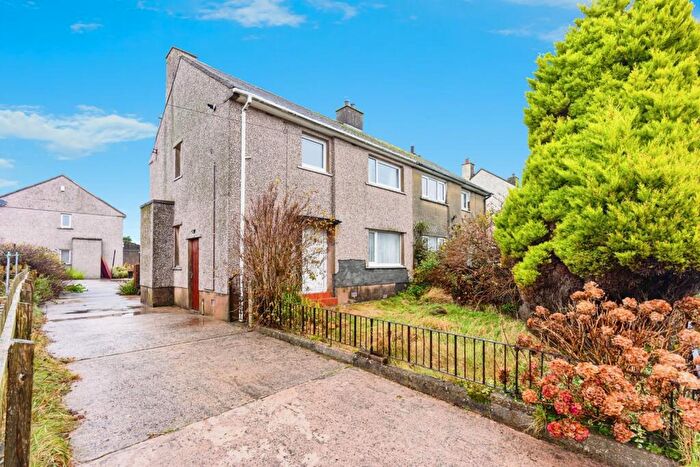
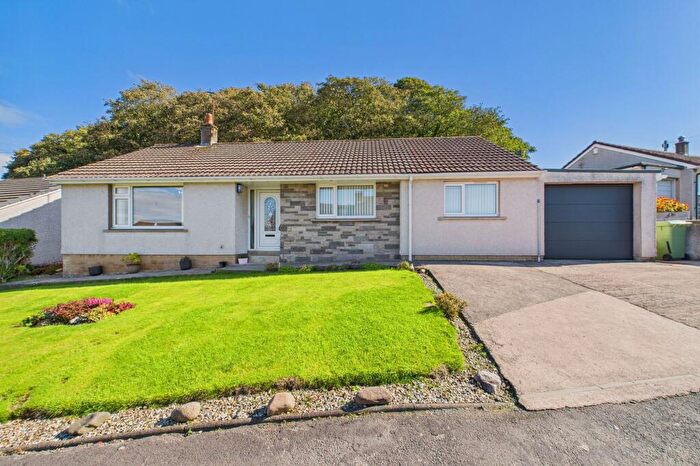
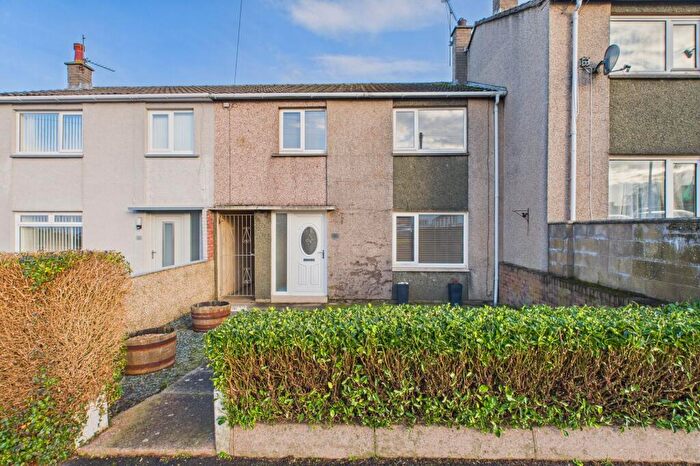
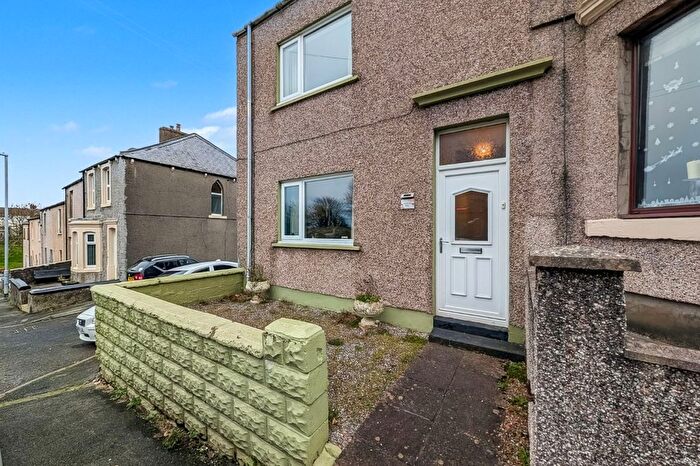
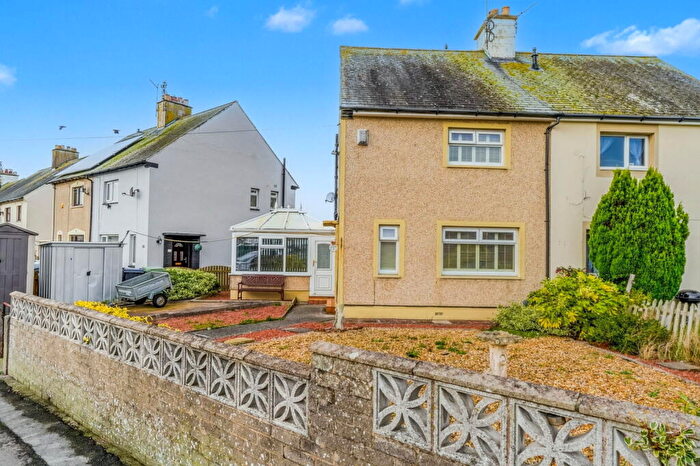
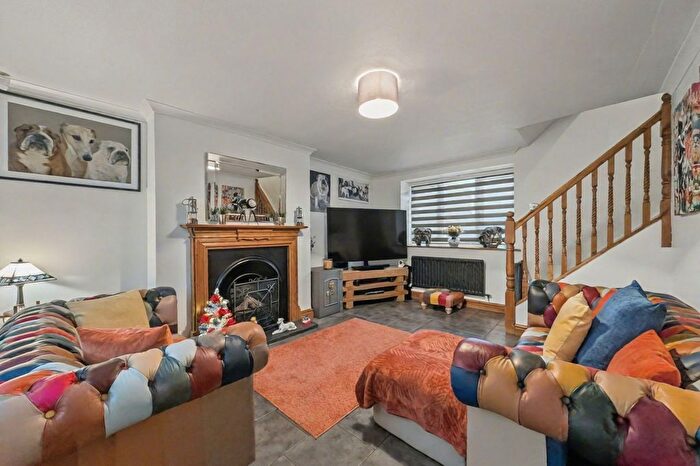
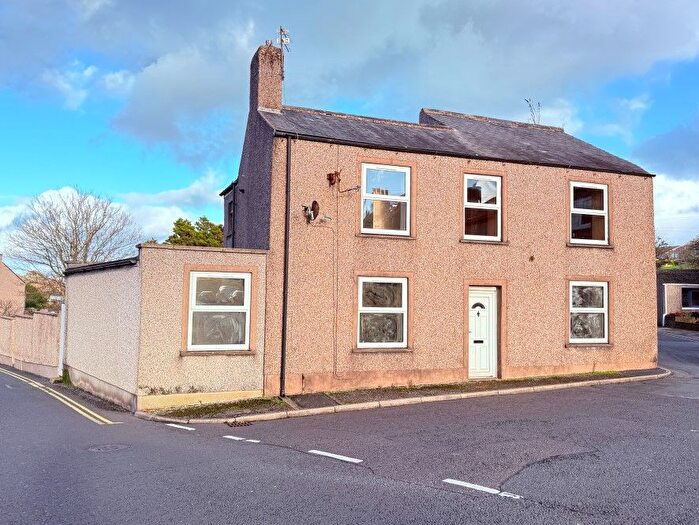
Houses for sale & to rent in Ewanrigg, Maryport
House Prices in Ewanrigg
Properties in Ewanrigg have an average house price of £131,264.00 and had 94 Property Transactions within the last 3 years¹.
Ewanrigg is an area in Maryport, Cumbria with 1,363 households², where the most expensive property was sold for £375,000.00.
Properties for sale in Ewanrigg
Previously listed properties in Ewanrigg
Roads and Postcodes in Ewanrigg
Navigate through our locations to find the location of your next house in Ewanrigg, Maryport for sale or to rent.
| Streets | Postcodes |
|---|---|
| Alne Road | CA15 8EP |
| Bank Terrace | CA15 8AN |
| Bounty Avenue | CA15 8HY CA15 8HZ |
| Buttermere Road | CA15 8JP CA15 8LA |
| Chapel Terrace | CA15 8SR |
| Church Road | CA15 7SS |
| Collins Terrace | CA15 8DL |
| Coronation Street | CA15 8AJ |
| Criffel View | CA15 8SG |
| Crummock Road | CA15 8LF |
| Edinburgh Road | CA15 8ER CA15 8ES CA15 8EY CA15 8EZ |
| Ennerdale Road | CA15 7QP CA15 8HN |
| Ewanrigg Road | CA15 8BJ CA15 8BL CA15 8HG CA15 8HJ CA15 8HL CA15 8JJ CA15 8JL CA15 8LB CA15 8LD CA15 8LE CA15 8LQ |
| Garner Street | CA15 8DE |
| Gavel Street | CA15 8AL CA15 8AW |
| Grasmere Terrace | CA15 7QN |
| Grasslot | CA15 8BU CA15 8BX CA15 8DA |
| Heatherfields | CA15 7RN CA15 7RS CA15 7RT |
| Irvings Terrace | CA15 8SQ |
| Jubilee Terrace | CA15 8AG |
| Loweswater Road | CA15 8JR |
| Lowlands View | CA15 7ST |
| Main Road | CA15 8DH |
| Main Street | CA15 7DU |
| Meadowlands | CA15 7EB |
| Melbreak Avenue | CA15 8JW |
| Milburn Cottages | CA15 7RY |
| Moorfields | CA15 7SF |
| Mosedale Crescent | CA15 8HH CA15 8HQ |
| Mountain View | CA15 7SP |
| New Bridge Street | CA15 8AP |
| Nixon Terrace | CA15 8SF |
| Peart Road | CA15 8AR |
| Planting Villas | CA15 8SP |
| Princess Drive | CA15 8HB |
| Queens Avenue | CA15 8HD |
| Roper Street | CA15 8DJ |
| Sandy Lonning | CA15 8AS CA15 8AT CA15 8LW |
| School Close | CA15 7SA CA15 8LP |
| Seaton Road | CA15 8ST |
| Steer Avenue | CA15 8BW |
| Sunnyslack | CA15 7RL CA15 7RW |
| Tarn View | CA15 8SW |
| The Arches | CA15 8JE |
| The Avenue | CA15 7RX |
| Thirlemere Road | CA15 7QL |
| Ullswater Road | CA15 8HT |
| Victory Crescent | CA15 7NA CA15 7NB CA15 7ND |
| Wilsons Terrace | CA15 7SG |
| Windermere Road | CA15 8BA CA15 8BH |
| Woodview | CA15 8SS |
| Wyndham Row | CA15 7SB |
| CA15 7RU CA15 7RZ |
Transport near Ewanrigg
- FAQ
- Price Paid By Year
- Property Type Price
Frequently asked questions about Ewanrigg
What is the average price for a property for sale in Ewanrigg?
The average price for a property for sale in Ewanrigg is £131,264. This amount is 15% lower than the average price in Maryport. There are 530 property listings for sale in Ewanrigg.
What streets have the most expensive properties for sale in Ewanrigg?
The streets with the most expensive properties for sale in Ewanrigg are Seaton Road at an average of £249,900, Sunnyslack at an average of £229,990 and Meadowlands at an average of £201,299.
What streets have the most affordable properties for sale in Ewanrigg?
The streets with the most affordable properties for sale in Ewanrigg are Ewanrigg Road at an average of £68,666, Jubilee Terrace at an average of £71,000 and Victory Crescent at an average of £80,000.
Which train stations are available in or near Ewanrigg?
Some of the train stations available in or near Ewanrigg are Maryport, Flimby and Workington.
Property Price Paid in Ewanrigg by Year
The average sold property price by year was:
| Year | Average Sold Price | Price Change |
Sold Properties
|
|---|---|---|---|
| 2025 | £117,002 | -8% |
23 Properties |
| 2024 | £126,035 | -17% |
39 Properties |
| 2023 | £147,889 | 24% |
32 Properties |
| 2022 | £113,007 | 12% |
47 Properties |
| 2021 | £98,984 | -2% |
45 Properties |
| 2020 | £100,801 | 1% |
33 Properties |
| 2019 | £99,649 | 3% |
35 Properties |
| 2018 | £96,624 | 24% |
32 Properties |
| 2017 | £73,288 | -23% |
39 Properties |
| 2016 | £89,865 | -1% |
38 Properties |
| 2015 | £90,855 | -11% |
26 Properties |
| 2014 | £101,081 | 27% |
36 Properties |
| 2013 | £73,384 | -10% |
19 Properties |
| 2012 | £80,763 | 1% |
19 Properties |
| 2011 | £79,884 | -41% |
23 Properties |
| 2010 | £112,855 | -6% |
31 Properties |
| 2009 | £119,909 | 8% |
22 Properties |
| 2008 | £110,454 | 4% |
35 Properties |
| 2007 | £106,256 | 21% |
43 Properties |
| 2006 | £84,251 | -7% |
35 Properties |
| 2005 | £90,310 | 30% |
29 Properties |
| 2004 | £63,522 | 38% |
42 Properties |
| 2003 | £39,647 | 15% |
39 Properties |
| 2002 | £33,539 | -1% |
38 Properties |
| 2001 | £33,740 | 0,1% |
34 Properties |
| 2000 | £33,712 | -12% |
20 Properties |
| 1999 | £37,674 | 38% |
25 Properties |
| 1998 | £23,260 | -25% |
20 Properties |
| 1997 | £28,963 | -59% |
30 Properties |
| 1996 | £46,150 | 35% |
15 Properties |
| 1995 | £29,909 | - |
22 Properties |
Property Price per Property Type in Ewanrigg
Here you can find historic sold price data in order to help with your property search.
The average Property Paid Price for specific property types in the last three years are:
| Property Type | Average Sold Price | Sold Properties |
|---|---|---|
| Semi Detached House | £118,582.00 | 29 Semi Detached Houses |
| Detached House | £253,961.00 | 13 Detached Houses |
| Terraced House | £107,663.00 | 52 Terraced Houses |

