
Houses for sale & to rent in DL3 0DF, Denton Close, Cockerton West, Darlington
House Prices in DL3 0DF, Denton Close, Cockerton West
Properties in DL3 0DF have no sales history available within the last 3 years. DL3 0DF is a postcode in Denton Close located in Cockerton West, an area in Darlington, Darlington, with 10 households².
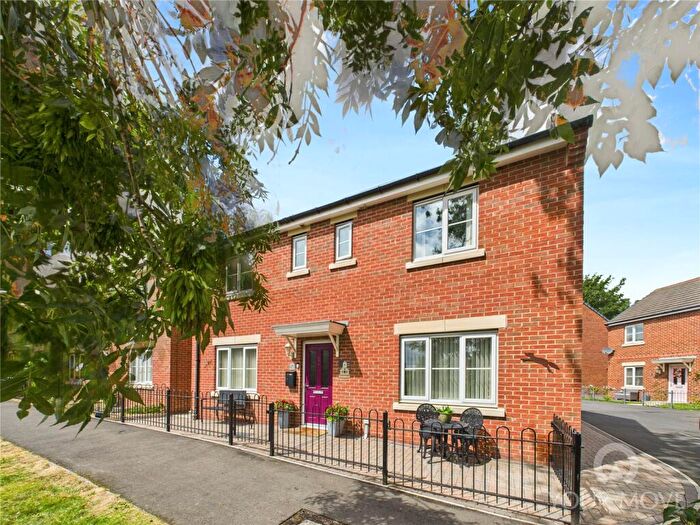
Properties for sale near DL3 0DF, Denton Close


![]()
If you are looking to sell your house, let it out, or receive a property valuation, an expert can help you.
Click the button below to get started.


Price Paid in Denton Close, DL3 0DF, Cockerton West
8 Denton Close, DL3 0DF, Cockerton West Darlington
Property 8 has been sold 5 times. The last time it was sold was in 02/08/2021 and the sold price was £114,950.00.
This semi detached house, sold as a freehold on 02/08/2021, is a 71 sqm semi-detached house with an EPC rating of D.
| Date | Price | Property Type | Tenure | Classification |
|---|---|---|---|---|
| 02/08/2021 | £114,950.00 | Semi Detached House | freehold | Established Building |
| 21/06/2017 | £98,500.00 | Semi Detached House | freehold | Established Building |
| 28/08/2009 | £74,500.00 | Semi Detached House | freehold | Established Building |
| 17/10/2008 | £105,000.00 | Semi Detached House | freehold | Established Building |
| 30/11/1995 | £33,000.00 | Semi Detached House | freehold | Established Building |
10 Denton Close, DL3 0DF, Cockerton West Darlington
Property 10 has been sold 2 times. The last time it was sold was in 27/11/2013 and the sold price was £83,000.00.
This semi detached house, sold as a freehold on 27/11/2013, is a 70 sqm semi-detached house with an EPC rating of D.
| Date | Price | Property Type | Tenure | Classification |
|---|---|---|---|---|
| 27/11/2013 | £83,000.00 | Semi Detached House | freehold | Established Building |
| 30/05/2008 | £104,500.00 | Semi Detached House | freehold | Established Building |
Transport near DL3 0DF, Denton Close

House price paid reports for DL3 0DF, Denton Close
Click on the buttons below to see price paid reports by year or property price:
- Price Paid By Year
Property Price Paid in DL3 0DF, Denton Close by Year
The average sold property price by year was:
| Year | Average Sold Price | Price Change |
Sold Properties
|
|---|---|---|---|
| 2021 | £114,950 | 14% |
1 Property |
| 2017 | £98,500 | 16% |
1 Property |
| 2013 | £83,000 | 10% |
1 Property |
| 2009 | £74,500 | -41% |
1 Property |
| 2008 | £104,750 | 68% |
2 Properties |
| 1995 | £33,000 | - |
1 Property |