
Houses for sale & to rent in Mowden, Darlington
House Prices in Mowden
Properties in Mowden have an average house price of £236k and had 167 Property Transactions within the last 3 years¹.
Mowden is an area in Darlington, Darlington with 1,678 households², where the most expensive property was sold for £686k.
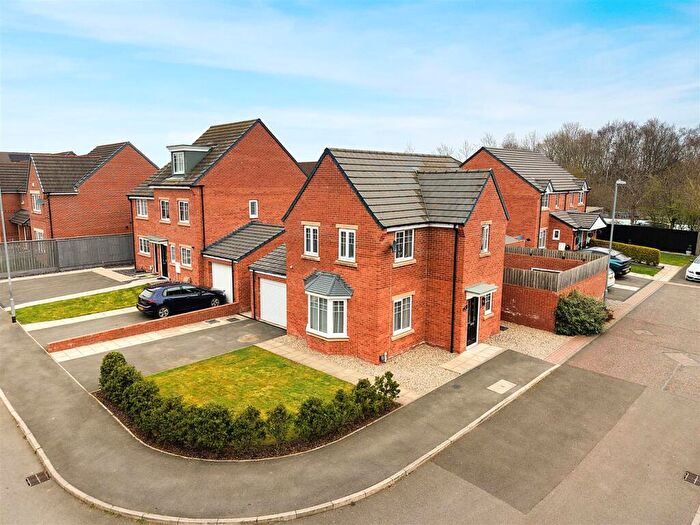
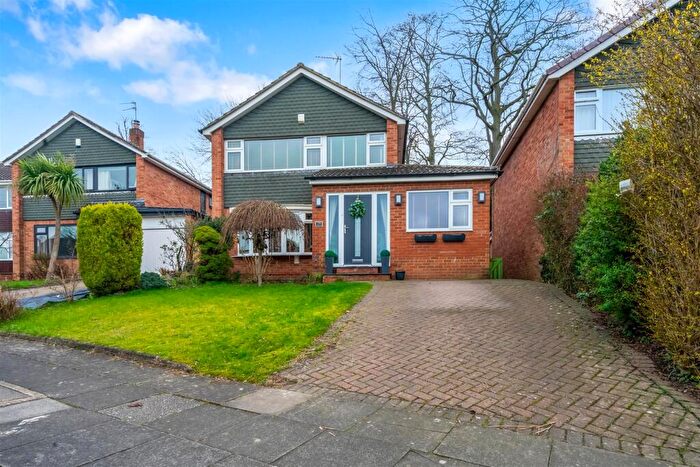
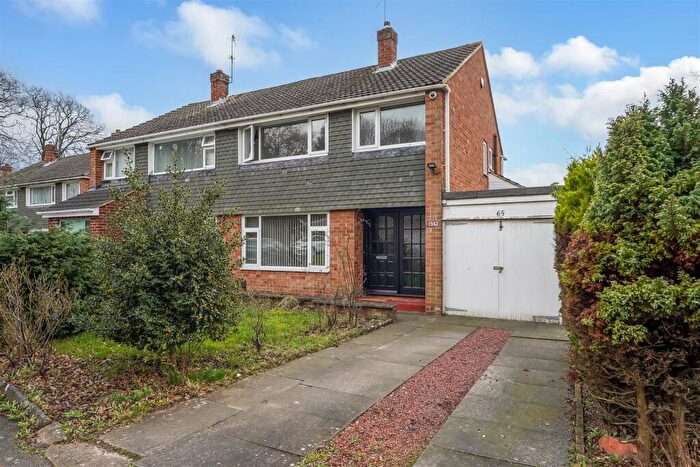
Properties for sale in Mowden
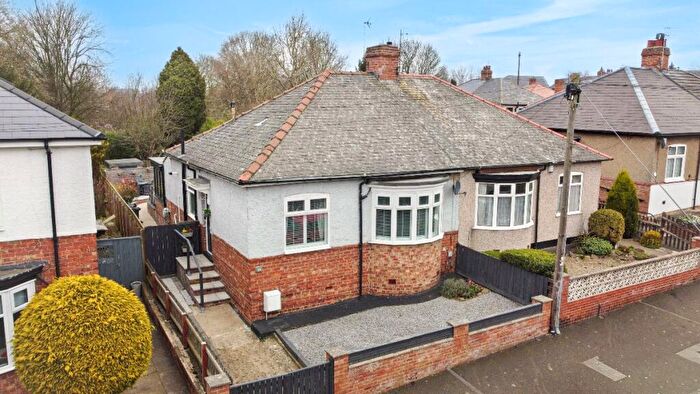
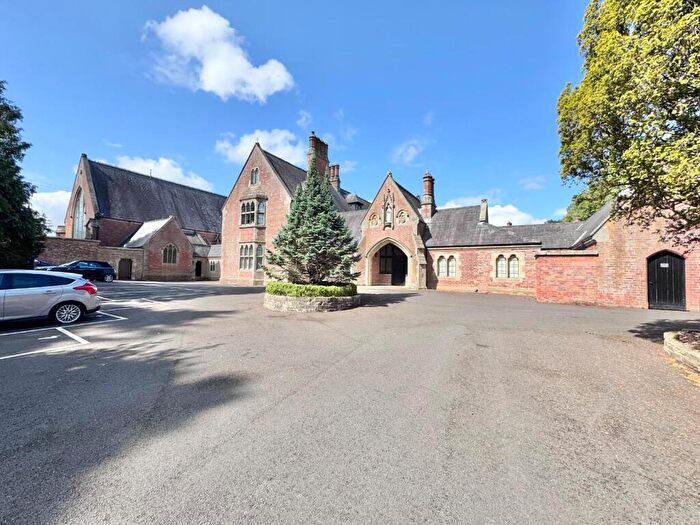
![]()
If you are looking to sell your house, let it out, or receive a property valuation, an expert can help you.
Click the button below to get started.

Roads and Postcodes in Mowden
Navigate through our locations to find the location of your next house in Mowden, Darlington for sale or to rent.
| Streets | Postcodes |
|---|---|
| Barnes Close | DL3 9BP |
| Barnes Road | DL3 9BH DL3 9BL DL3 9BN DL3 9DA DL3 9DX |
| Boundary View | DL3 9BQ |
| Bushel Hill Court | DL3 9QF |
| Bushel Hill Drive | DL3 9QG |
| Carisbrooke Walk | DL3 9XW |
| Carlbury Crescent | DL3 9QL DL3 9QW |
| Carleton Drive | DL3 9QP DL3 9QR DL3 9QX |
| Carleton Grove | DL3 9QY |
| Carmel Road North | DL3 9TF DL3 9TA |
| Chase Close | DL3 9DR |
| Chester Grove | DL3 9DY |
| Clarence Drive | DL3 9XU |
| Claxton Avenue | DL3 9PY DL3 9PZ DL3 9QA |
| Compton Grove | DL3 9AZ |
| Conyers Avenue | DL3 9DB DL3 9DE |
| Conyers Close | DL3 9DD |
| Conyers Grove | DL3 9DF |
| Coppice Walk | DL3 9DP |
| Edgecombe Drive | DL3 9DG DL3 9DL DL3 9DQ DL3 9DS |
| Edgecombe Grove | DL3 9DW |
| Farndale Crescent | DL3 9AP |
| Freville Grove | DL3 9QN |
| Fulthorpe Avenue | DL3 9PU DL3 9QH DL3 9QQ DL3 9XJ DL3 9XT |
| Fulthorpe Close | DL3 9PX |
| Fulthorpe Grove | DL3 9QJ |
| Garthorne Avenue | DL3 9XL |
| Greystones Drive | DL3 9TN |
| Hall View Grove | DL3 9DN |
| High Green | DL3 9DZ |
| Highgrove Close | DL3 9XQ |
| Kew Rise | DL3 9BW |
| Lazenby Close | DL3 9QE |
| Lazenby Crescent | DL3 9QB |
| Lazenby Grove | DL3 9QD |
| Lunedale Road | DL3 9AS DL3 9AT DL3 9AU |
| Mowden Hall Drive | DL3 9BJ |
| Mowden Walk | DL3 9DJ |
| Murray Walk | DL3 9QS |
| Nunnery Close | DL3 9PR |
| Nunnery Lane | DL3 9BA DL3 9BD DL3 9PP |
| Osborne Close | DL3 9YE |
| Parkland Drive | DL3 9DT DL3 9DU |
| Parkland Grove | DL3 9DH |
| Pennine Close | DL3 9YA |
| Sandringham Court | DL3 9FB |
| Staindrop Crescent | DL3 9AQ |
| Staindrop Road | DL3 9AE DL3 9AG DL3 9AH DL3 9AY DL3 9BE |
| Stainwood Court | DL3 9YF |
| Sutton Close | DL3 9XR |
| Swaledale Avenue | DL3 9AJ DL3 9AL DL3 9AR |
| Villiers Close | DL3 9QT |
| Westfield Drive | DL3 9BB |
| Wilton Drive | DL3 9PT |
| Yiewsley Drive | DL3 9XN DL3 9XP DL3 9XS |
| Yoredale Avenue | DL3 9AN |
| Yoredale Drive | DL3 9AW |
Transport near Mowden

- FAQ
- Price Paid By Year
- Property Type Price
Frequently asked questions about Mowden
What is the average price for a property for sale in Mowden?
The average price for a property for sale in Mowden is £236,485. This amount is 45% higher than the average price in Darlington. There are 956 property listings for sale in Mowden.
What streets have the most expensive properties for sale in Mowden?
The streets with the most expensive properties for sale in Mowden are Highgrove Close at an average of £480,000, Compton Grove at an average of £447,000 and Pennine Close at an average of £398,000.
What streets have the most affordable properties for sale in Mowden?
The streets with the most affordable properties for sale in Mowden are Sandringham Court at an average of £129,142, Bushel Hill Court at an average of £167,500 and Greystones Drive at an average of £173,000.
Which train stations are available in or near Mowden?
Some of the train stations available in or near Mowden are North Road, Darlington and Heighington.
Property Price Paid in Mowden by Year
The average sold property price by year was:
| Year | Average Sold Price | Price Change |
Sold Properties
|
|---|---|---|---|
| 2026 | £293,000 | 14% |
1 Property |
| 2025 | £252,206 | 7% |
43 Properties |
| 2024 | £233,529 | 3% |
63 Properties |
| 2023 | £227,379 | 4% |
60 Properties |
| 2022 | £218,125 | 1% |
56 Properties |
| 2021 | £216,100 | 1% |
81 Properties |
| 2020 | £213,023 | 3% |
71 Properties |
| 2019 | £207,144 | 10% |
69 Properties |
| 2018 | £186,429 | 1% |
60 Properties |
| 2017 | £185,190 | 1% |
88 Properties |
| 2016 | £183,639 | -29% |
70 Properties |
| 2015 | £237,606 | 13% |
103 Properties |
| 2014 | £207,584 | 21% |
104 Properties |
| 2013 | £163,778 | -4% |
60 Properties |
| 2012 | £169,900 | 4% |
53 Properties |
| 2011 | £163,133 | -17% |
45 Properties |
| 2010 | £191,052 | 16% |
43 Properties |
| 2009 | £160,111 | -8% |
57 Properties |
| 2008 | £173,458 | - |
52 Properties |
| 2007 | £173,397 | 5% |
60 Properties |
| 2006 | £165,392 | -9% |
73 Properties |
| 2005 | £180,704 | 11% |
60 Properties |
| 2004 | £160,323 | 19% |
86 Properties |
| 2003 | £129,522 | 22% |
94 Properties |
| 2002 | £101,089 | 13% |
96 Properties |
| 2001 | £87,794 | 14% |
87 Properties |
| 2000 | £75,854 | -1% |
58 Properties |
| 1999 | £76,446 | 3% |
86 Properties |
| 1998 | £74,213 | 6% |
57 Properties |
| 1997 | £69,751 | 0,4% |
87 Properties |
| 1996 | £69,476 | 10% |
52 Properties |
| 1995 | £62,317 | - |
42 Properties |
Property Price per Property Type in Mowden
Here you can find historic sold price data in order to help with your property search.
The average Property Paid Price for specific property types in the last three years are:
| Property Type | Average Sold Price | Sold Properties |
|---|---|---|
| Semi Detached House | £227,068.00 | 113 Semi Detached Houses |
| Detached House | £301,022.00 | 36 Detached Houses |
| Terraced House | £224,375.00 | 4 Terraced Houses |
| Flat | £150,000.00 | 14 Flats |