
Houses for sale & to rent in Eastbourne, Darlington
House Prices in Eastbourne
Properties in Eastbourne have an average house price of £126k and had 280 Property Transactions within the last 3 years¹.
Eastbourne is an area in Darlington, Darlington with 2,738 households², where the most expensive property was sold for £415k.
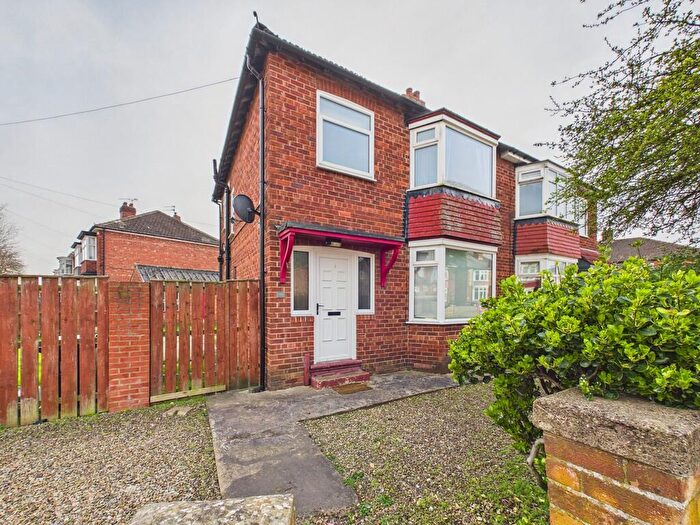
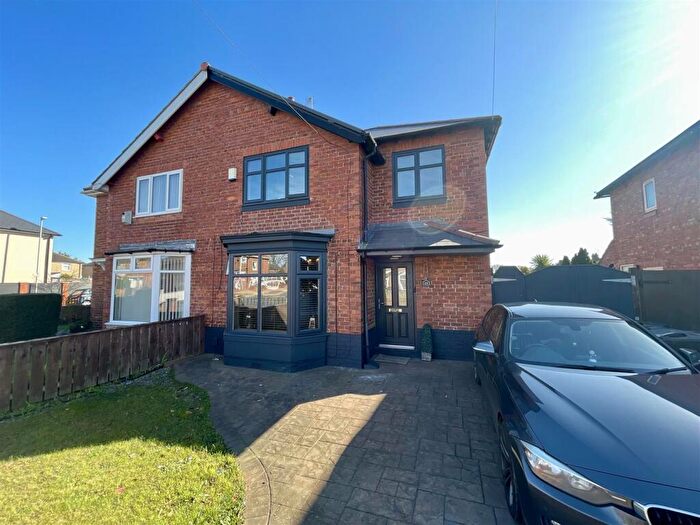
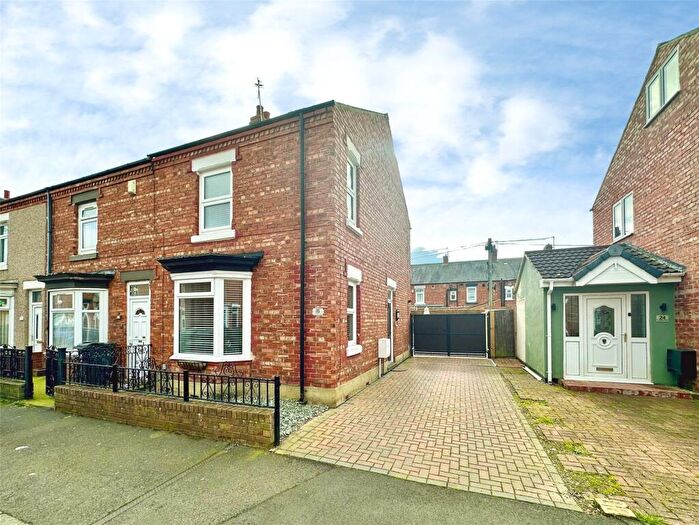
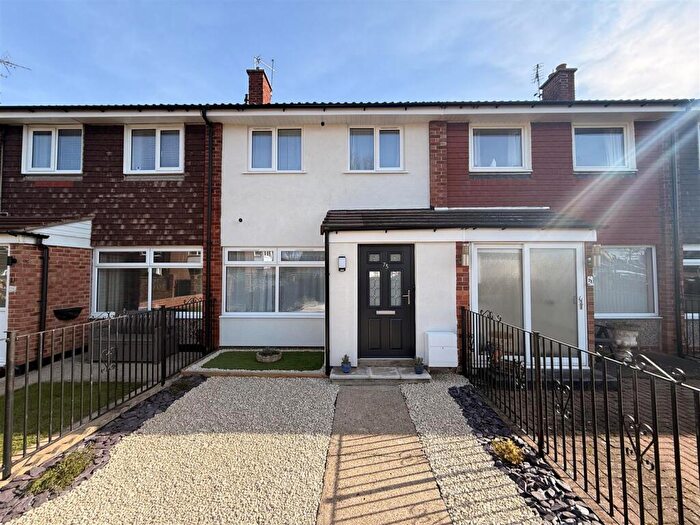
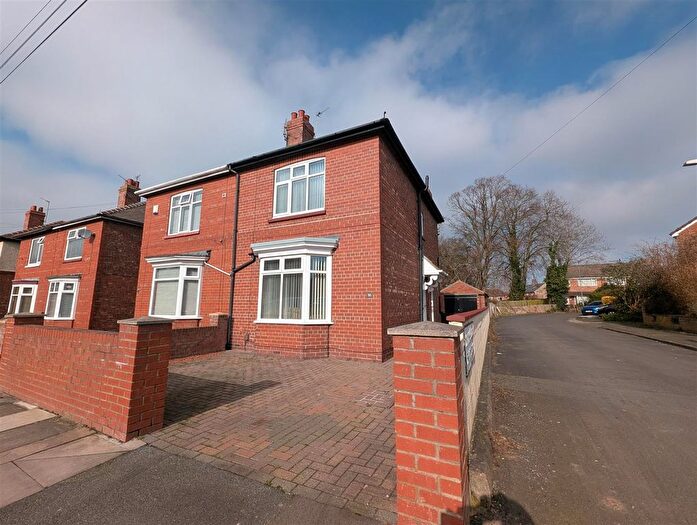
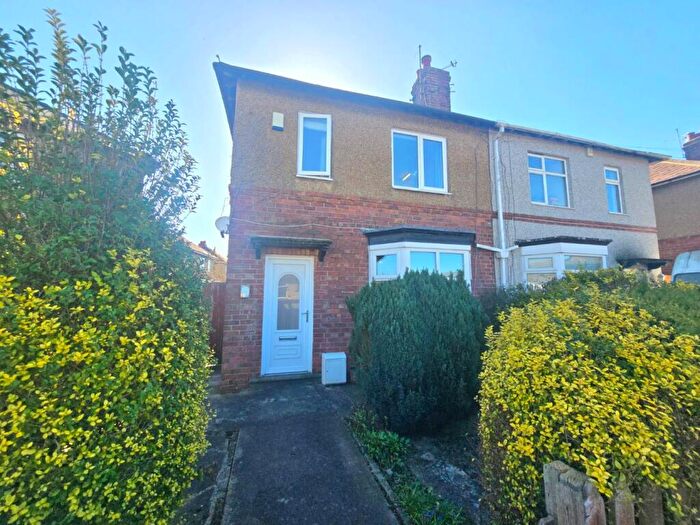
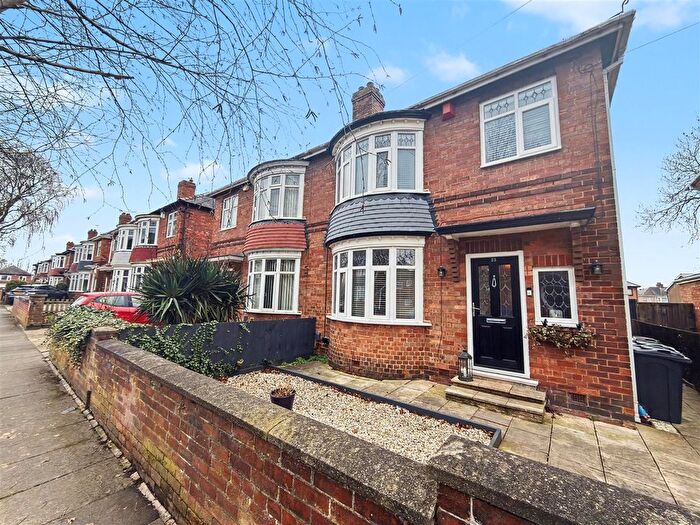
Properties for sale in Eastbourne
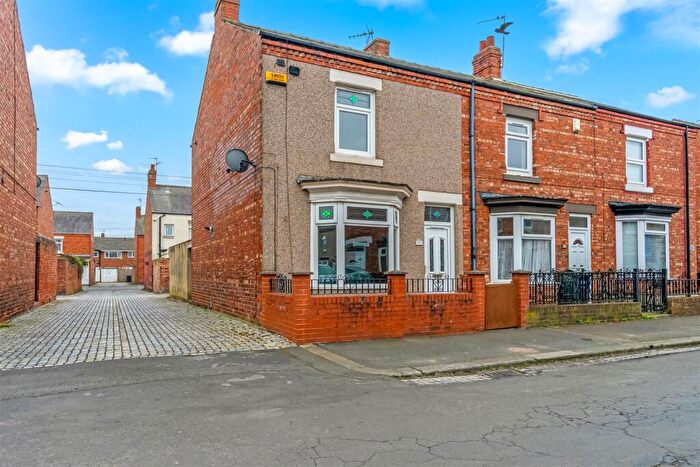
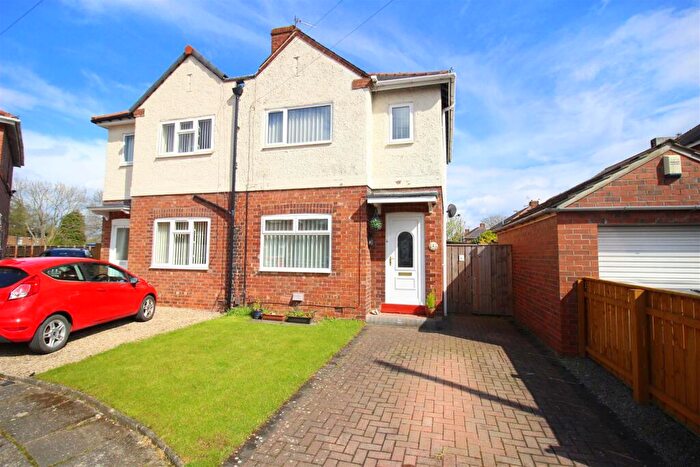
![]()
If you are looking to sell your house, let it out, or receive a property valuation, an expert can help you.
Click the button below to get started.
Roads and Postcodes in Eastbourne
Navigate through our locations to find the location of your next house in Eastbourne, Darlington for sale or to rent.
| Streets | Postcodes |
|---|---|
| Alston Moor Close | DL1 4TA |
| Audrey Grove | DL1 4PD |
| Barden Moor Road | DL1 4LP DL1 4LT DL1 4LW |
| Blackmoor Close | DL1 4RU |
| Brankin Drive | DL1 4LH DL1 4LQ |
| Brankin Road | DL1 4LE DL1 4LJ DL1 4LL |
| Brignall Moor Crescent | DL1 4SQ |
| Burnside Road | DL1 4SA DL1 4SU DL1 4SX |
| Buxton Moor Crescent | DL1 4QP DL1 4QW |
| Carlton Moor Crescent | DL1 4RF |
| Carnaby Road | DL1 4NR DL1 4NS |
| Chestnut Drive | DL1 4RR DL1 4RS |
| Claremont Road | DL1 4HQ |
| Cotherstone Moor Drive | DL1 4SZ |
| Edgemoor Road | DL1 4QE DL1 4QU DL1 4QF |
| Emley Moor Road | DL1 4QH DL1 4QL DL1 4QQ |
| Estoril Road | DL1 4ND |
| Estoril Road South | DL1 4SN DL1 4SP DL1 4SW |
| Firthmoor Crescent | DL1 4SL |
| Forest Moor Road | DL1 4RB DL1 4RE |
| Geneva Crescent | DL1 4JU DL1 4LA DL1 4LD |
| Geneva Drive | DL1 4JT |
| Geneva Gardens | DL1 4LB |
| Geneva Road | DL1 4HH DL1 4HR DL1 4HS DL1 4NE |
| Grangemoor Close | DL1 4UW |
| Harris Street | DL1 4NL DL1 4NN DL1 4NP |
| Helmsley Moor Way | DL1 4QS |
| Hewitson Road | DL1 4NU |
| Hewitson Road South | DL1 4SJ |
| Hildon Drive | DL1 4LF |
| Hirst Grove | DL1 4NX |
| Holgate Moor Green | DL1 4QG |
| Holly Close | DL1 4RZ |
| Ingleby Moor Crescent | DL1 4RW |
| Kexwith Moor Close | DL1 4RD |
| Kildale Moor Place | DL1 4ST |
| Lanethorpe Crescent | DL1 4SH |
| Lanethorpe Road | DL1 4SF DL1 4SG |
| Larch Court | DL1 4TD |
| Levisham Lane | DL2 1QZ |
| Lowmoor Road | DL1 4RG |
| Lynton Gardens | DL1 4PA DL1 4PB |
| Marston Moor Road | DL1 4SR |
| Masham Moor Way | DL1 4QR |
| Moorfield Close | DL1 4RX |
| Neasham Drive | DL1 4LG |
| Neasham Road | DL1 4DJ DL2 1DL |
| Oakmoor Close | DL1 4RY |
| Parkside | DL1 4JZ |
| Pateley Moor Crescent | DL1 4LR DL1 4LS |
| Pilmoor Green | DL1 4QJ |
| Pinewood Close | DL1 4US |
| Redwood Close | DL1 4WA |
| Reeth Moor Close | DL1 4SS |
| Richmond Way | DL1 4RL |
| Ridgewood Close | DL1 4TE |
| Ripon Drive | DL1 4JX |
| Roxby Moor Avenue | DL1 4SY DL1 4TB |
| Skipton Moor Close | DL1 4QT |
| Southmoor Close | DL1 4RT |
| Stocksmoor Close | DL1 4QN |
| Swallow Close | DL1 4RP |
| Tansley Gardens | DL1 4NW |
| Warren Close | DL1 4RQ |
| West Moor Road | DL1 4LN |
| Westminster Road | DL1 4SB DL1 4SD |
| Whitwell Road | DL1 4NT |
| Worton Drive | DL1 4JY |
| Yarm Road | DL1 1XL DL1 1XN DL1 1XW DL1 4PW |
Transport near Eastbourne

- FAQ
- Price Paid By Year
- Property Type Price
Frequently asked questions about Eastbourne
What is the average price for a property for sale in Eastbourne?
The average price for a property for sale in Eastbourne is £125,603. This amount is 23% lower than the average price in Darlington. There are 683 property listings for sale in Eastbourne.
What streets have the most expensive properties for sale in Eastbourne?
The streets with the most expensive properties for sale in Eastbourne are Neasham Road at an average of £204,700, Richmond Way at an average of £192,285 and Swallow Close at an average of £185,800.
What streets have the most affordable properties for sale in Eastbourne?
The streets with the most affordable properties for sale in Eastbourne are Cotherstone Moor Drive at an average of £69,750, Kexwith Moor Close at an average of £77,500 and Pateley Moor Crescent at an average of £82,375.
Which train stations are available in or near Eastbourne?
Some of the train stations available in or near Eastbourne are Darlington, North Road and Dinsdale.
Property Price Paid in Eastbourne by Year
The average sold property price by year was:
| Year | Average Sold Price | Price Change |
Sold Properties
|
|---|---|---|---|
| 2026 | £117,000 | -8% |
2 Properties |
| 2025 | £125,797 | -3% |
84 Properties |
| 2024 | £129,864 | 7% |
103 Properties |
| 2023 | £120,791 | -8% |
91 Properties |
| 2022 | £130,416 | 15% |
91 Properties |
| 2021 | £110,320 | 2% |
111 Properties |
| 2020 | £108,443 | 3% |
69 Properties |
| 2019 | £105,236 | 2% |
82 Properties |
| 2018 | £103,196 | 2% |
89 Properties |
| 2017 | £101,608 | 1% |
73 Properties |
| 2016 | £100,334 | 15% |
101 Properties |
| 2015 | £85,768 | -15% |
73 Properties |
| 2014 | £98,293 | 5% |
96 Properties |
| 2013 | £93,419 | -0,2% |
78 Properties |
| 2012 | £93,631 | -5% |
37 Properties |
| 2011 | £98,357 | 11% |
69 Properties |
| 2010 | £87,943 | -17% |
58 Properties |
| 2009 | £102,676 | -16% |
34 Properties |
| 2008 | £119,536 | 3% |
119 Properties |
| 2007 | £115,913 | 7% |
201 Properties |
| 2006 | £107,768 | -1% |
203 Properties |
| 2005 | £109,038 | 13% |
244 Properties |
| 2004 | £94,482 | 21% |
221 Properties |
| 2003 | £75,071 | 33% |
136 Properties |
| 2002 | £50,261 | 9% |
112 Properties |
| 2001 | £45,656 | 14% |
109 Properties |
| 2000 | £39,478 | 5% |
79 Properties |
| 1999 | £37,457 | -1% |
72 Properties |
| 1998 | £37,721 | -1% |
67 Properties |
| 1997 | £37,955 | 9% |
82 Properties |
| 1996 | £34,602 | -3% |
59 Properties |
| 1995 | £35,489 | - |
56 Properties |
Property Price per Property Type in Eastbourne
Here you can find historic sold price data in order to help with your property search.
The average Property Paid Price for specific property types in the last three years are:
| Property Type | Average Sold Price | Sold Properties |
|---|---|---|
| Semi Detached House | £122,877.00 | 193 Semi Detached Houses |
| Detached House | £186,423.00 | 26 Detached Houses |
| Terraced House | £107,694.00 | 60 Terraced Houses |
| Flat | £145,000.00 | 1 Flat |