
Houses for sale & to rent in Lascelles, Darlington
House Prices in Lascelles
Properties in Lascelles have an average house price of £107k and had 201 Property Transactions within the last 3 years¹.
Lascelles is an area in Darlington, Darlington with 1,703 households², where the most expensive property was sold for £255k.
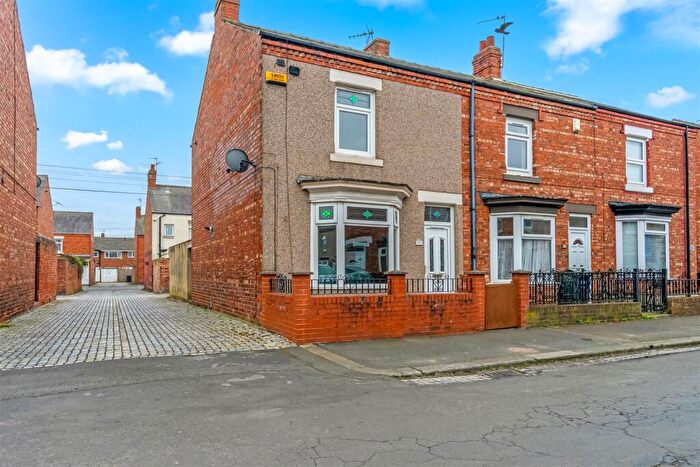
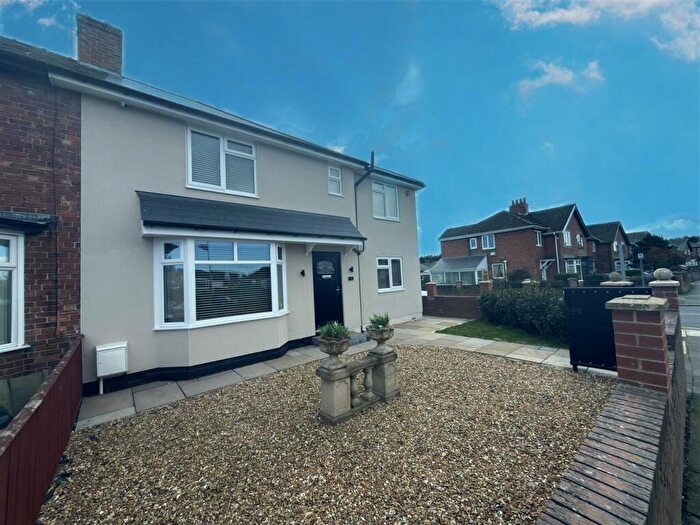
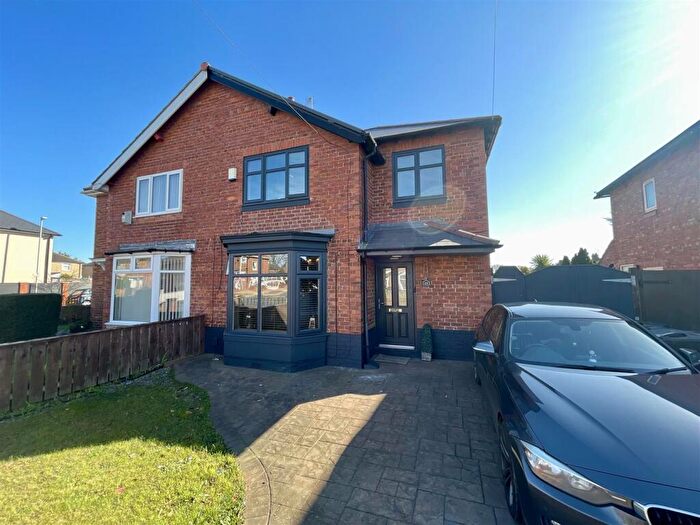
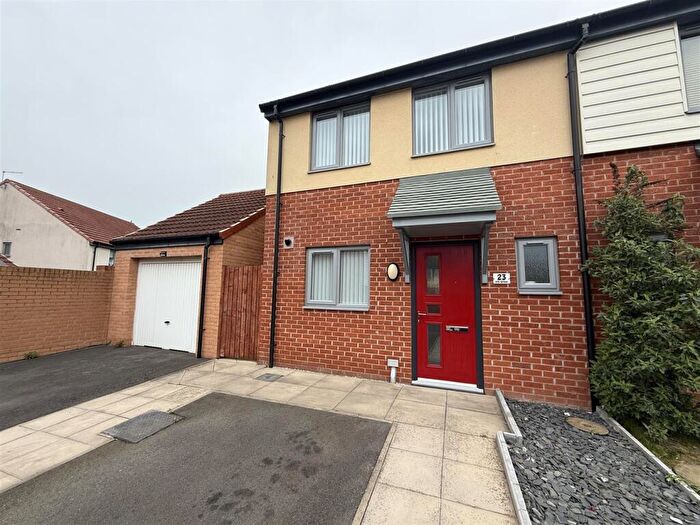
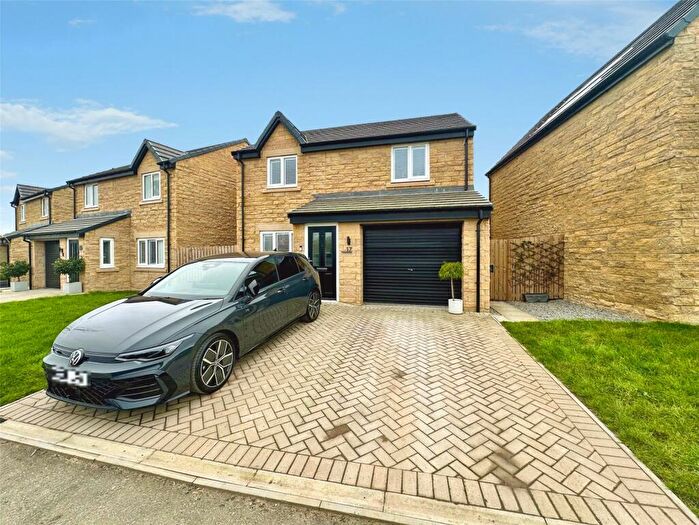
Properties for sale in Lascelles
![]()
If you are looking to sell your house, let it out, or receive a property valuation, an expert can help you.
Click the button below to get started.
Roads and Postcodes in Lascelles
Navigate through our locations to find the location of your next house in Lascelles, Darlington for sale or to rent.
| Streets | Postcodes |
|---|---|
| Aldbrough Walk | DL1 4TT |
| Aysgarth Road | DL1 4DB |
| Blackton Grove | DL1 4EA |
| Caldwell Green | DL1 4TW |
| Coxwold Drive | DL1 4UQ DL1 4XE DL1 4XF |
| Darwin Grove | DL1 4HN |
| Ennerdale Road | DL1 4DA |
| Eppleby Way | DL1 4TP |
| Falmer Road | DL1 4AY DL1 4AZ |
| Fenby Avenue | DL1 4HU DL1 4HX DL1 4HY DL1 4UF DL1 4UG |
| Fernlea Court | DL1 4YN |
| Geneva Lane | DL1 4JQ DL1 4JS |
| Geneva Road | DL1 4HG DL1 4HJ DL1 4HP DL1 4HT |
| Gilling Crescent | DL1 4TH DL1 4TU |
| Grasmere Road | DL1 4BG DL1 4BQ |
| Grassholme | DL1 4UT |
| Grinton Park Way | DL1 4UH |
| Harris Street | DL1 4HZ |
| Headlam Road | DL1 4UY DL1 4UZ DL1 4XB |
| Huxley Grove | DL1 4HW |
| Keswick Grove | DL1 4TQ |
| Langdale Road | DL1 4BP |
| Langton Walk | DL1 4UU |
| Lowther Drive | DL1 4LU DL1 4LZ |
| Maltby Court | DL1 4DZ |
| Melsonby Crescent | DL1 4TJ DL1 4TN DL1 4TS |
| Moulton Way | DL1 4TR |
| Neasham Road | DL1 4BE DL1 4BL DL1 4BN DL1 4BW DL1 4DF DL1 4DH |
| Parkside | DL1 4DP DL1 4JP DL1 4JR |
| Railway View | DL1 4DU DL1 4LX |
| Rydal Road | DL1 4BH |
| Scargill | DL1 4UP |
| Skeeby Road | DL1 4XQ |
| Smithfield Road | DL1 4DD |
| Spencer Grove | DL1 4HL |
| Starmer Crescent | DL1 4DG DL1 4DQ |
| Streatlam Road | DL1 4XG |
| Tebay Close | DL1 4JH |
| The Bakers | DL1 4NA |
| Thirlmere Road | DL1 4BJ |
| Tunstall Terrace | DL1 4XH |
| Ullswater Avenue | DL1 4TF |
| Windermere Court | DL1 4YW |
Transport near Lascelles

- FAQ
- Price Paid By Year
- Property Type Price
Frequently asked questions about Lascelles
What is the average price for a property for sale in Lascelles?
The average price for a property for sale in Lascelles is £106,675. This amount is 35% lower than the average price in Darlington. There are 823 property listings for sale in Lascelles.
What streets have the most expensive properties for sale in Lascelles?
The streets with the most expensive properties for sale in Lascelles are Railway View at an average of £218,333, Windermere Court at an average of £193,248 and Tebay Close at an average of £178,500.
What streets have the most affordable properties for sale in Lascelles?
The streets with the most affordable properties for sale in Lascelles are Eppleby Way at an average of £64,500, Caldwell Green at an average of £71,000 and Grasmere Road at an average of £71,125.
Which train stations are available in or near Lascelles?
Some of the train stations available in or near Lascelles are Darlington, North Road and Dinsdale.
Property Price Paid in Lascelles by Year
The average sold property price by year was:
| Year | Average Sold Price | Price Change |
Sold Properties
|
|---|---|---|---|
| 2026 | £195,000 | 40% |
1 Property |
| 2025 | £117,032 | 13% |
57 Properties |
| 2024 | £101,600 | -1% |
64 Properties |
| 2023 | £102,195 | -12% |
79 Properties |
| 2022 | £114,505 | 13% |
67 Properties |
| 2021 | £99,636 | 8% |
94 Properties |
| 2020 | £91,559 | 8% |
42 Properties |
| 2019 | £84,471 | -11% |
57 Properties |
| 2018 | £93,365 | 4% |
30 Properties |
| 2017 | £89,171 | -9% |
46 Properties |
| 2016 | £97,200 | 17% |
57 Properties |
| 2015 | £80,942 | -15% |
58 Properties |
| 2014 | £93,187 | 7% |
57 Properties |
| 2013 | £86,867 | 18% |
37 Properties |
| 2012 | £71,525 | -18% |
37 Properties |
| 2011 | £84,500 | -31% |
20 Properties |
| 2010 | £110,805 | 2% |
35 Properties |
| 2009 | £108,621 | 9% |
39 Properties |
| 2008 | £98,847 | 5% |
45 Properties |
| 2007 | £94,036 | -20% |
86 Properties |
| 2006 | £113,204 | 10% |
177 Properties |
| 2005 | £101,551 | 22% |
119 Properties |
| 2004 | £79,662 | 35% |
78 Properties |
| 2003 | £51,985 | 10% |
115 Properties |
| 2002 | £46,546 | 1% |
89 Properties |
| 2001 | £45,852 | 22% |
110 Properties |
| 2000 | £35,937 | -3% |
75 Properties |
| 1999 | £36,988 | 3% |
67 Properties |
| 1998 | £35,846 | 7% |
55 Properties |
| 1997 | £33,159 | -1% |
51 Properties |
| 1996 | £33,642 | 0,3% |
41 Properties |
| 1995 | £33,535 | - |
32 Properties |
Property Price per Property Type in Lascelles
Here you can find historic sold price data in order to help with your property search.
The average Property Paid Price for specific property types in the last three years are:
| Property Type | Average Sold Price | Sold Properties |
|---|---|---|
| Semi Detached House | £128,884.00 | 71 Semi Detached Houses |
| Detached House | £210,277.00 | 9 Detached Houses |
| Terraced House | £87,352.00 | 109 Terraced Houses |
| Flat | £73,083.00 | 12 Flats |