
Houses for sale & to rent in College, Darlington
House Prices in College
Properties in College have an average house price of £251k and had 249 Property Transactions within the last 3 years¹.
College is an area in Darlington, Darlington with 1,845 households², where the most expensive property was sold for £650k.
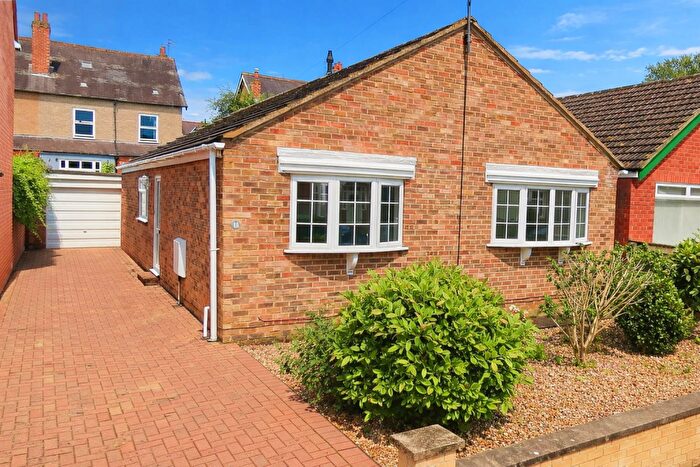
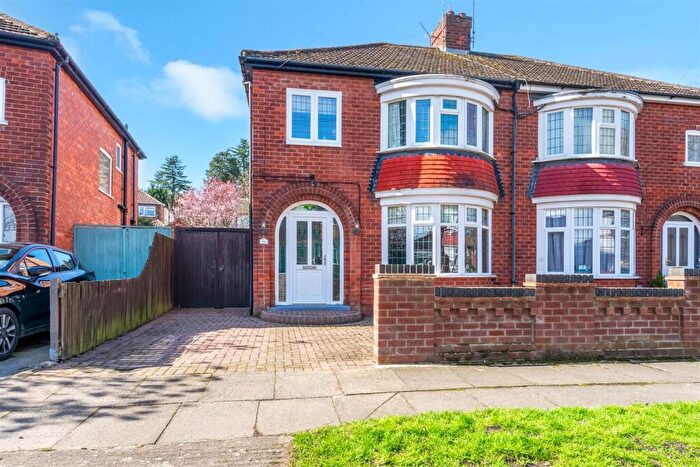
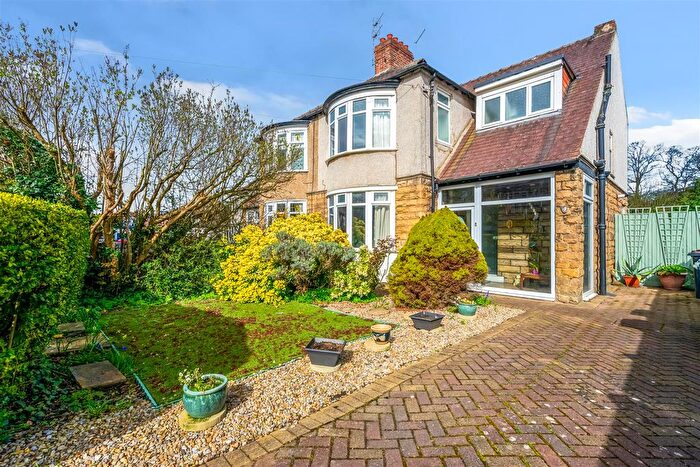
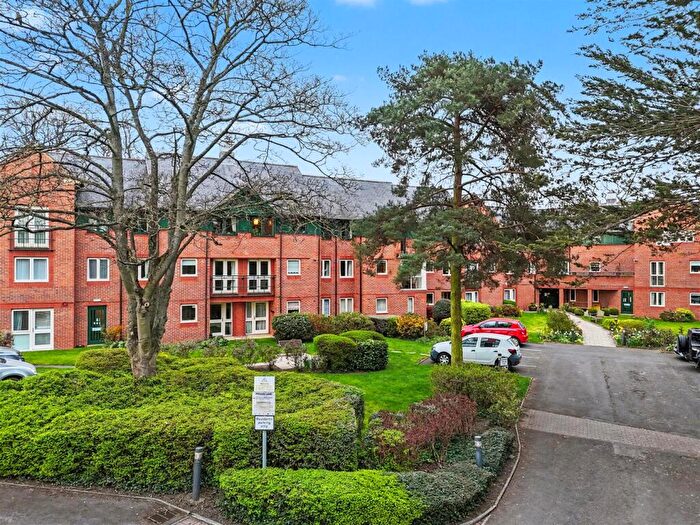
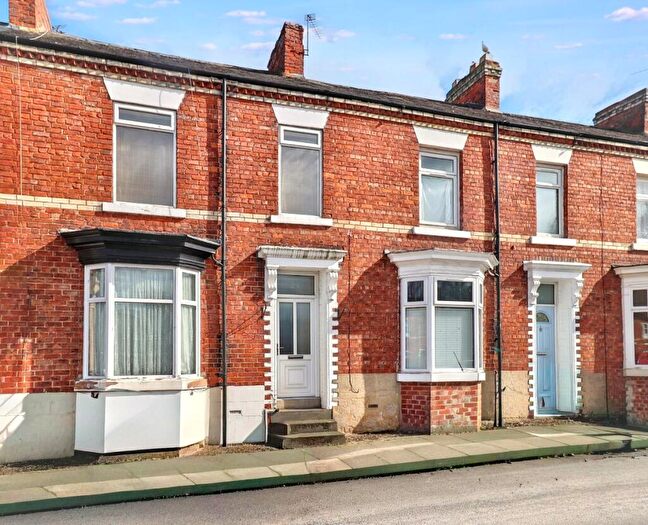
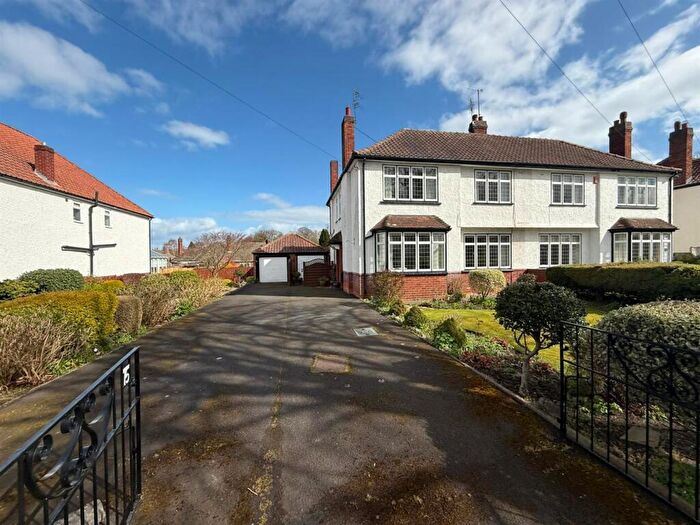
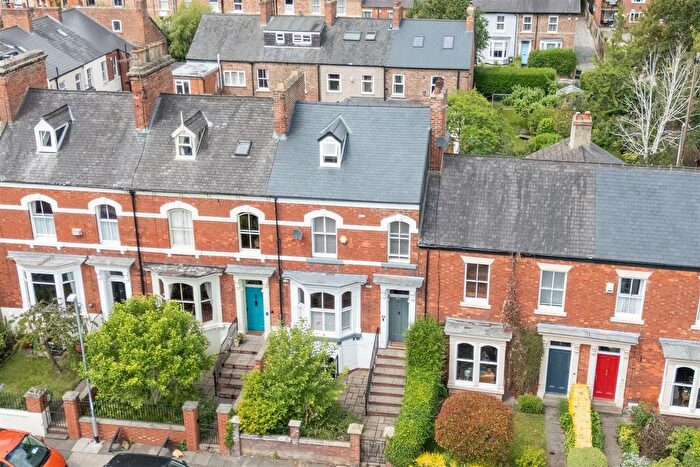
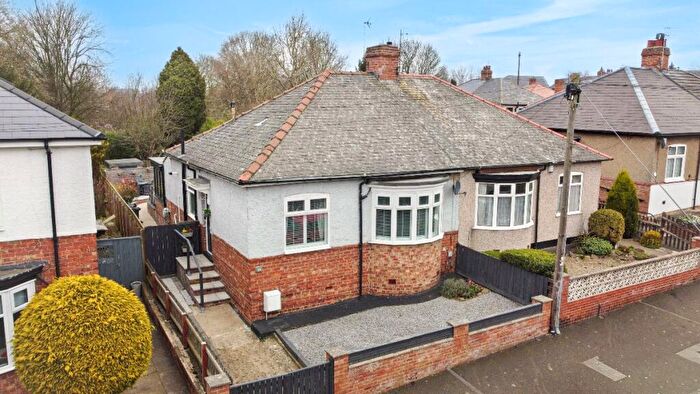
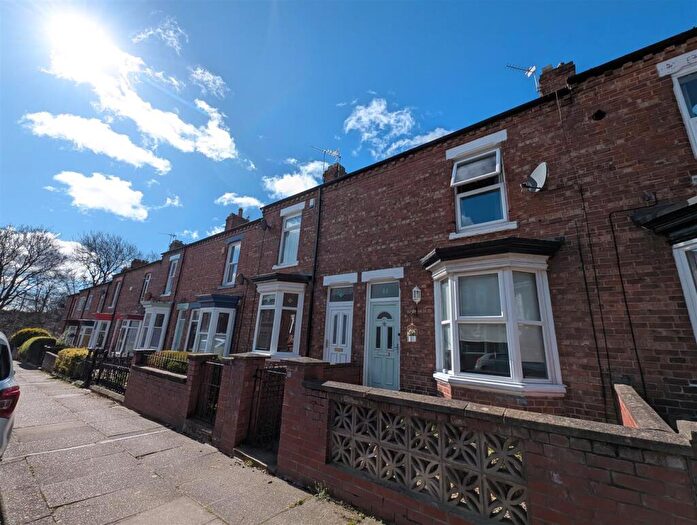
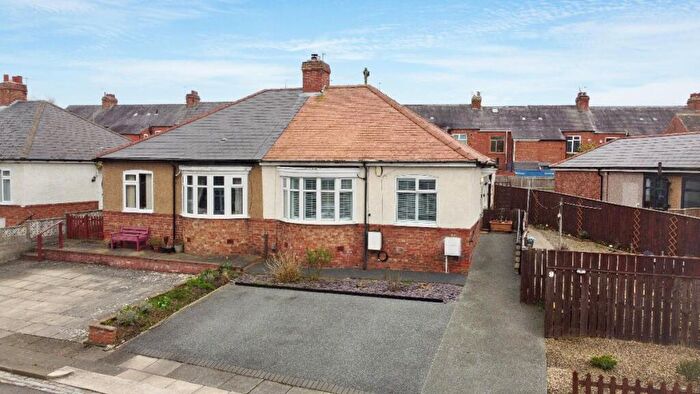
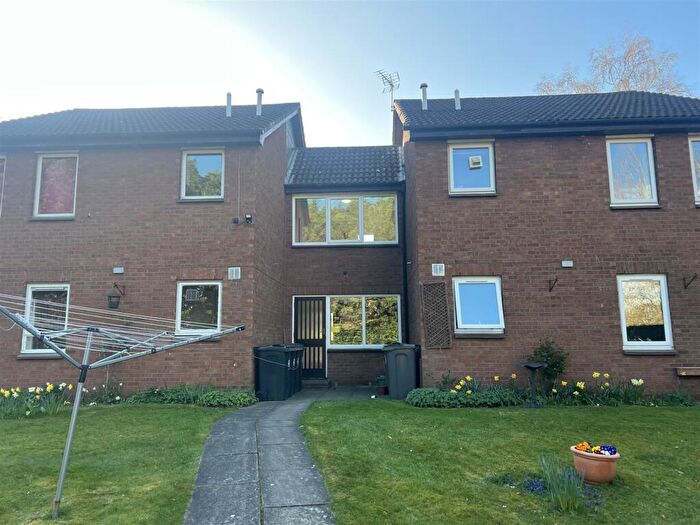
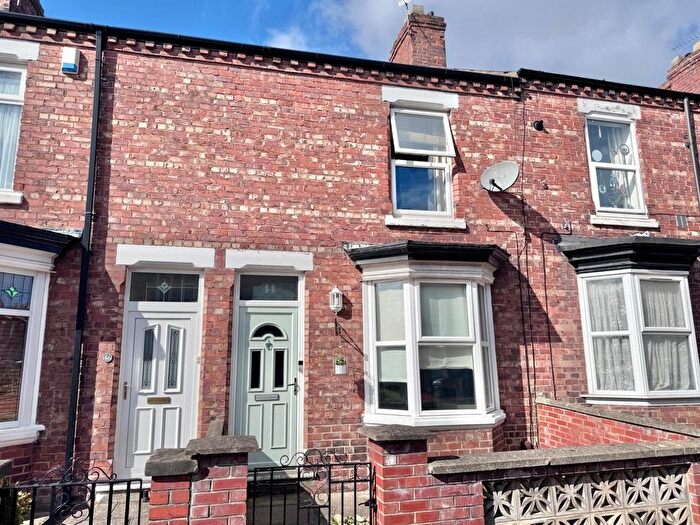
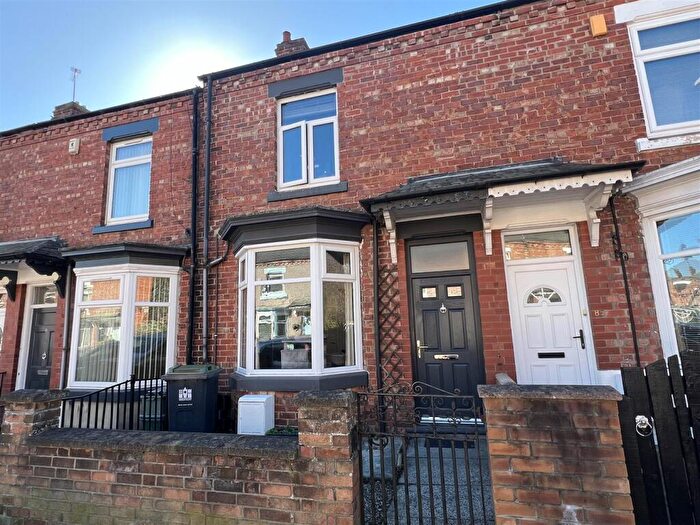
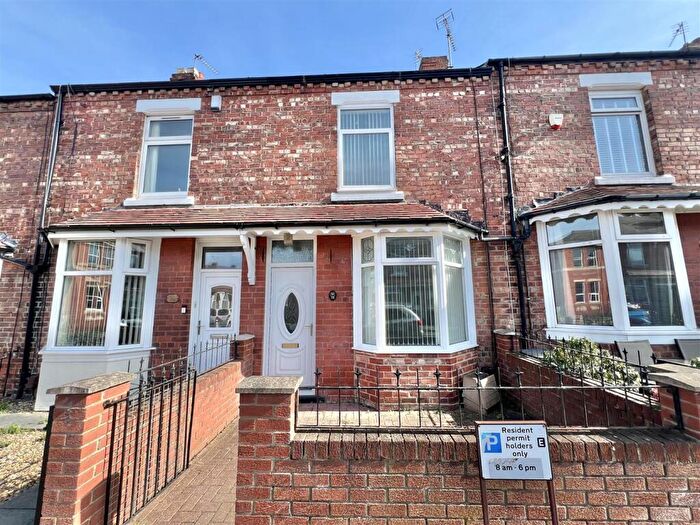
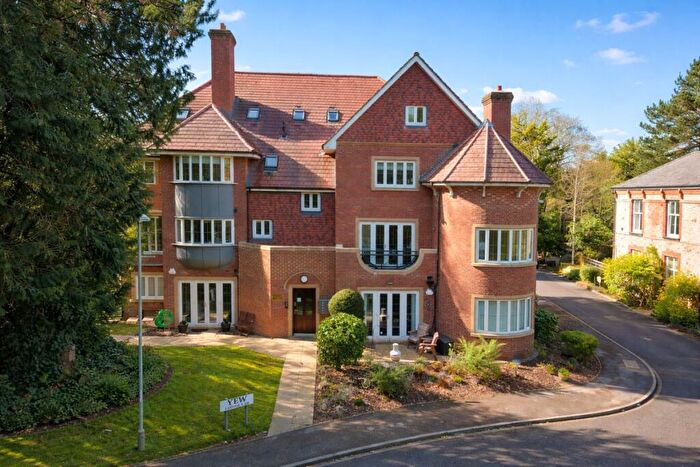
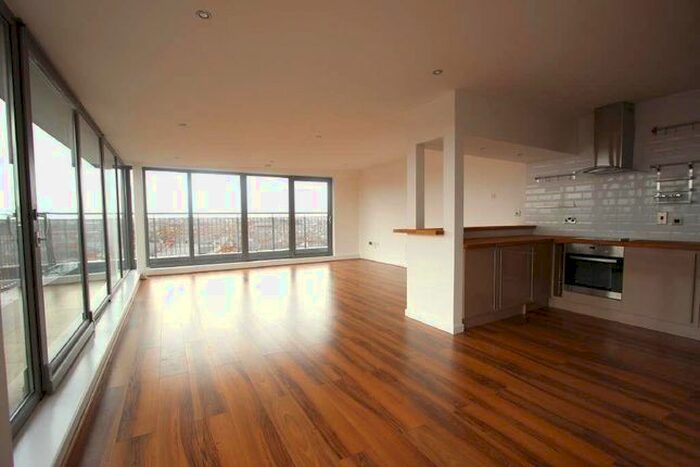
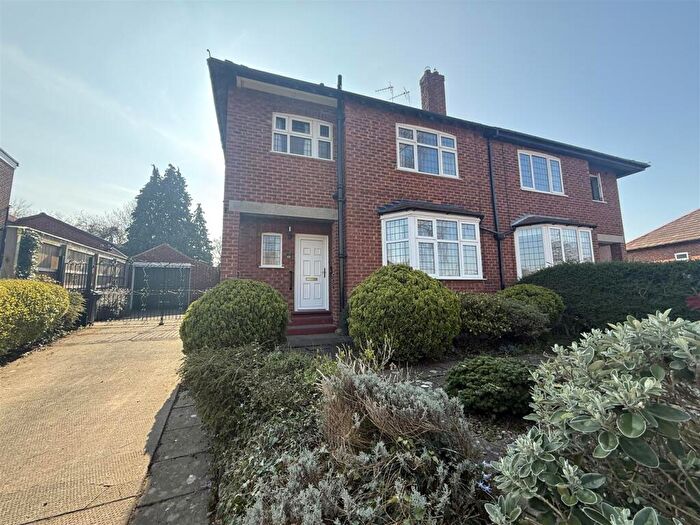
Properties for sale in College
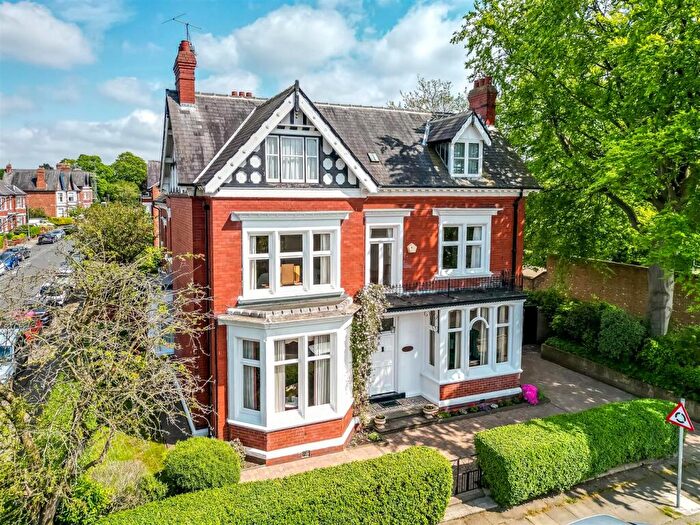
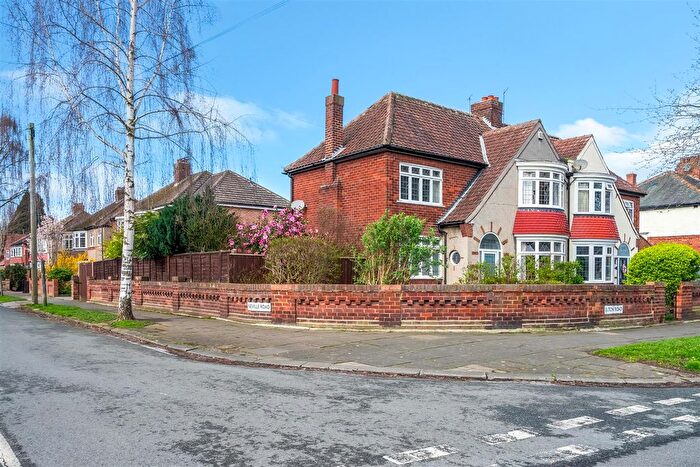
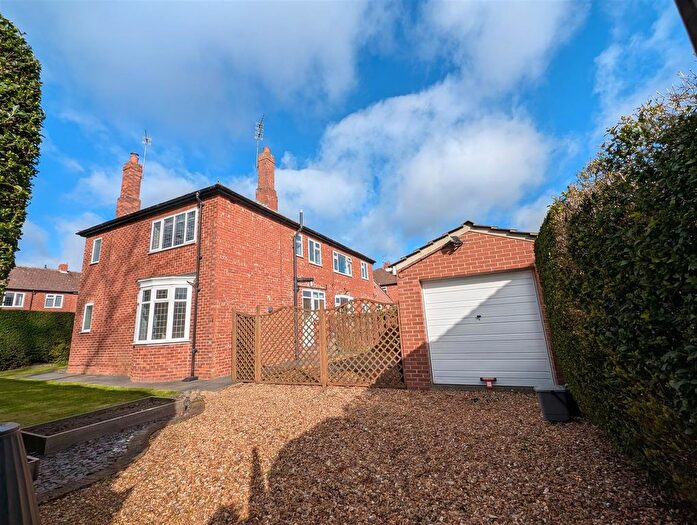
![]()
If you are looking to sell your house, let it out, or receive a property valuation, an expert can help you.
Click the button below to get started.
Roads and Postcodes in College
Navigate through our locations to find the location of your next house in College, Darlington for sale or to rent.
| Streets | Postcodes |
|---|---|
| Abbey Road | DL3 7RA DL3 7RD DL3 8LR DL3 8LT DL3 8ND DL3 8NN |
| Aveley Mews | DL3 9NZ |
| Barlow Street | DL3 9NX |
| Boyes Hill Grove | DL3 9NS |
| Breck Road | DL3 8NH |
| Burleigh Place | DL3 7SR |
| Carmel Road North | DL3 8RH DL3 9TB DL3 9TD DL3 9TG DL3 8JB |
| Claremont Villas | DL3 7AW |
| Clareville Road | DL3 8NG |
| Cleveland Avenue | DL3 7BA DL3 7BD DL3 7BE DL3 7HF DL3 7HG |
| Cleveland Terrace | DL3 7HA DL3 8HR |
| College Court | DL3 7EB |
| Coniscliffe Road | DL3 7RN |
| Dale Road | DL3 8LX DL3 8LZ |
| Danesmoor Crescent | DL3 8NJ |
| Elton Grove | DL3 8HP |
| Elton Road | DL3 8HS DL3 8HU DL3 8LU DL3 8NA DL3 8NB |
| Fife Cove | DL3 7HH |
| Fife Road | DL3 7SY DL3 7TA |
| Glaisdale Court | DL3 7AD DL3 7AE |
| Heatherwood Grove | DL3 9PH DL3 9PL DL3 9PQ |
| Highbury Road | DL3 9NF |
| Langholm Crescent | DL3 7ST DL3 7SU DL3 7SX |
| Leconfield | DL3 8HL |
| Mayfield | DL3 7TU |
| Milbank Court | DL3 9PF |
| Milbank Crescent | DL3 8LY |
| Milbank Road | DL3 9NH DL3 9NJ DL3 9NL DL3 9NN DL3 9NP DL3 9NR DL3 9NW |
| Neville Road | DL3 8HY DL3 8HZ DL3 8NE DL3 8NF DL3 8NL DL3 8NQ |
| Pierremont Crescent | DL3 9PA DL3 9PB |
| Pierremont Gardens | DL3 9PD DL3 9PE |
| Scholars Park | DL3 7FD DL3 7FE DL3 7FF |
| Spruce Grove | DL3 8NW |
| St Cuthberts Place | DL3 7UX |
| Stanhope Road North | DL3 7AR |
| Stanhope Road South | DL3 7GA DL3 7SJ DL3 7SQ |
| Stonedale Crescent | DL3 7BG |
| Swinburne Road | DL3 7TB DL3 7TD |
| The Hawthorns | DL3 9PJ |
| The Woodlands | DL3 9UB |
| Thornbury Rise | DL3 9NE DL3 9NG |
| Thornfield Road | DL3 9TQ |
| Trinity Mews | DL3 7XB |
| Trinity Road | DL3 7AS DL3 7AZ DL3 7UU DL3 7BF DL3 7EA |
| Uplands Road | DL3 7SL DL3 7SP DL3 7SZ |
| Vane Terrace | DL3 7AT DL3 7RB DL3 7AL DL3 7AU |
| Westbourne Grove | DL3 8HT DL3 8LS |
| Woodland Road | DL3 7BQ DL3 7UA DL3 9ND DL3 9NQ |
| Woodland Road South Back | DL3 7BL |
| Woodland Terrace | DL3 9NT DL3 9NU |
Transport near College

- FAQ
- Price Paid By Year
- Property Type Price
Frequently asked questions about College
What is the average price for a property for sale in College?
The average price for a property for sale in College is £250,570. This amount is 53% higher than the average price in Darlington. There are 1,269 property listings for sale in College.
What streets have the most expensive properties for sale in College?
The streets with the most expensive properties for sale in College are Westbourne Grove at an average of £431,666, Abbey Road at an average of £407,500 and Cleveland Avenue at an average of £397,916.
What streets have the most affordable properties for sale in College?
The streets with the most affordable properties for sale in College are St Cuthberts Place at an average of £84,200, Stanhope Road South at an average of £122,071 and Claremont Villas at an average of £130,300.
Which train stations are available in or near College?
Some of the train stations available in or near College are North Road, Darlington and Dinsdale.
Property Price Paid in College by Year
The average sold property price by year was:
| Year | Average Sold Price | Price Change |
Sold Properties
|
|---|---|---|---|
| 2026 | £140,250 | -76% |
2 Properties |
| 2025 | £247,423 | 1% |
79 Properties |
| 2024 | £245,382 | -7% |
85 Properties |
| 2023 | £261,538 | 5% |
83 Properties |
| 2022 | £249,055 | 8% |
109 Properties |
| 2021 | £228,014 | -1% |
129 Properties |
| 2020 | £230,755 | 9% |
90 Properties |
| 2019 | £210,915 | -6% |
113 Properties |
| 2018 | £223,119 | -1% |
79 Properties |
| 2017 | £226,180 | -7% |
125 Properties |
| 2016 | £243,135 | 10% |
87 Properties |
| 2015 | £220,025 | 1% |
89 Properties |
| 2014 | £217,365 | -4% |
80 Properties |
| 2013 | £226,401 | -1% |
84 Properties |
| 2012 | £228,212 | 9% |
78 Properties |
| 2011 | £207,316 | 1% |
82 Properties |
| 2010 | £204,495 | -3% |
81 Properties |
| 2009 | £211,408 | -14% |
70 Properties |
| 2008 | £242,031 | 4% |
60 Properties |
| 2007 | £232,085 | 11% |
124 Properties |
| 2006 | £207,528 | -3% |
128 Properties |
| 2005 | £214,366 | 15% |
90 Properties |
| 2004 | £182,955 | 17% |
127 Properties |
| 2003 | £151,176 | 10% |
117 Properties |
| 2002 | £136,532 | 16% |
119 Properties |
| 2001 | £114,890 | 6% |
140 Properties |
| 2000 | £107,574 | 8% |
108 Properties |
| 1999 | £98,467 | -2% |
102 Properties |
| 1998 | £100,172 | 21% |
91 Properties |
| 1997 | £78,907 | 4% |
102 Properties |
| 1996 | £76,112 | -5% |
88 Properties |
| 1995 | £80,146 | - |
49 Properties |
Property Price per Property Type in College
Here you can find historic sold price data in order to help with your property search.
The average Property Paid Price for specific property types in the last three years are:
| Property Type | Average Sold Price | Sold Properties |
|---|---|---|
| Semi Detached House | £281,175.00 | 74 Semi Detached Houses |
| Detached House | £390,539.00 | 24 Detached Houses |
| Terraced House | £303,014.00 | 69 Terraced Houses |
| Flat | £137,856.00 | 82 Flats |