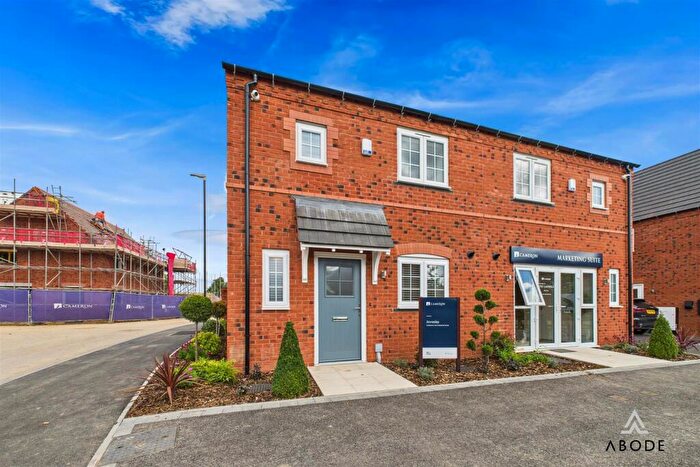
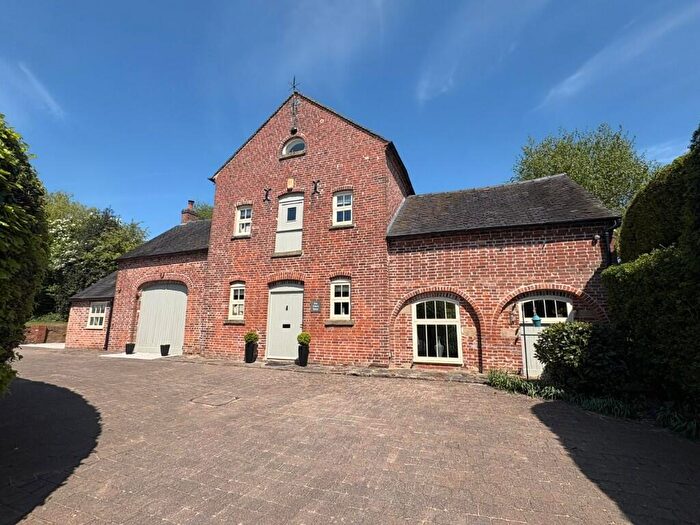
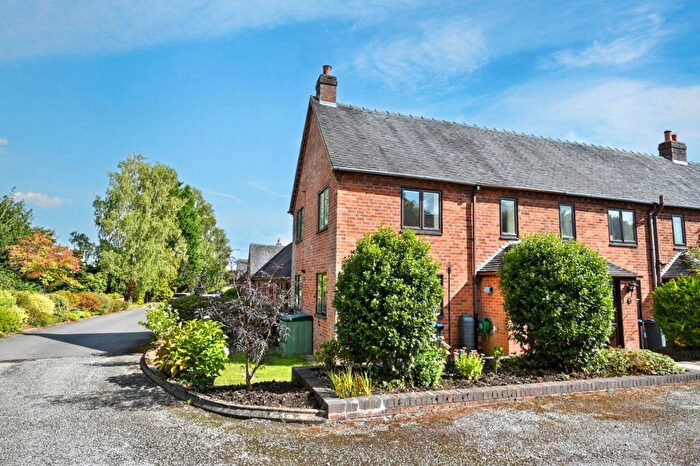
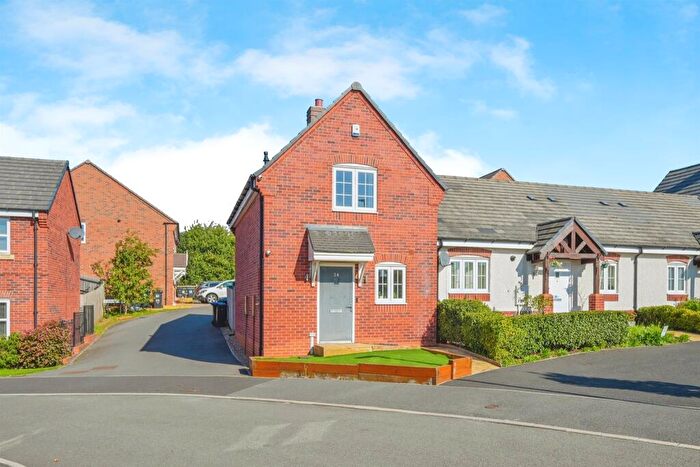
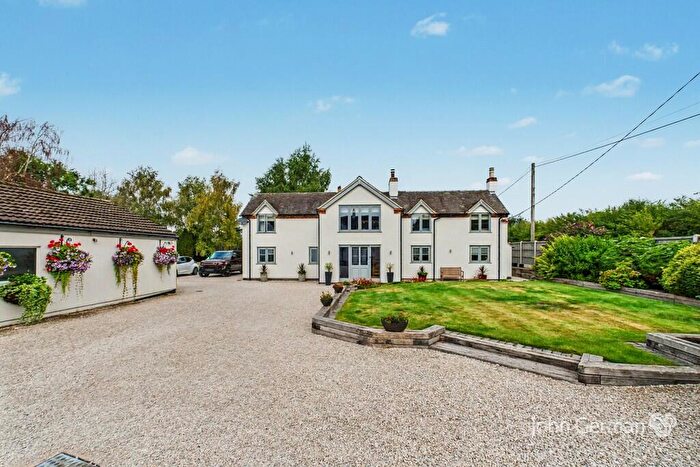
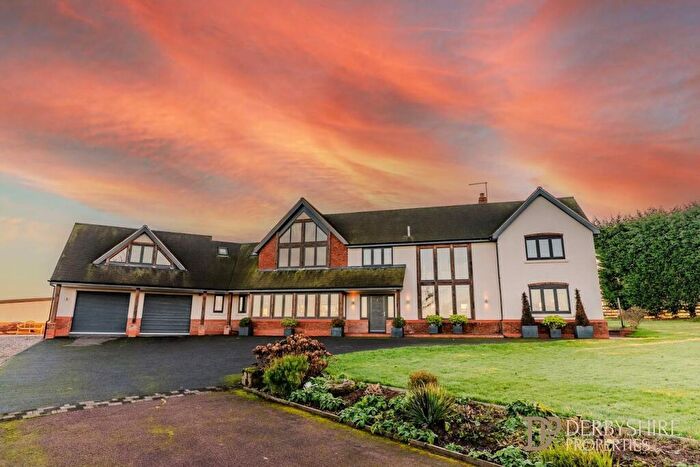
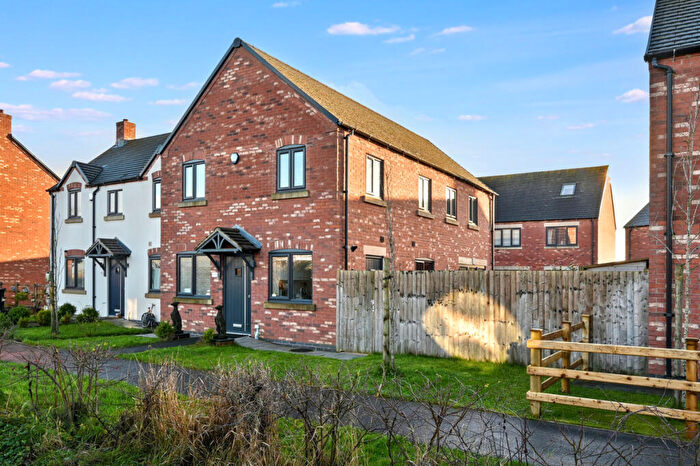
Houses for sale & to rent in Brailsford, Ashbourne
House Prices in Brailsford
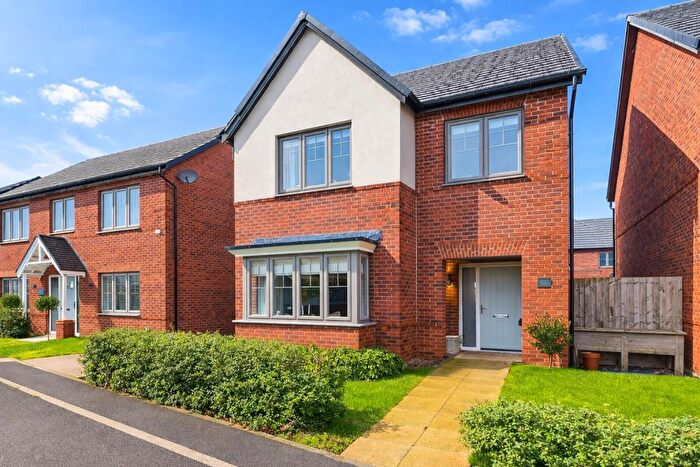
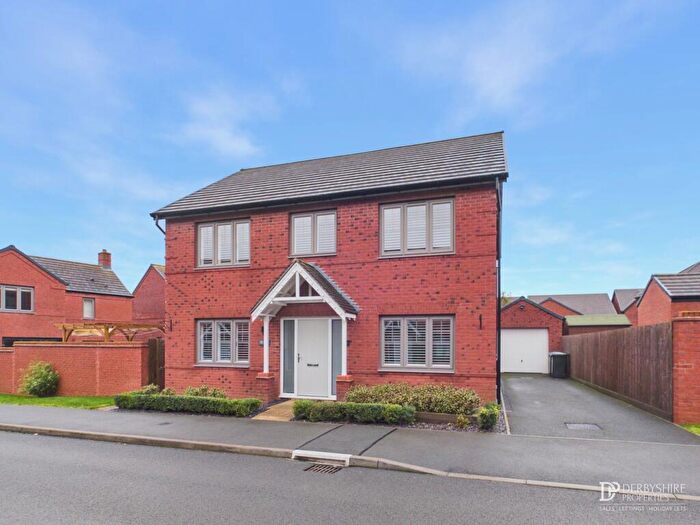
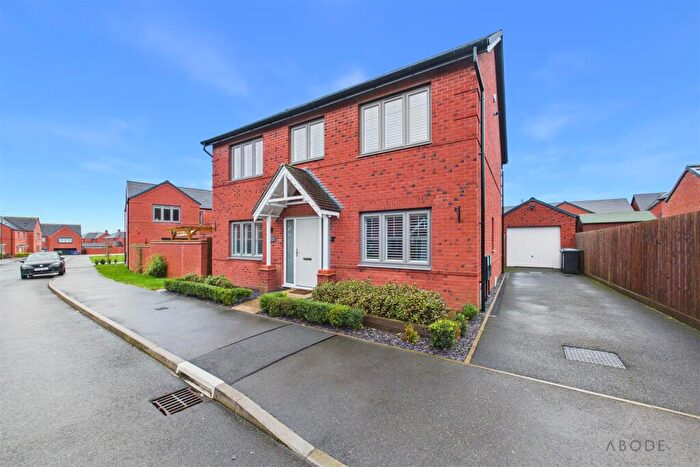
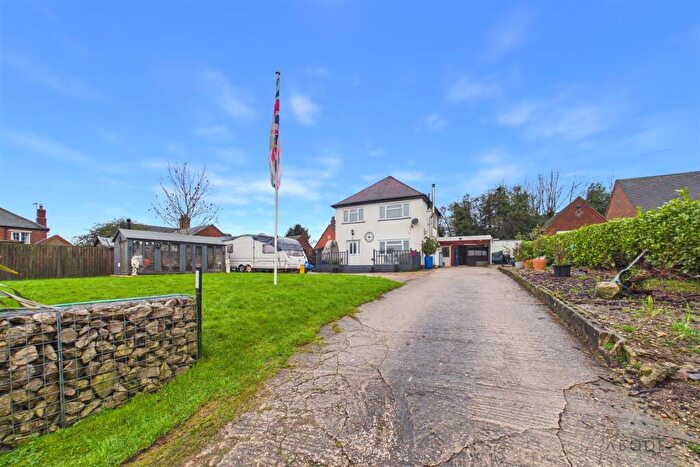
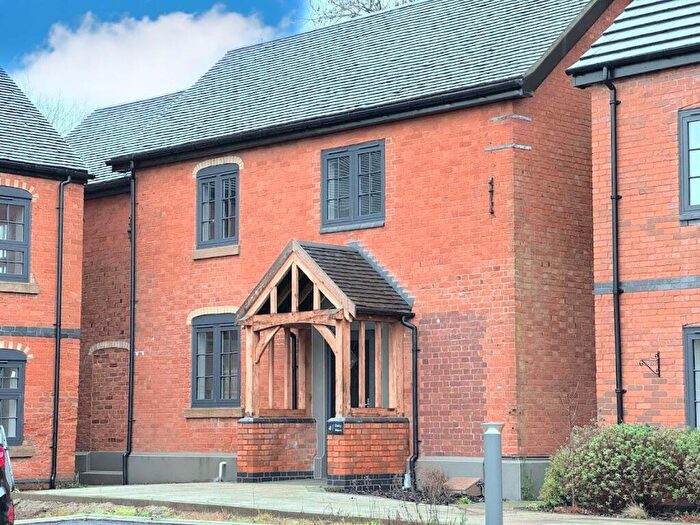
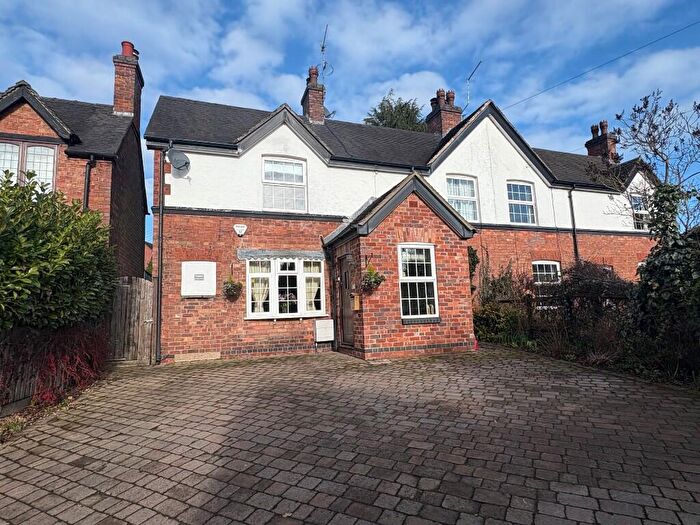
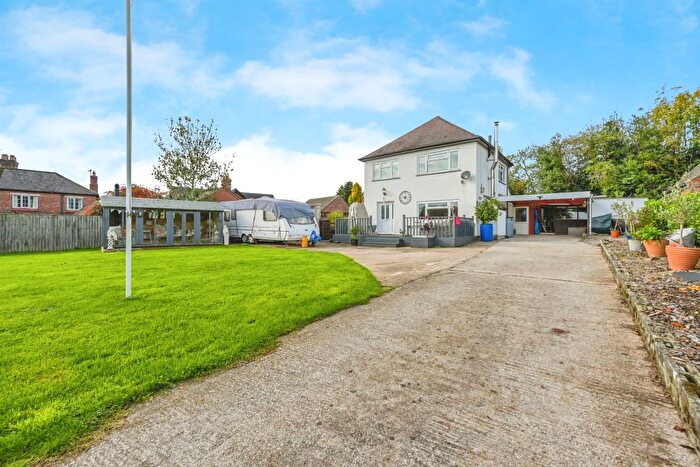
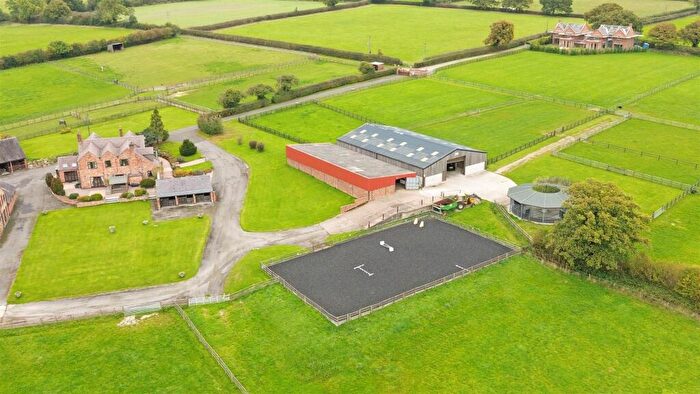
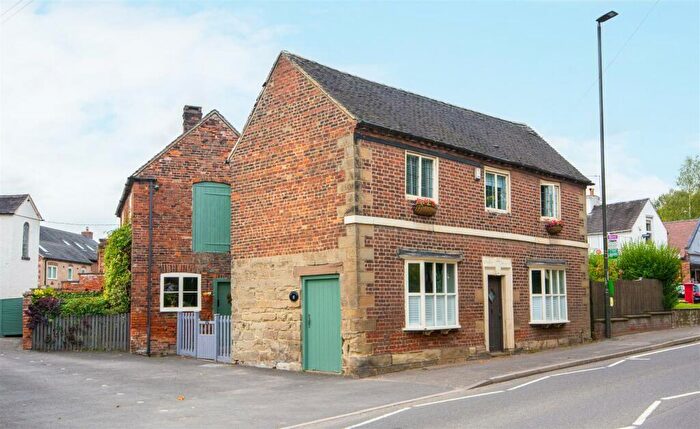
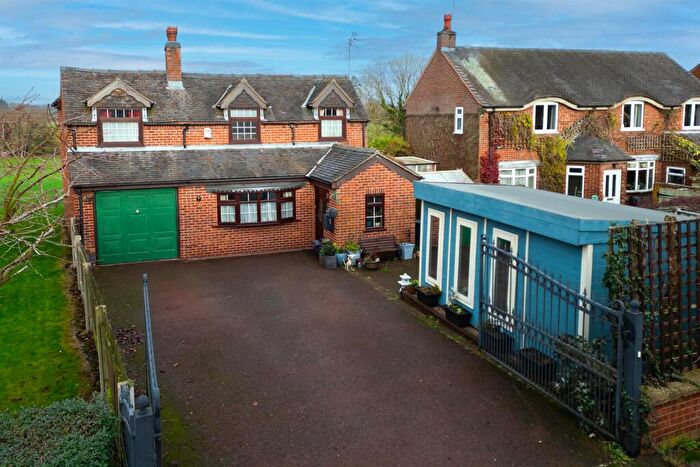
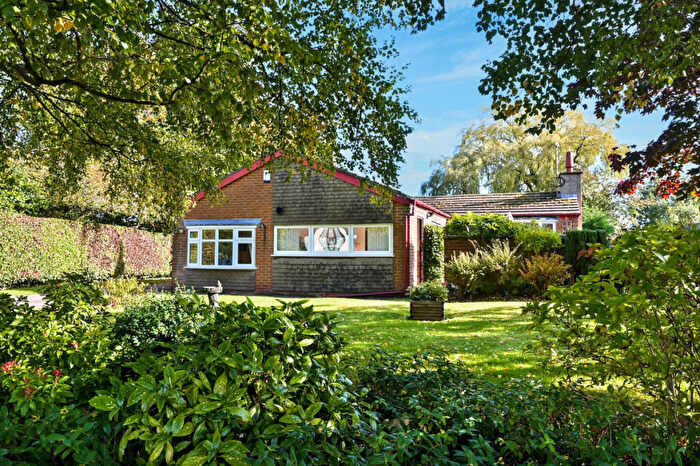
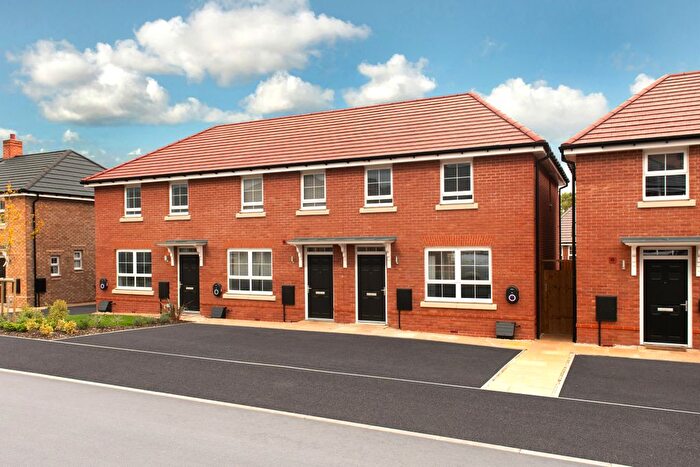
Properties in Brailsford have an average house price of £470,098.00 and had 81 Property Transactions within the last 3 years¹.
Brailsford is an area in Ashbourne, Derbyshire with 701 households², where the most expensive property was sold for £2,800,000.00.
Properties for sale in Brailsford
Roads and Postcodes in Brailsford
Navigate through our locations to find the location of your next house in Brailsford, Ashbourne for sale or to rent.
| Streets | Postcodes |
|---|---|
| Alder Lane | DE6 3GR DE6 3HD |
| Blackthorn Close | DE6 3GW |
| Broomy Drive | DE6 3GP |
| Burrows Lane | DE6 3BU |
| Church Lane | DE6 3BX |
| Corner Farm | DE6 3BQ |
| Dairy Mews | DE6 3FG |
| Ednaston | DE6 3AB DE6 3AU DE6 3AD |
| Elfin Close | DE6 3GU |
| George Rodgers Close | DE6 3GY |
| Hoargate Lane | DE6 3AG |
| Laitier Terrace | DE6 3HB |
| Longford Lane | DE6 3DT DE6 5JB |
| Luke Lane | DE6 3BY |
| Main Road | DE6 3DA |
| Main Street | DE6 3HA |
| Mill Lane | DE6 3BB |
| North Lane | DE6 3BE |
| Painters Lane | DE6 3FA |
| Park Lane | DE6 3AJ |
| Post Office Lane | DE6 3BT |
| Rodsley Lane | DE6 3DD |
| Rowleston Close | DE6 3GJ |
| Saracens Court | DE6 3DX |
| School Rise | DE6 3GN |
| Slade Lane | DE6 3DZ |
| Sundial Close | DE6 3DP |
| Sundial Walk | DE6 3DQ |
| Sycamore Way | DE6 3GX |
| The Bridge | DE6 3AX |
| The Plain | DE6 3BR DE6 3BZ |
| The Spinney | DE6 3BS |
| Thorntree Road | DE6 3GH |
| Throstle Nest Way | DE6 3DB |
| Thurvaston Lane | DE6 3DU |
| Wallef Road | DE6 3GT |
| Wild Park Lane | DE6 3BN |
| Wood Lane | DE6 3GL |
| DE6 3AE DE6 3AF DE6 3AH DE6 3BA DE6 3BG DE6 3BH DE6 3BL DE6 3BW DE6 3DE DE6 3DR DE6 3GA DE6 3GB DE6 3GD DE6 3AA DE6 3AY DE6 3BD DE6 3BP DE6 3DS DE6 3GG DE6 3GS |
Transport near Brailsford
-
Duffield Station
-
Tutbury and Hatton Station
-
Belper Station
-
Derby Station
-
Willington Station
-
Peartree Station
-
Ambergate Station
-
Whatstandwell Station
- FAQ
- Price Paid By Year
- Property Type Price
Frequently asked questions about Brailsford
What is the average price for a property for sale in Brailsford?
The average price for a property for sale in Brailsford is £470,098. This amount is 21% higher than the average price in Ashbourne. There are 478 property listings for sale in Brailsford.
What streets have the most expensive properties for sale in Brailsford?
The streets with the most expensive properties for sale in Brailsford are Park Lane at an average of £1,675,000, North Lane at an average of £1,480,000 and Mill Lane at an average of £1,059,000.
What streets have the most affordable properties for sale in Brailsford?
The streets with the most affordable properties for sale in Brailsford are George Rodgers Close at an average of £187,500, Main Road at an average of £209,000 and Main Street at an average of £210,333.
Which train stations are available in or near Brailsford?
Some of the train stations available in or near Brailsford are Duffield, Tutbury and Hatton and Belper.
Property Price Paid in Brailsford by Year
The average sold property price by year was:
| Year | Average Sold Price | Price Change |
Sold Properties
|
|---|---|---|---|
| 2025 | £521,048 | 28% |
31 Properties |
| 2024 | £377,730 | -34% |
26 Properties |
| 2023 | £504,354 | 12% |
24 Properties |
| 2022 | £441,981 | 9% |
67 Properties |
| 2021 | £401,447 | 12% |
67 Properties |
| 2020 | £353,046 | 4% |
76 Properties |
| 2019 | £338,202 | 6% |
29 Properties |
| 2018 | £317,957 | -23% |
48 Properties |
| 2017 | £390,412 | 8% |
40 Properties |
| 2016 | £359,058 | -5% |
43 Properties |
| 2015 | £378,093 | 3% |
16 Properties |
| 2014 | £366,094 | 11% |
25 Properties |
| 2013 | £324,523 | 3% |
17 Properties |
| 2012 | £314,915 | -8% |
6 Properties |
| 2011 | £338,559 | 1% |
15 Properties |
| 2010 | £336,688 | -16% |
26 Properties |
| 2009 | £391,416 | 10% |
18 Properties |
| 2008 | £350,745 | 5% |
12 Properties |
| 2007 | £332,115 | 7% |
26 Properties |
| 2006 | £309,479 | 3% |
32 Properties |
| 2005 | £298,968 | -0,1% |
19 Properties |
| 2004 | £299,261 | 7% |
28 Properties |
| 2003 | £279,515 | 31% |
33 Properties |
| 2002 | £194,136 | 25% |
43 Properties |
| 2001 | £144,965 | -46% |
30 Properties |
| 2000 | £210,990 | 25% |
21 Properties |
| 1999 | £158,719 | 9% |
18 Properties |
| 1998 | £145,097 | 0,4% |
23 Properties |
| 1997 | £144,519 | 22% |
23 Properties |
| 1996 | £112,546 | 16% |
30 Properties |
| 1995 | £94,873 | - |
36 Properties |
Property Price per Property Type in Brailsford
Here you can find historic sold price data in order to help with your property search.
The average Property Paid Price for specific property types in the last three years are:
| Property Type | Average Sold Price | Sold Properties |
|---|---|---|
| Semi Detached House | £291,617.00 | 17 Semi Detached Houses |
| Detached House | £561,703.00 | 54 Detached Houses |
| Terraced House | £273,166.00 | 9 Terraced Houses |
| Flat | £330,000.00 | 1 Flat |


