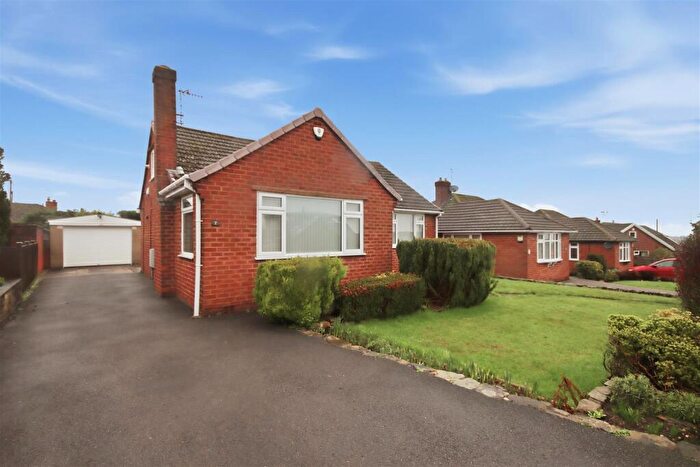
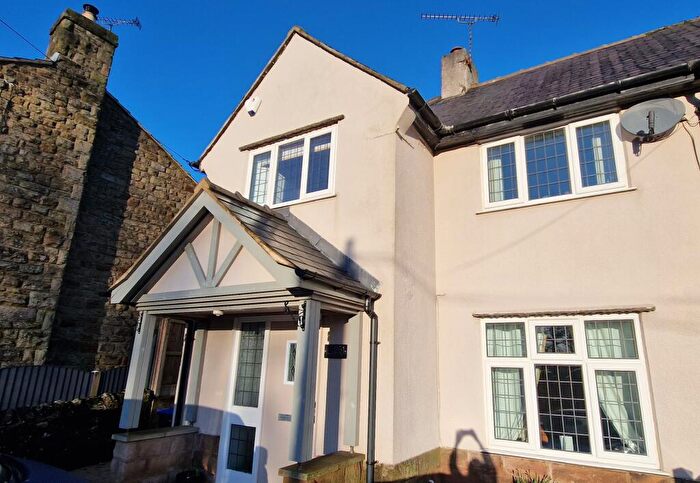
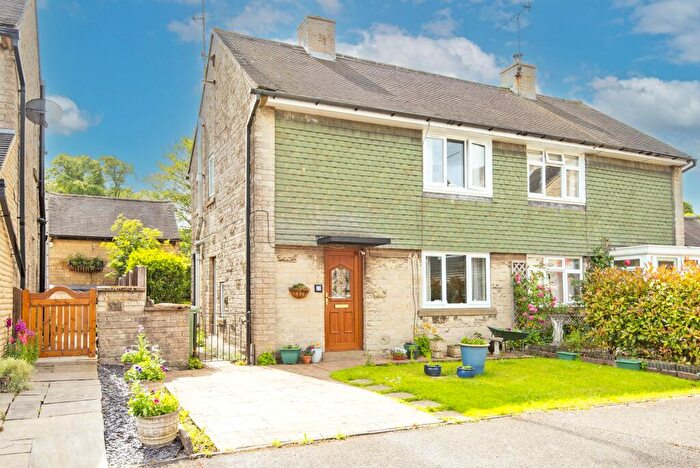
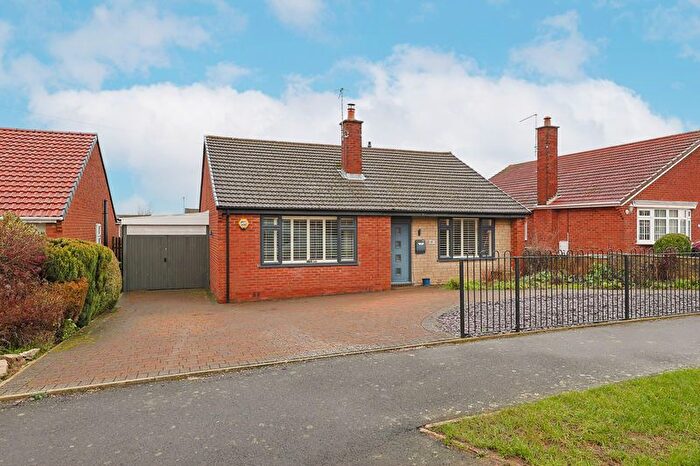
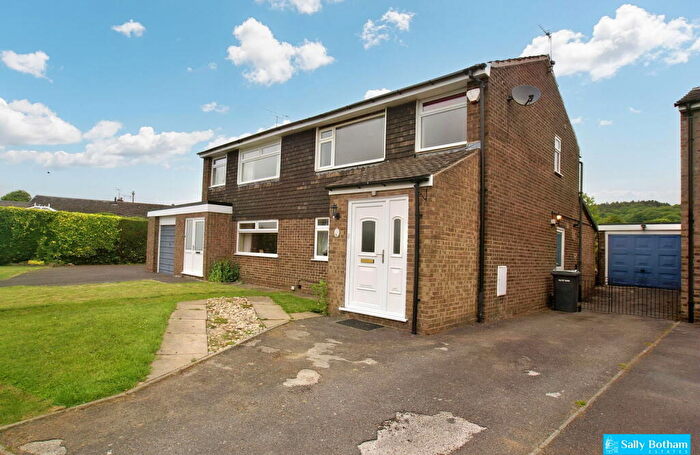
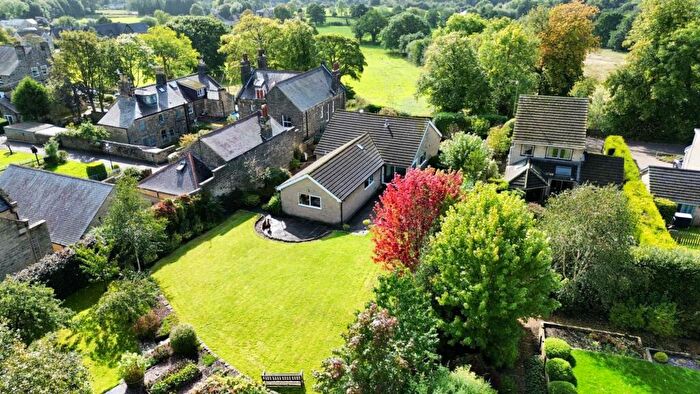
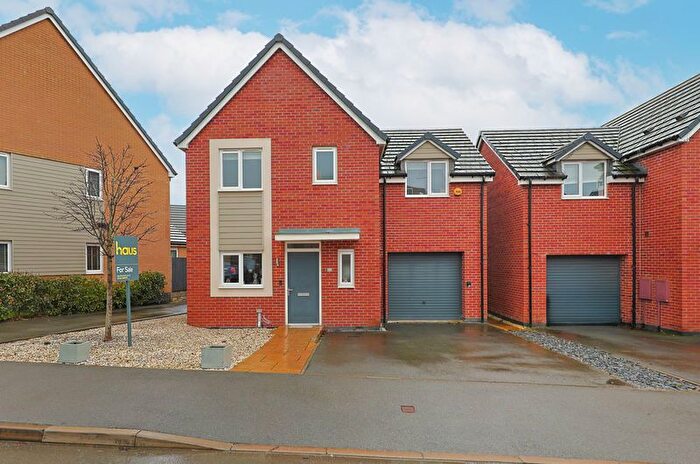
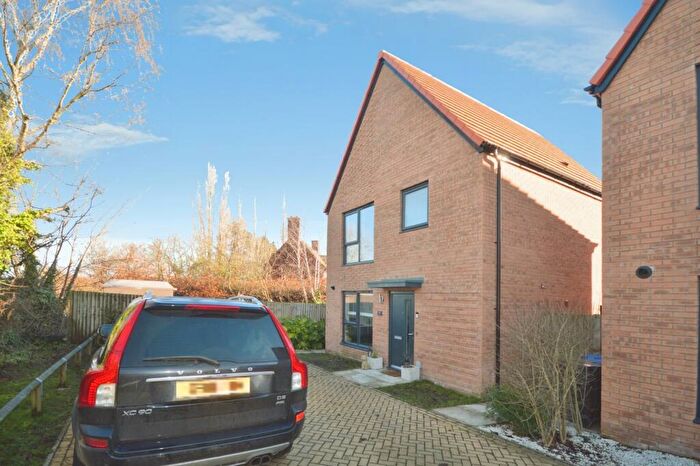
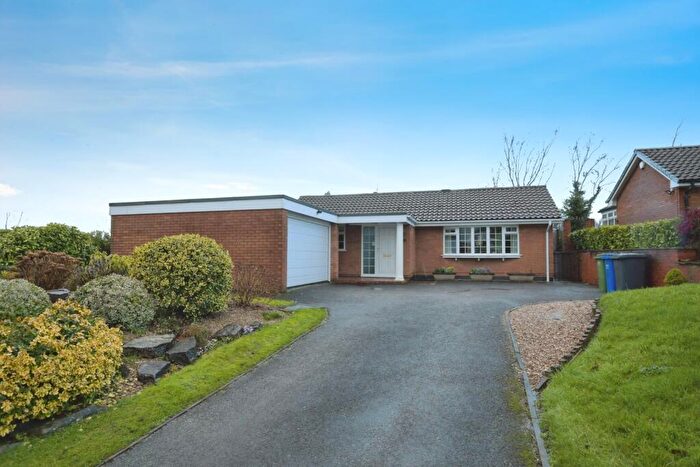
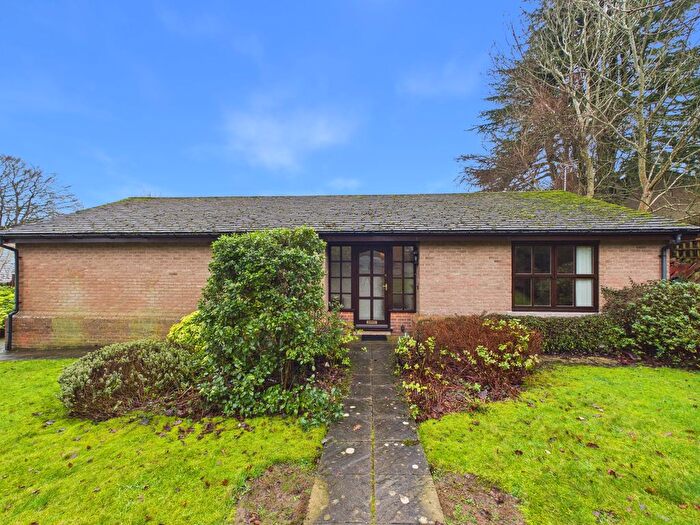
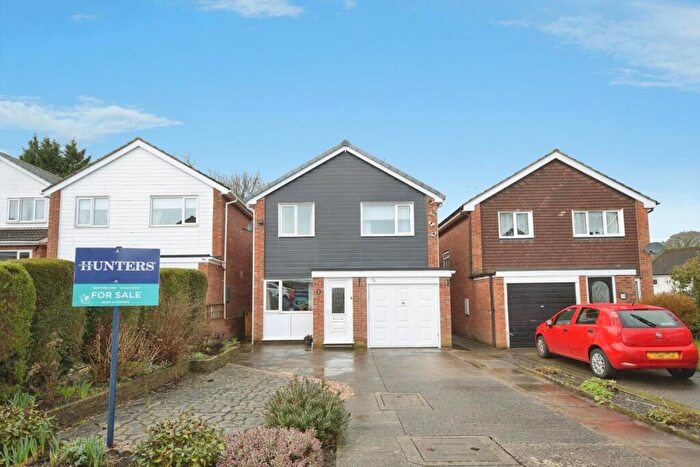
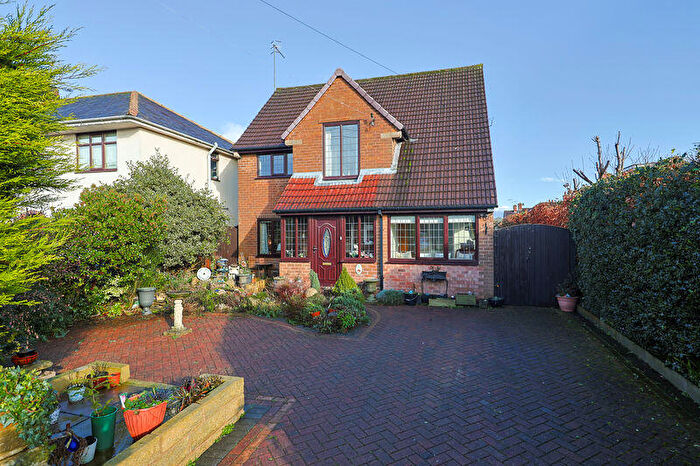
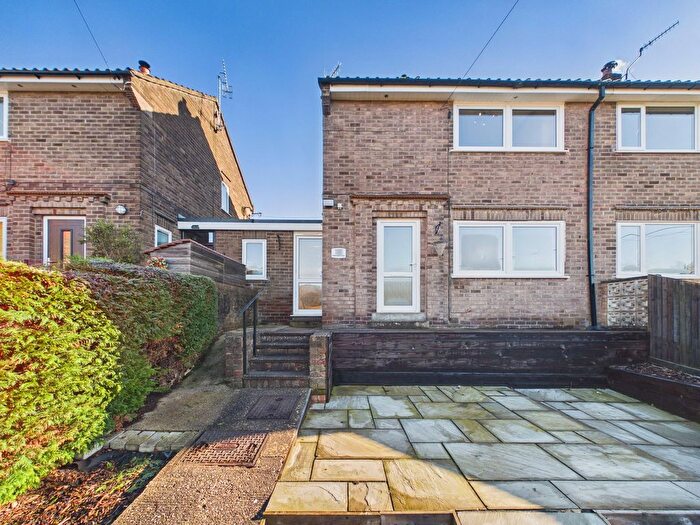
Houses for sale & to rent in Ashover, Chesterfield
House Prices in Ashover
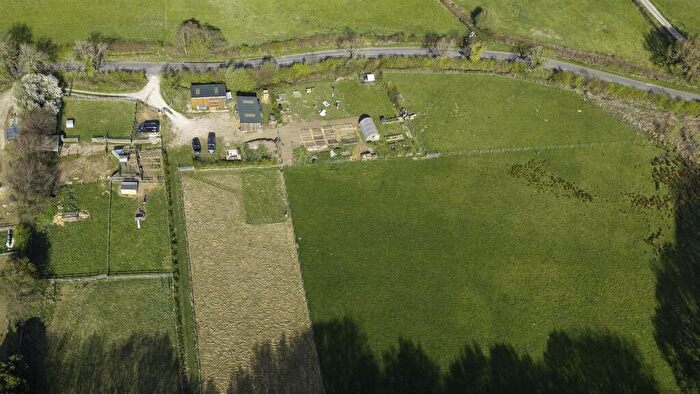
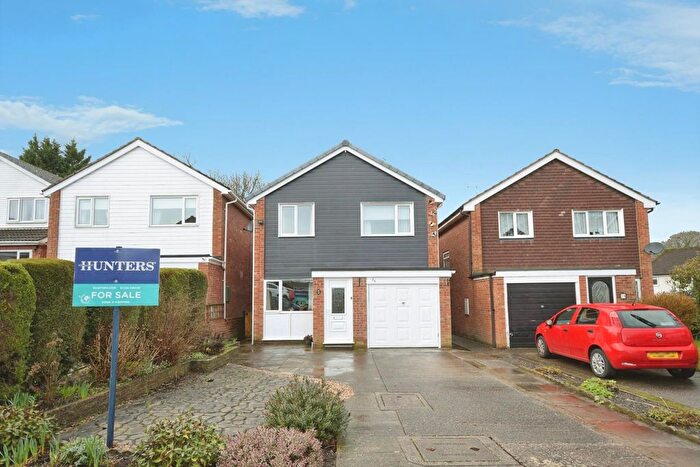
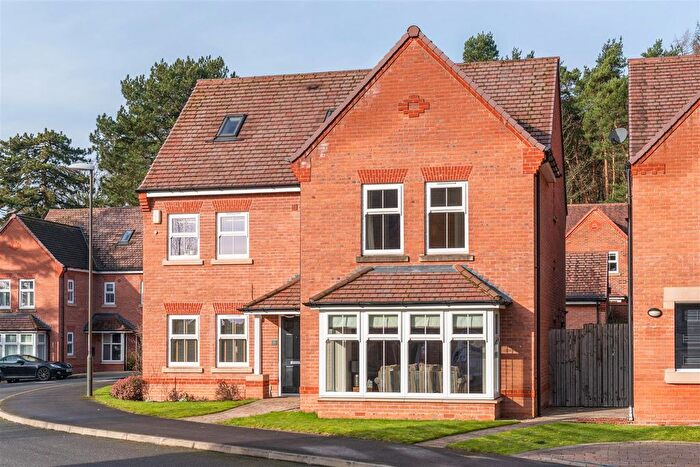
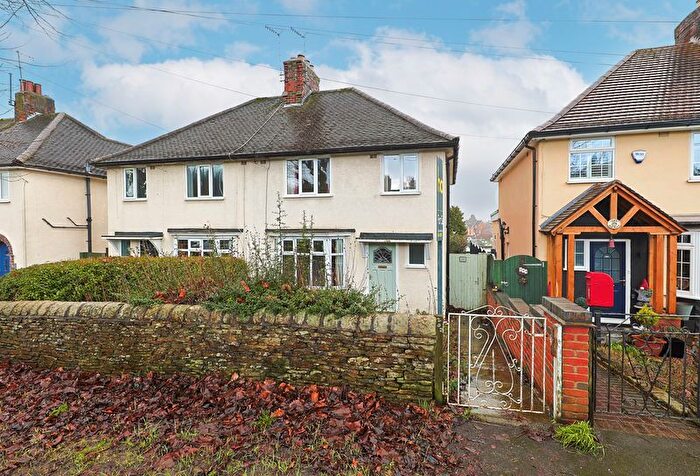
Properties in Ashover have an average house price of £540,695.00 and had 64 Property Transactions within the last 3 years¹.
Ashover is an area in Chesterfield, Derbyshire with 782 households², where the most expensive property was sold for £1,275,000.00.
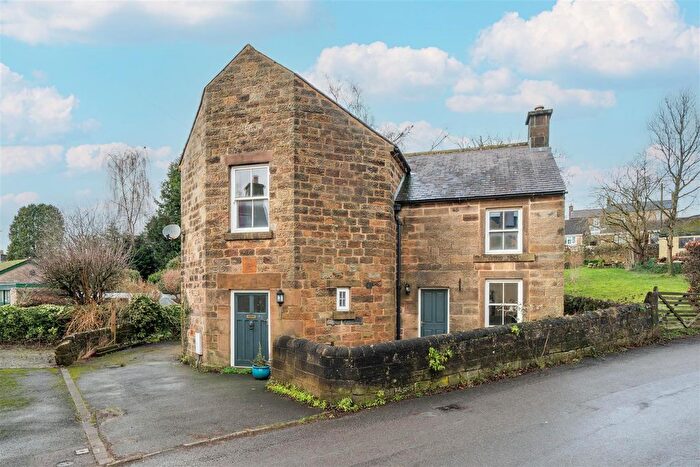
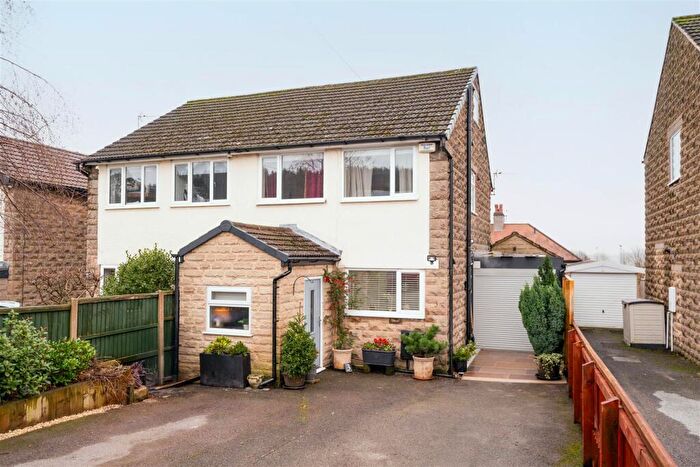
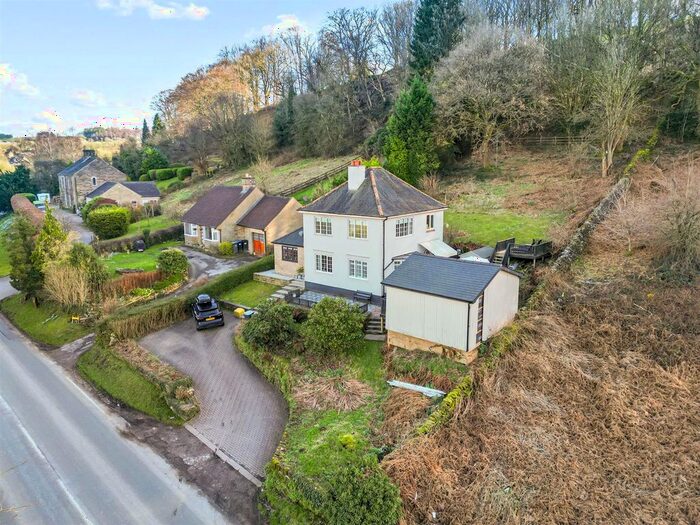
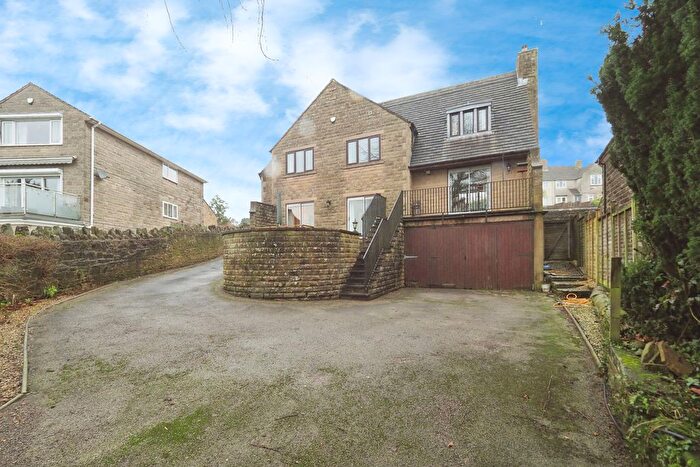
Properties for sale in Ashover
Roads and Postcodes in Ashover
Navigate through our locations to find the location of your next house in Ashover, Chesterfield for sale or to rent.
| Streets | Postcodes |
|---|---|
| Alice Head Road | S45 0DQ |
| Alton Lane | S45 0BE |
| Amber Lane | S45 0DZ |
| Ambervale Flats | S45 0AH |
| Ashover Hay | S45 0HN |
| Ashover Road | S45 0BL S45 0DT S45 0EU S45 0BF S45 0BG |
| Bassett Barn Lane | S42 6AU |
| Bath Lane | S45 0DB S45 0LG |
| Belland Lane | S45 0LN |
| Berridge Lane | S45 0BJ |
| Birkin Lane | S45 0LQ |
| Bolehill Lane | S42 6BA |
| Brown Lane | S45 0HG |
| Brownhill Lane | S42 6AS |
| Buntingfield Lane | S45 0DF |
| Butterley Lane | S45 0JU |
| Butts Road | S45 0AX S45 0AZ S45 0EW S45 0HW |
| Causeway Houses | S45 0DW |
| Chapel Hill | S45 0AP S45 0AS S45 0AT S45 0AN |
| Church Street | S45 0AB |
| Coach Road | S45 0JN S45 0EF S45 0EG |
| Cripton Lane | S45 0AW |
| Cullumbell Lane | S45 0DG S45 0JF S45 0JE |
| Dale Bank | S45 0EX |
| Dark Lane | S45 0HD |
| Darley Road | S45 0LX |
| Dewey Lane | DE55 6DB |
| Dicklant Lane | S45 0ET |
| Doehole Lane | DE55 6ER |
| Dovecotes | S45 0AD |
| Eastwood Lane | S45 0BW |
| Eaton Lane | S45 0HU |
| Fallgate | S45 0EY S45 0FA |
| Gladwins Mark | S45 0LR |
| Greenfield Lane | S45 0HT |
| Gynn Lane | S45 0EZ |
| Hardmeadow Lane | S45 0BD |
| Hardwick Lane | S45 0DE |
| Hay Lane | S45 0HF |
| Highashes Lane | S45 0LH |
| Highoredish | S45 0JX S45 0JY |
| Hill Road | S45 0BX |
| Hill Top Road | S45 0BZ |
| Hillside | S45 0BY |
| Hockley Lane | S45 0ER S45 0ES S45 0EP |
| Hodge Lane | S45 0JB |
| Holestone Gate Road | S45 0JS S45 0JT |
| Jetting Street | S45 0EH S45 0FB |
| Kelstedge Lane | S45 0HP |
| Lickpenny Lane | S45 0JQ |
| Long Lane | S42 6AX |
| Malthouse Lane | S45 0AL S45 0BU |
| Marsh Green Lane | S45 0DR |
| Matlock Road | S45 0DD S45 0DX S45 0DY S45 0LJ S45 0LL |
| Milken Lane | S45 0BA S45 0BB |
| Mill Lane | S45 0HS |
| Moor Road | S45 0AE S45 0AJ S45 0AQ S45 0AG S45 0BN |
| Narrowleys Lane | S45 0AU |
| Nightingale Close | S45 0DN |
| Northedge Lane | S42 6AY S42 6FR |
| Oaks Lane | S45 0HR |
| Oakstedge Lane | S45 0HA |
| Overton | S45 0JR S45 0JW |
| Pear Tree Fold | S45 0DJ |
| Peasunhurst Lane | S45 0DL |
| Press | S42 6AZ |
| Press Lane | S42 6AH S42 6AJ S42 6AL S42 6AN |
| Prestedge | S45 0HY S45 0HX |
| Pudding Bag Lane | S45 0BT |
| Quarry Lane | S42 6AT |
| Robridding | S45 0JA |
| Screetham Lane | S45 0AF |
| Slack | S45 0ED S45 0EB |
| Slack Lane | S45 0EE |
| South View | S45 0DA |
| Stonedge | S45 0LW |
| Stonerows Lane | S45 0HE |
| Stubben Edge Lane | S45 0BH |
| Swinger Lane | S45 0DH |
| The Barley Close | S45 0AY |
| The Causeway | S45 0DU |
| The Hay | S45 0HB |
| The Paddocks | S45 0FD |
| Tinkley Lane | S42 6AR |
| Uppertown | S45 0JD S45 0LS |
| Vernon Lane | S45 0EA |
| Westedge Close | S45 0DS |
| Whitfield Lane | S45 0HZ |
| Yew Tree Close | S45 0BP |
| S42 6AP S42 6AW S42 6QU S45 0JP S45 0JZ |
Transport near Ashover
- FAQ
- Price Paid By Year
- Property Type Price
Frequently asked questions about Ashover
What is the average price for a property for sale in Ashover?
The average price for a property for sale in Ashover is £540,695. This amount is 154% higher than the average price in Chesterfield. There are 2,482 property listings for sale in Ashover.
What streets have the most expensive properties for sale in Ashover?
The streets with the most expensive properties for sale in Ashover are Hill Road at an average of £1,275,000, Milken Lane at an average of £920,666 and Slack Lane at an average of £857,500.
What streets have the most affordable properties for sale in Ashover?
The streets with the most affordable properties for sale in Ashover are Ambervale Flats at an average of £223,750, The Causeway at an average of £240,000 and Ashover Road at an average of £267,500.
Which train stations are available in or near Ashover?
Some of the train stations available in or near Ashover are Matlock, Matlock Bath and Cromford.
Property Price Paid in Ashover by Year
The average sold property price by year was:
| Year | Average Sold Price | Price Change |
Sold Properties
|
|---|---|---|---|
| 2025 | £612,583 | 11% |
18 Properties |
| 2024 | £543,711 | 20% |
33 Properties |
| 2023 | £433,500 | -42% |
13 Properties |
| 2022 | £617,352 | 21% |
17 Properties |
| 2021 | £487,652 | -8% |
36 Properties |
| 2020 | £526,379 | 26% |
27 Properties |
| 2019 | £387,210 | -7% |
19 Properties |
| 2018 | £414,759 | -8% |
22 Properties |
| 2017 | £446,138 | 6% |
18 Properties |
| 2016 | £417,184 | -2% |
20 Properties |
| 2015 | £424,579 | 19% |
22 Properties |
| 2014 | £346,023 | -8% |
19 Properties |
| 2013 | £373,818 | 25% |
11 Properties |
| 2012 | £282,139 | -23% |
14 Properties |
| 2011 | £347,750 | -39% |
14 Properties |
| 2010 | £481,874 | 9% |
16 Properties |
| 2009 | £437,941 | 27% |
17 Properties |
| 2008 | £321,625 | -9% |
8 Properties |
| 2007 | £350,973 | 5% |
19 Properties |
| 2006 | £334,481 | -8% |
21 Properties |
| 2005 | £360,910 | 24% |
23 Properties |
| 2004 | £274,906 | 16% |
25 Properties |
| 2003 | £231,772 | -17% |
29 Properties |
| 2002 | £270,044 | 26% |
29 Properties |
| 2001 | £201,134 | 16% |
22 Properties |
| 2000 | £169,555 | 4% |
17 Properties |
| 1999 | £163,545 | -10% |
20 Properties |
| 1998 | £179,113 | 32% |
15 Properties |
| 1997 | £122,042 | 5% |
15 Properties |
| 1996 | £115,988 | -36% |
22 Properties |
| 1995 | £157,857 | - |
14 Properties |
Property Price per Property Type in Ashover
Here you can find historic sold price data in order to help with your property search.
The average Property Paid Price for specific property types in the last three years are:
| Property Type | Average Sold Price | Sold Properties |
|---|---|---|
| Semi Detached House | £367,341.00 | 19 Semi Detached Houses |
| Detached House | £707,840.00 | 33 Detached Houses |
| Terraced House | £381,875.00 | 10 Terraced Houses |
| Flat | £223,750.00 | 2 Flats |

