
Houses for sale in Matlock St Giles, Matlock
House Prices in Matlock St Giles
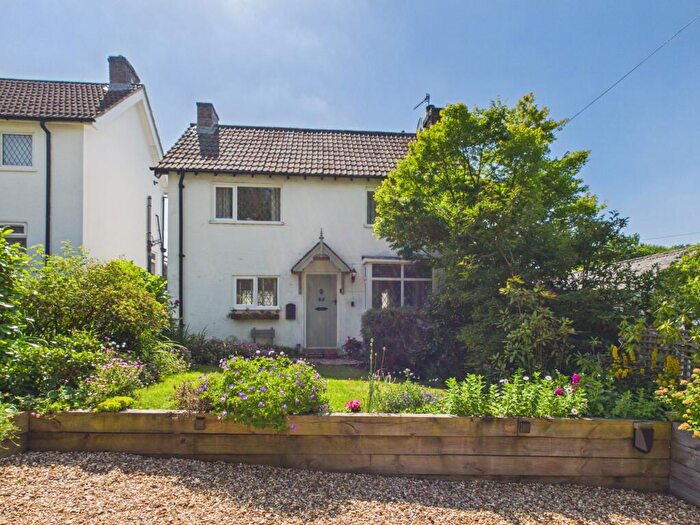
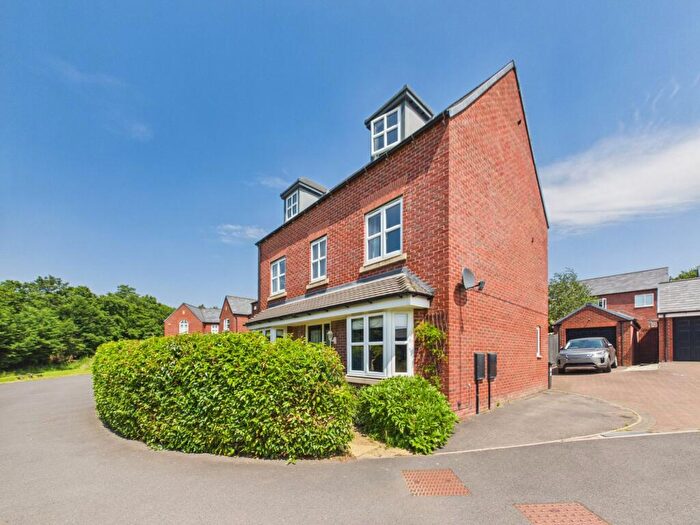
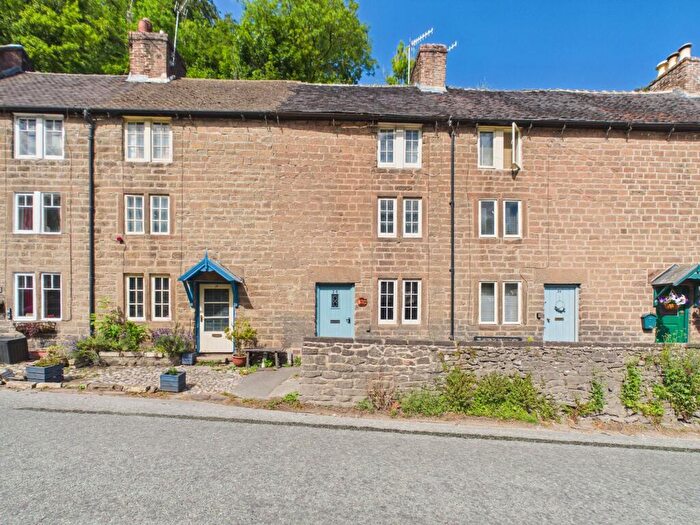
Properties in Matlock St Giles have an average house price of £333k and had 212 Property Transactions within the last 3 years¹.
Matlock St Giles is an area in Matlock, Derbyshire with 2,601 households², where the most expensive property was sold for £1.25M.
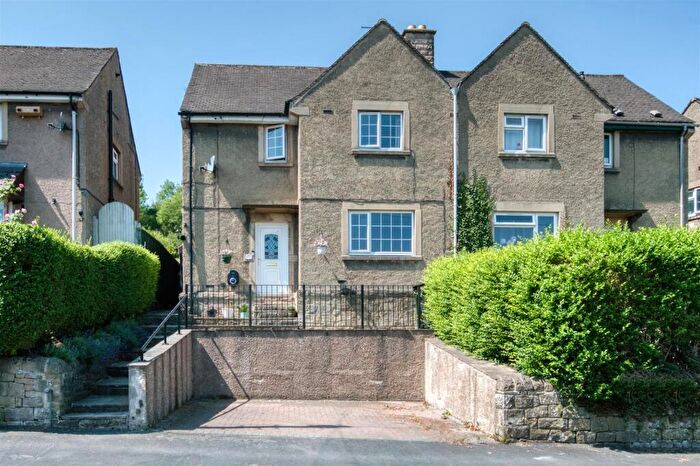
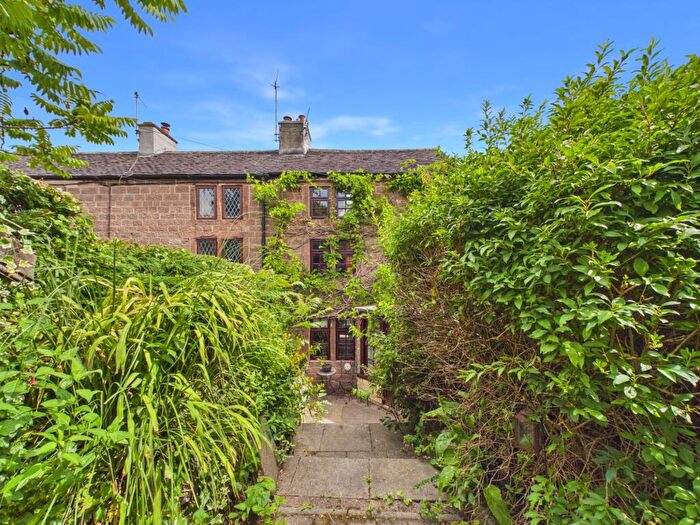
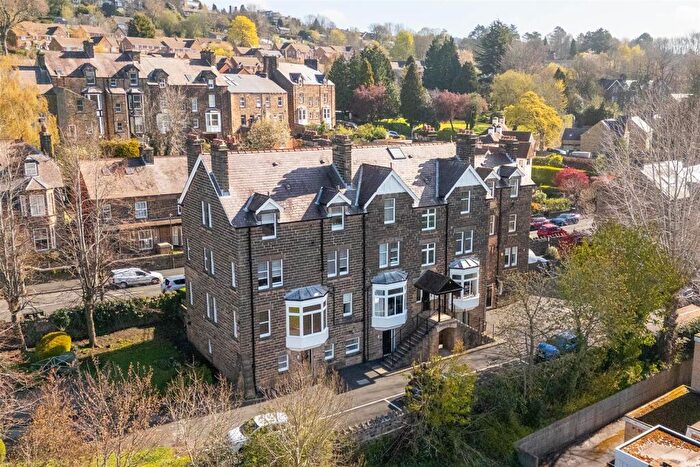
Properties for sale in Matlock St Giles

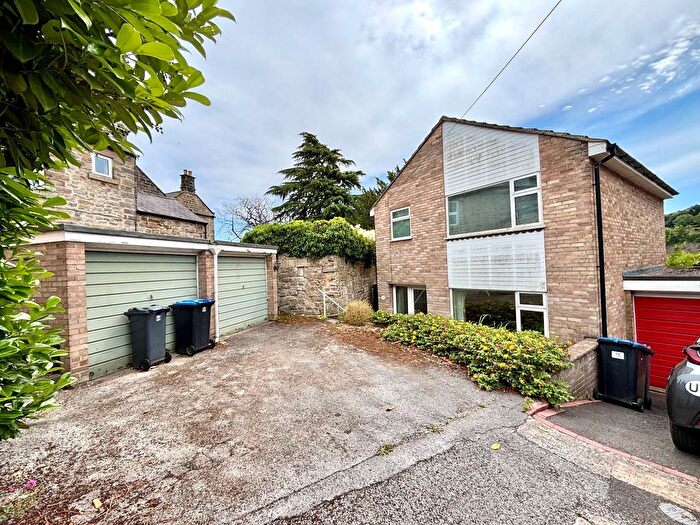


![]()
If you are looking to sell your house, let it out, or receive a property valuation, an expert can help you.
Click the button below to get started.

Roads and Postcodes in Matlock St Giles
Navigate through our locations to find the location of your next house in Matlock St Giles, Matlock for sale or to rent.
| Streets | Postcodes |
|---|---|
| Alders Lane | DE4 5FB |
| Ashley Close | DE4 5HX |
| Asker Lane | DE4 3FY DE4 5LA |
| Baileys Mill | DE4 5NR |
| Barley Way | DE4 3TQ |
| Bentley Bridge Road | DE4 5PQ |
| Bentley Brook | DE4 5NS |
| Brook Walk | DE4 3BS |
| Brookfield Industrial Estate | DE4 5ND |
| Brooklea | DE4 3DH |
| Bull Farm Mews | DE4 5NB |
| Bull Lane | DE4 5LX |
| Butts Drive | DE4 3DJ |
| Carr Lane | DE4 5JT |
| Chesterfield Road | DE4 3FT DE4 5LZ |
| Church Street | DE4 3BY DE4 3BZ DE4 5FE |
| Corn Mill Terrace | DE4 5PU |
| Cross Lane | DE4 5JD |
| Cunnery Lane | DE4 5GB |
| Dale Road | DE4 3PT |
| Deep Carr Lane | DE4 3NQ |
| Denefields Court | DE4 3EY |
| Fairholmes | DE4 3DY |
| Foxholes Lane | DE4 5LF |
| Garton Mill Drive | DE4 5PT |
| Gold Hill | DE4 5FG |
| Green Lane | DE4 5FJ |
| Hawleys Close | DE4 5LY |
| Hazel Court | DE4 3TH |
| Hazel Grove | DE4 3ED |
| Hearthstone Lane | DE4 5JW |
| High Tor Road | DE4 3DG |
| Highfield Drive | DE4 3FZ |
| Hill Top Terrace | DE4 5FY |
| Hill Tops View | DE4 3EE |
| Holly Lane | DE4 5FF |
| Holmesfield Close | DE4 5FZ |
| Horseshoe Mews | DE4 3SY |
| Hurst Rise | DE4 3EP DE4 3ER DE4 3ET DE4 3EU DE4 3EW |
| Knabhall Lane | DE4 5FS |
| Knoll Mount | DE4 5FP |
| Knowleston Place | DE4 3BU |
| Lant Lane | DE4 5FW |
| Lime Tree Road | DE4 3DU DE4 3EJ |
| Linden Grove | DE4 3EN |
| Littlemoor Lane | DE4 5JS |
| Low Leas | DE4 5JR |
| Lumsdale Crescent | DE4 3EX |
| Lumsdale Road | DE4 5NG |
| Lumshill Rise | DE4 3FX |
| Lynholmes Rise | DE4 3DX |
| Lynholmes Road | DE4 3DW |
| Mais Close | DE4 5GZ |
| Maple View | DE4 3AD |
| Masson Terrace | DE4 5FH |
| Matlock Green | DE4 3BF DE4 3BT |
| Mettesford | DE4 3DZ DE4 3EA |
| Middle Lane | DE4 5GD |
| Millfield Court | DE4 5NW |
| Millstone Court | DE4 5PS |
| Mooredge Drive | DE4 5LW |
| Mornington Rise | DE4 3EQ |
| Netherfield Close | DE4 3SS |
| Nottingham Road | DE4 5FR DE4 5GA |
| Oak Tree Gardens | DE4 5WA |
| Oaksedge | DE4 5FQ |
| Old Stone Lane | DE4 5PR |
| Overdale | DE4 3ES |
| Paxton Cottages | DE4 3BX |
| Pingle Rise | DE4 3TN |
| Portway Drive | DE4 3TS |
| Quarry Lane | DE4 5LG |
| Riber View Close | DE4 5HB |
| School Road | DE4 3DS |
| Sherwood Road | DE4 3EL |
| Shortlands | DE4 3DB |
| Smuse Lane | DE4 5EY |
| Spout Lane | DE4 5FU |
| St Giles Walk | DE4 3RZ |
| Stable Cottages | DE4 5EX |
| Starkholmes Road | DE4 3DD DE4 3DE DE4 5JA DE4 5JE |
| Steep Turnpike | DE4 3DP |
| Stoney Way | DE4 3BW |
| Stretton Road | DE4 5GE |
| Swiss Cottages | DE4 5JU |
| Tansley House Gardens | DE4 5HQ |
| Tawney Close | DE4 5HA |
| Thatchers Croft | DE4 5AN |
| Thatchers Lane | DE4 5FD |
| The Cliff | DE4 5EW DE4 5EZ |
| The Croft | DE4 3TR |
| The Knoll | DE4 5FN |
| The Limes Close | DE4 3DT |
| The Rocks | DE4 5ES |
| Tor Close | DE4 3DF |
| Tor Rise | DE4 3DL |
| Turnpike Close | DE4 3DR |
| Upper Lumsdale | DE4 5LB |
| Wards End | DE4 5JB |
| White Tor Road | DE4 5JF |
| Whitelea Lane | DE4 5FL |
| Whitewood Way | DE4 3DA |
| Wishing Stone Way | DE4 5LU |
| DE4 5NA DE4 3EB DE4 3TG DE4 5JX |
Property price trends in Matlock St Giles
According to the latest Land Registry data, the average home in Matlock St Giles sold for £221,583 in 2026. That figure comes from 2,385 sales logged over the past 31 years.
Prices have fallen back over the last three years. Compared with 2023, when the typical sale came in around £320,506, that's a fall of roughly 30.9%.
Looking back five years, average prices are down about 27.3% since 2021, a drop of around £83,065 in cash terms.
Zoom out to the past decade for the fuller picture. Back in 2016, homes here averaged £217,388, so the typical sold price has climbed about 1.9% since then, roughly 0.2% a year. Stretch the view to fifteen years and that annual pace edges up closer to 1.1%.
Frequently asked questions about Matlock St Giles
What is the average price for a property for sale in Matlock St Giles?
The average price for a property for sale in Matlock St Giles is £333,159. This amount is 2% higher than the average price in Matlock. There are 1,369 property listings for sale in Matlock St Giles.
What streets have the most expensive properties for sale in Matlock St Giles?
The streets with the most expensive properties for sale in Matlock St Giles are Stable Cottages at an average of £920,000, Nottingham Road at an average of £703,500 and Foxholes Lane at an average of £700,000.
What streets have the most affordable properties for sale in Matlock St Giles?
The streets with the most affordable properties for sale in Matlock St Giles are Overdale at an average of £130,000, Baileys Mill at an average of £141,875 and Hurst Rise at an average of £146,000.
Which train stations are available in or near Matlock St Giles?
Some of the train stations available in or near Matlock St Giles are Matlock, Matlock Bath and Cromford.
Property Price Paid in Matlock St Giles by Year
The average sold property price by year was:
| Year | Average Sold Price | Price Change |
Sold Properties
|
|---|---|---|---|
| 2026 | £221,583 | -45% |
6 Properties |
| 2025 | £320,566 | -15% |
80 Properties |
| 2024 | £368,613 | 13% |
68 Properties |
| 2023 | £320,506 | -4% |
58 Properties |
| 2022 | £333,343 | 9% |
72 Properties |
| 2021 | £304,648 | -9% |
108 Properties |
| 2020 | £332,247 | 12% |
91 Properties |
| 2019 | £293,033 | -0,4% |
125 Properties |
| 2018 | £294,228 | 16% |
119 Properties |
| 2017 | £248,151 | 12% |
71 Properties |
Property Price per Property Type in Matlock St Giles
Here you can find historic sold price data in order to help with your property search.
The average Property Paid Price for specific property types in the last three years are:
| Property Type | Average Sold Price | Sold Properties |
|---|---|---|
| Semi Detached House | £265,874.00 | 76 Semi Detached Houses |
| Detached House | £465,766.00 | 77 Detached Houses |
| Terraced House | £263,266.00 | 45 Terraced Houses |
| Flat | £193,746.00 | 14 Flats |
