Houses for sale & to rent in Barlow And Holmesfield, Dronfield
House Prices in Barlow And Holmesfield
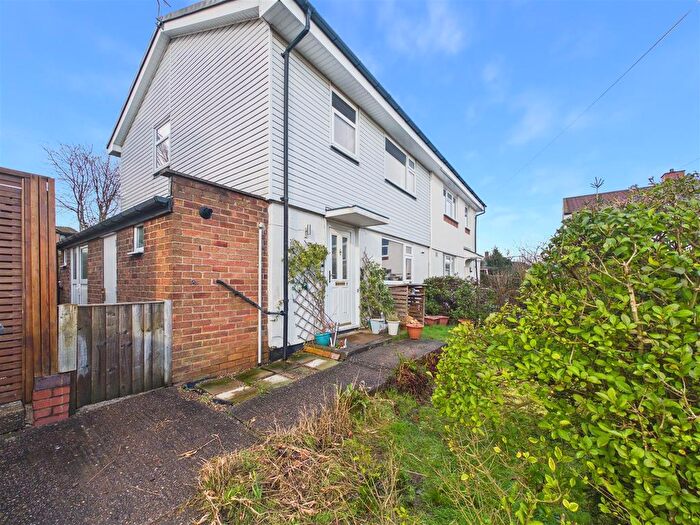
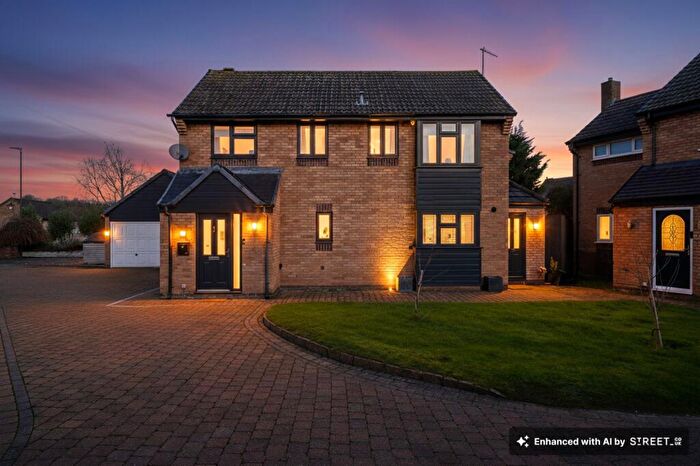
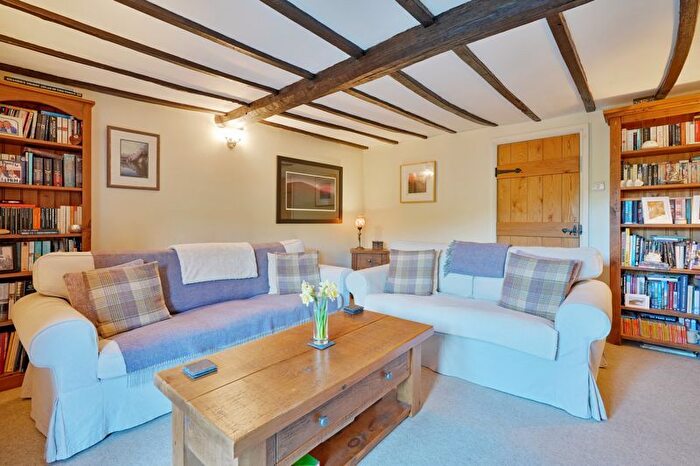
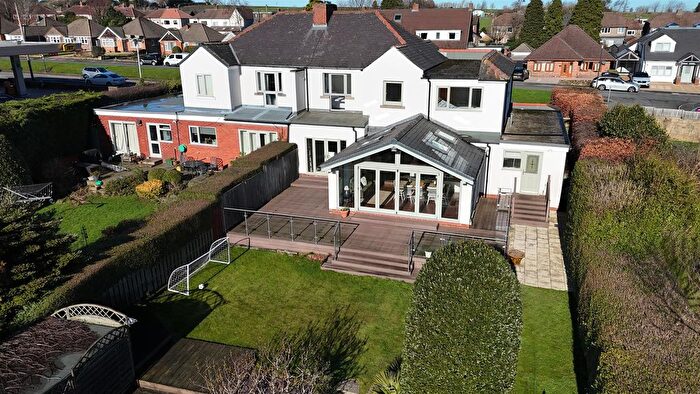
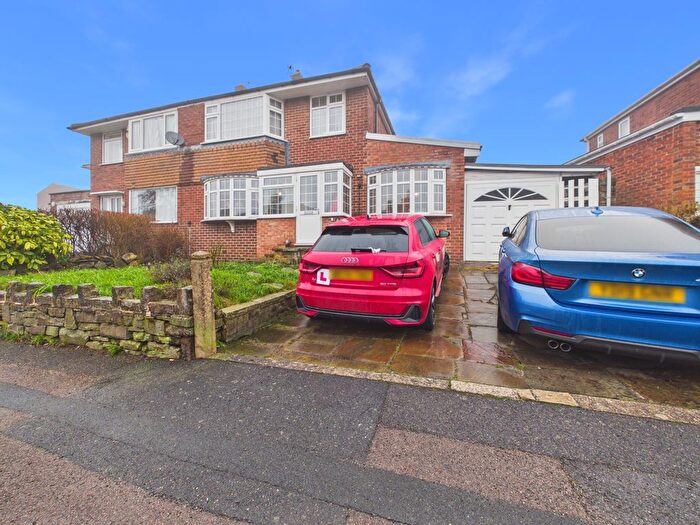
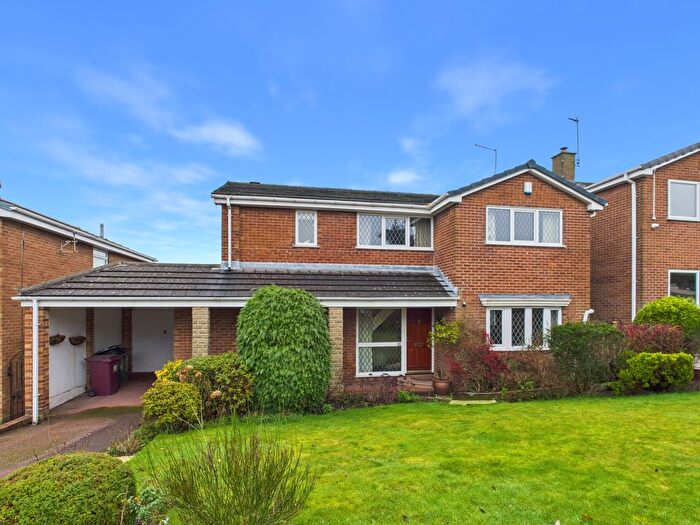
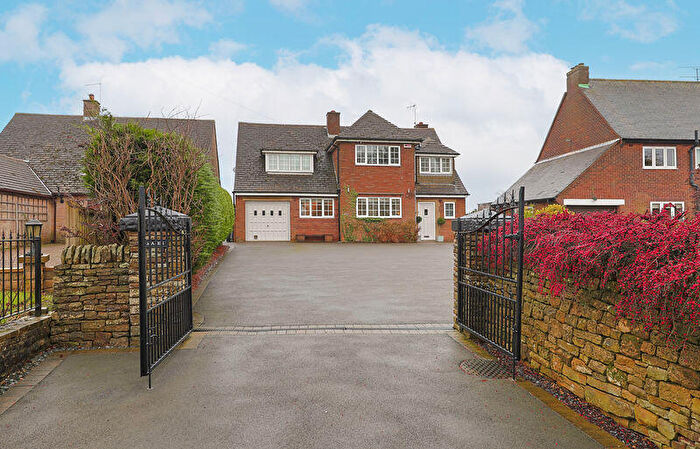
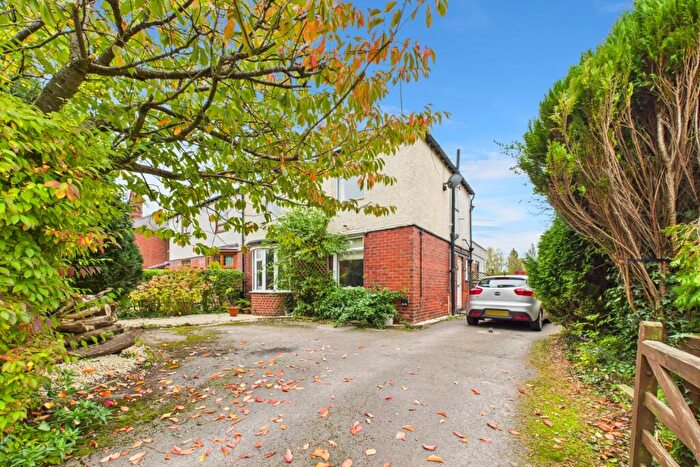
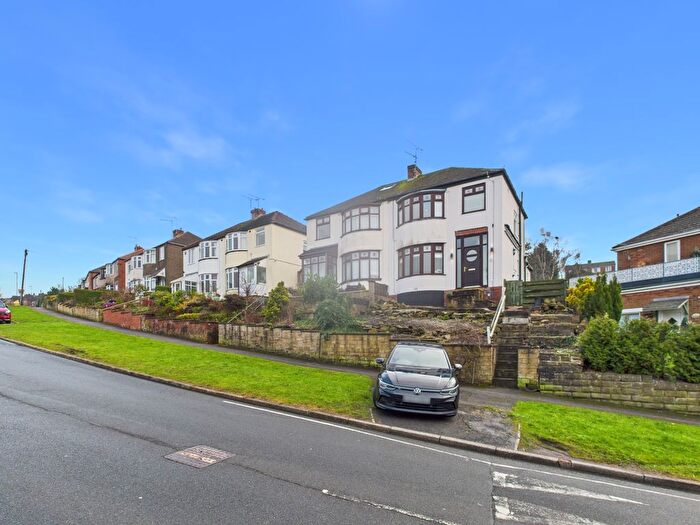
Properties in Barlow And Holmesfield have an average house price of £577,480.00 and had 54 Property Transactions within the last 3 years¹.
Barlow And Holmesfield is an area in Dronfield, Derbyshire with 785 households², where the most expensive property was sold for £1,975,000.00.
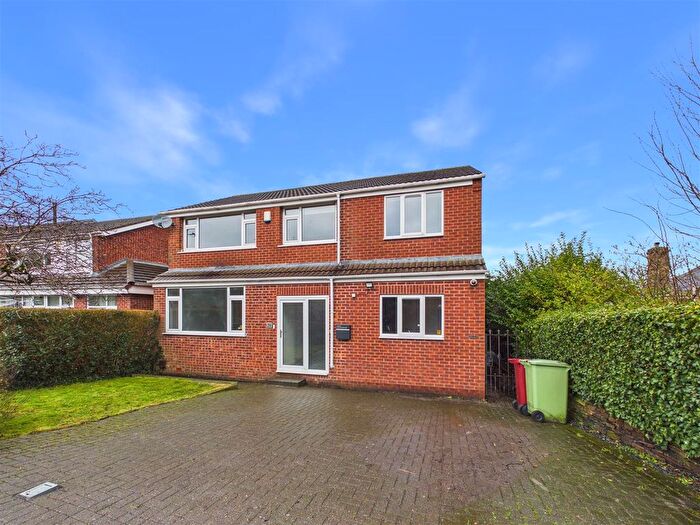
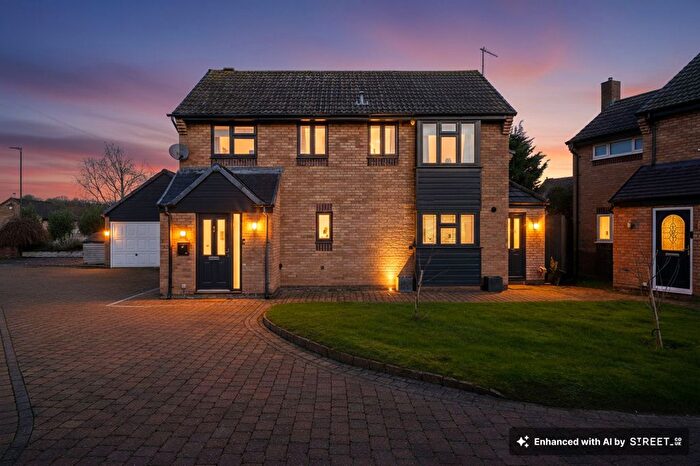
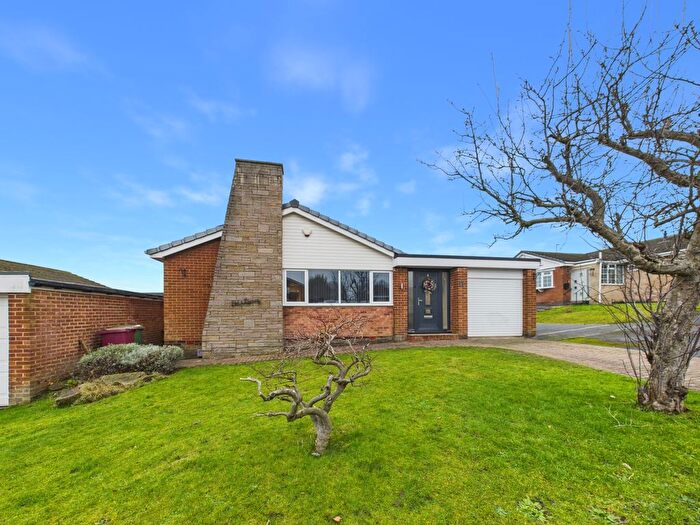
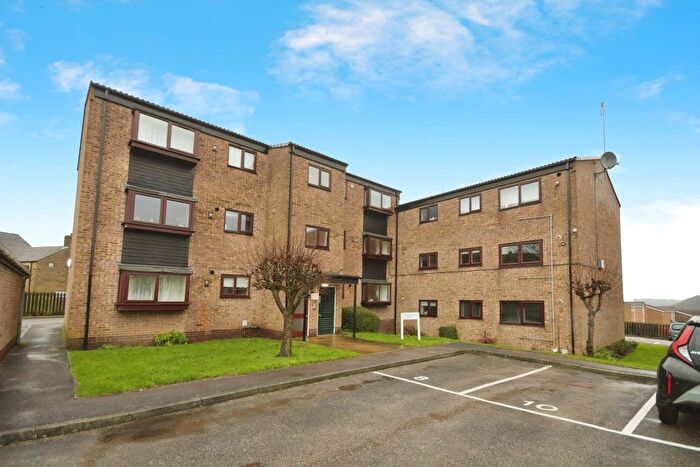
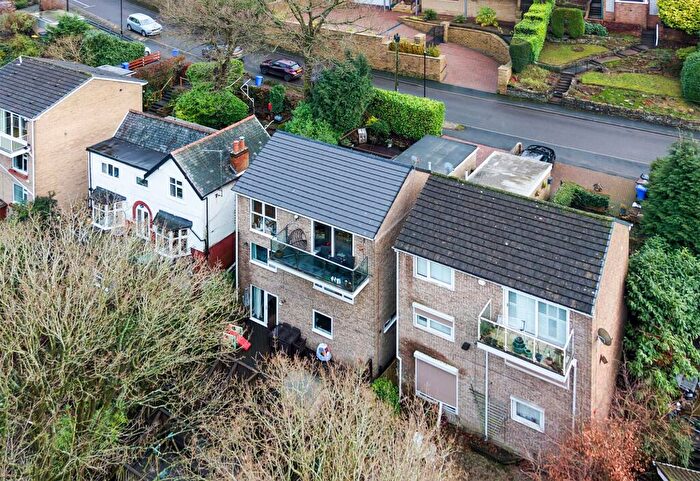
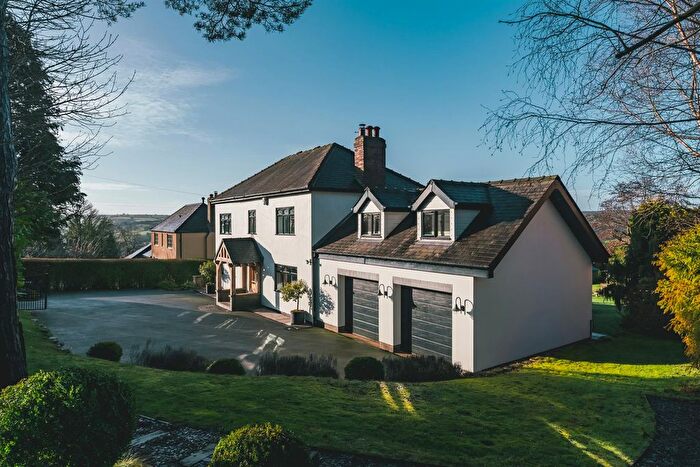
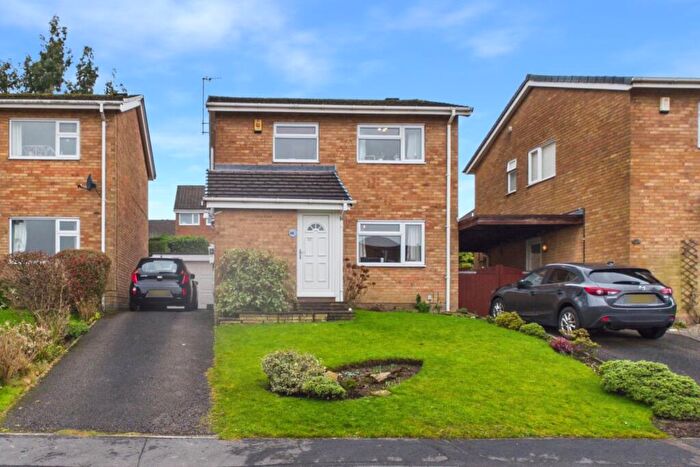
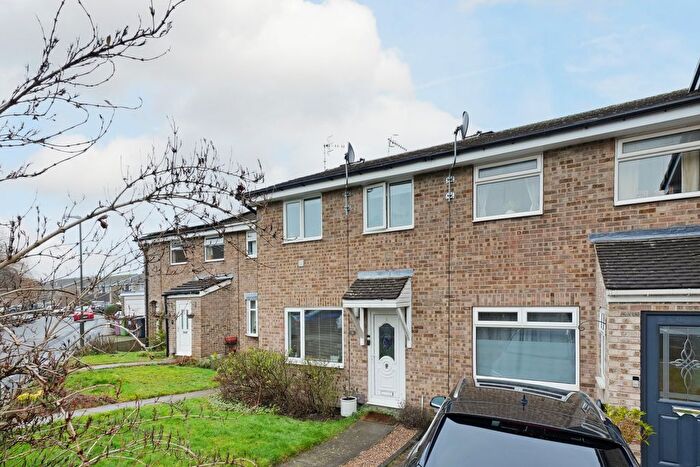
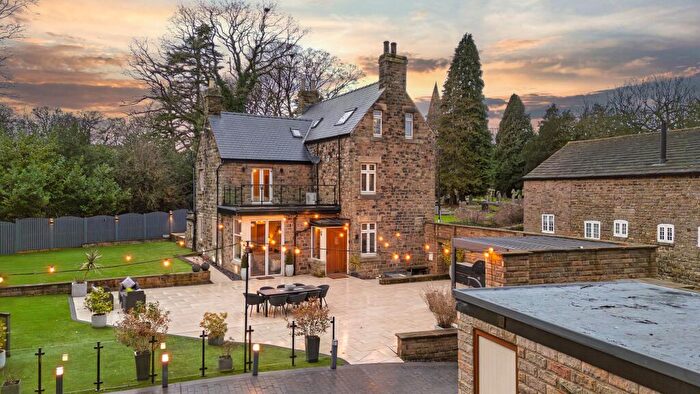
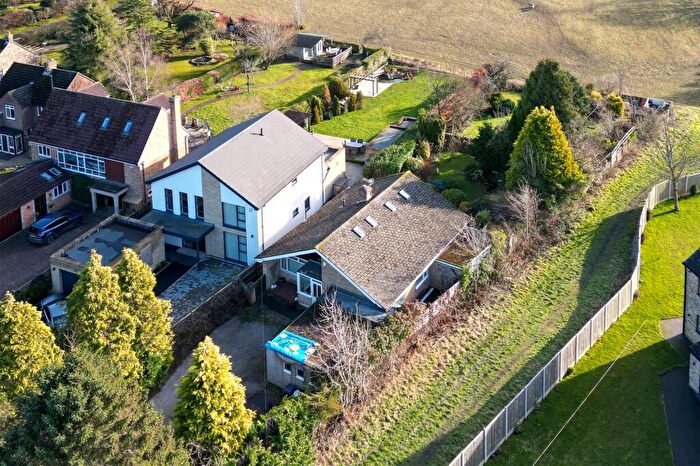
Properties for sale in Barlow And Holmesfield
Roads and Postcodes in Barlow And Holmesfield
Navigate through our locations to find the location of your next house in Barlow And Holmesfield, Dronfield for sale or to rent.
| Streets | Postcodes |
|---|---|
| Barlow Lees | S18 7SW |
| Brindwoodgate | S18 7ST |
| Brookvale Close | S18 7TS |
| Cartledge Lane | S18 7SB |
| Castle Hill | S18 7WQ |
| Commonside Road | S18 7SJ |
| Cordwell Lane | S18 7WH S18 7WJ |
| Cowley Lane | S18 7SD |
| Crow Hole | S18 7TJ |
| Dobbin Lane | S18 7SU |
| Fox Lane | S18 7WG |
| Hackney Lane | S18 7TD S18 7TR |
| Horsleygate Lane | S18 7WD |
| Main Road | S18 7TQ S18 7WT |
| Mill Lane | S18 7TL S18 7WL |
| Mill Street | S18 7SP |
| Millcross Lane | S18 7TA |
| Millthorpe Lane | S18 7SA |
| Mods Lane | S18 7RZ |
| Monkwood | S18 7SY |
| Nesfield | S18 7TB |
| New Road | S18 7WN |
| Newgate | S18 7TF |
| Oaks Lane | S18 7TN |
| Overlees | S18 7TP |
| Oxton Rakes | S18 7TH |
| Park Avenue | S18 7XA |
| Rutland Terrace | S18 7SS |
| Springfield Road | S18 7SQ S18 7SR |
| The Common | S18 7WP |
| The Crescent | S18 7WY |
| Unthank Lane | S18 7WF |
| Valley Rise | S18 7SG |
| Valley Road | S18 7SL S18 7SN |
| Vicarage Close | S18 7WZ |
| Wilday Green Lane | S18 7SH |
| Wilkin Hill | S18 7TE |
| Woodside Avenue | S18 7WW |
| Woodside View | S18 7WX |
| S18 7SE S18 7WB |
Transport near Barlow And Holmesfield
- FAQ
- Price Paid By Year
- Property Type Price
Frequently asked questions about Barlow And Holmesfield
What is the average price for a property for sale in Barlow And Holmesfield?
The average price for a property for sale in Barlow And Holmesfield is £577,480. This amount is 81% higher than the average price in Dronfield. There are 586 property listings for sale in Barlow And Holmesfield.
What streets have the most expensive properties for sale in Barlow And Holmesfield?
The streets with the most expensive properties for sale in Barlow And Holmesfield are Wilday Green Lane at an average of £1,975,000, Hackney Lane at an average of £1,600,000 and Cowley Lane at an average of £1,266,250.
What streets have the most affordable properties for sale in Barlow And Holmesfield?
The streets with the most affordable properties for sale in Barlow And Holmesfield are Woodside View at an average of £145,150, Springfield Road at an average of £167,812 and Mill Street at an average of £209,375.
Which train stations are available in or near Barlow And Holmesfield?
Some of the train stations available in or near Barlow And Holmesfield are Dronfield, Dore and Totley and Chesterfield.
Property Price Paid in Barlow And Holmesfield by Year
The average sold property price by year was:
| Year | Average Sold Price | Price Change |
Sold Properties
|
|---|---|---|---|
| 2025 | £490,547 | -46% |
17 Properties |
| 2024 | £714,395 | 28% |
19 Properties |
| 2023 | £515,064 | -16% |
18 Properties |
| 2022 | £600,031 | 12% |
16 Properties |
| 2021 | £530,111 | 30% |
18 Properties |
| 2020 | £372,545 | 1% |
22 Properties |
| 2019 | £368,187 | 13% |
32 Properties |
| 2018 | £320,392 | -53% |
24 Properties |
| 2017 | £490,403 | 12% |
19 Properties |
| 2016 | £429,291 | 31% |
12 Properties |
| 2015 | £298,121 | -7% |
16 Properties |
| 2014 | £319,031 | 15% |
16 Properties |
| 2013 | £272,628 | 25% |
25 Properties |
| 2012 | £205,605 | -63% |
9 Properties |
| 2011 | £334,624 | -27% |
15 Properties |
| 2010 | £423,330 | 14% |
18 Properties |
| 2009 | £364,863 | 17% |
15 Properties |
| 2008 | £304,090 | -21% |
11 Properties |
| 2007 | £367,852 | 37% |
26 Properties |
| 2006 | £231,080 | -24% |
23 Properties |
| 2005 | £287,159 | -8% |
16 Properties |
| 2004 | £310,100 | 22% |
15 Properties |
| 2003 | £241,549 | 22% |
16 Properties |
| 2002 | £188,361 | -29% |
18 Properties |
| 2001 | £243,202 | 40% |
25 Properties |
| 2000 | £144,855 | -19% |
20 Properties |
| 1999 | £171,977 | 7% |
29 Properties |
| 1998 | £159,488 | 24% |
25 Properties |
| 1997 | £120,625 | -6% |
27 Properties |
| 1996 | £127,611 | 19% |
18 Properties |
| 1995 | £103,110 | - |
25 Properties |
Property Price per Property Type in Barlow And Holmesfield
Here you can find historic sold price data in order to help with your property search.
The average Property Paid Price for specific property types in the last three years are:
| Property Type | Average Sold Price | Sold Properties |
|---|---|---|
| Semi Detached House | £322,686.00 | 15 Semi Detached Houses |
| Detached House | £860,666.00 | 28 Detached Houses |
| Terraced House | £204,090.00 | 11 Terraced Houses |

