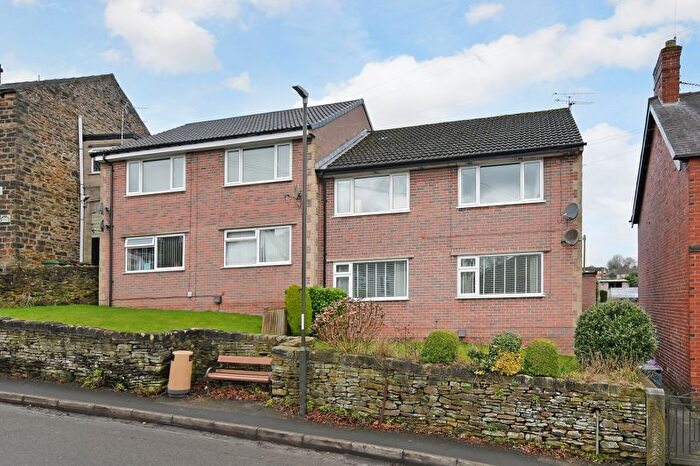
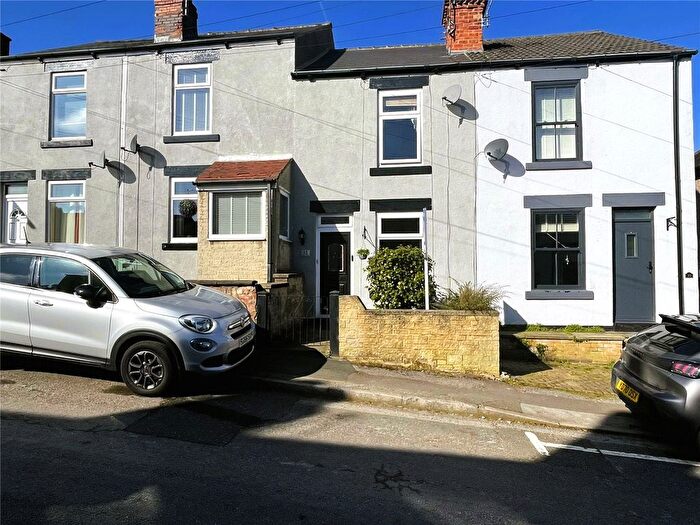
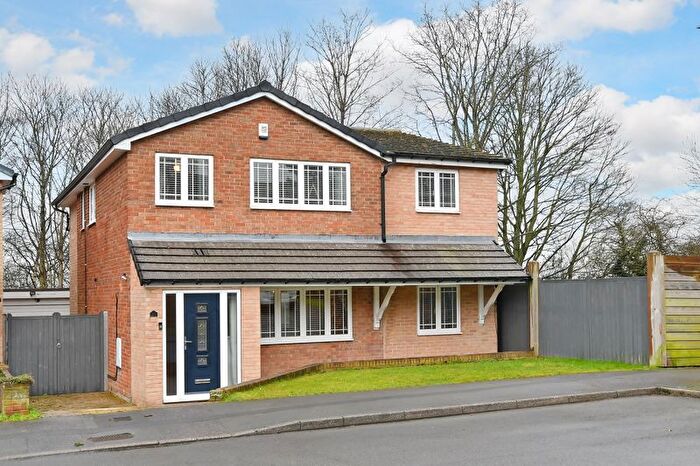
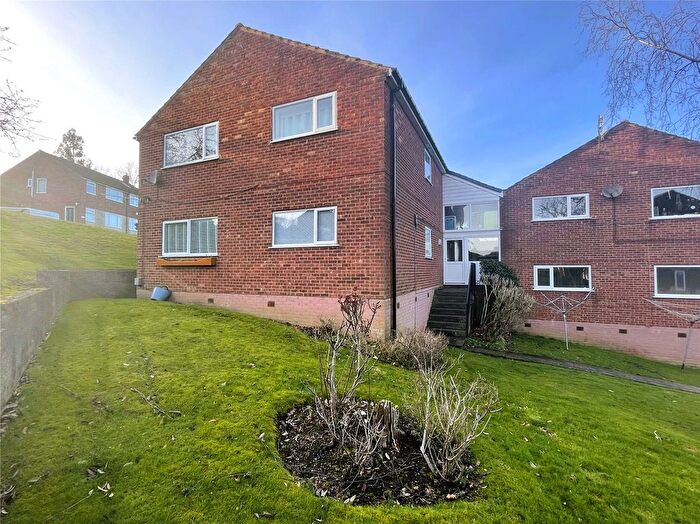
Houses for sale & to rent in Dronfield South, Dronfield
House Prices in Dronfield South
Properties in Dronfield South have an average house price of £301,022.00 and had 209 Property Transactions within the last 3 years¹.
Dronfield South is an area in Dronfield, Derbyshire with 2,290 households², where the most expensive property was sold for £918,000.00.
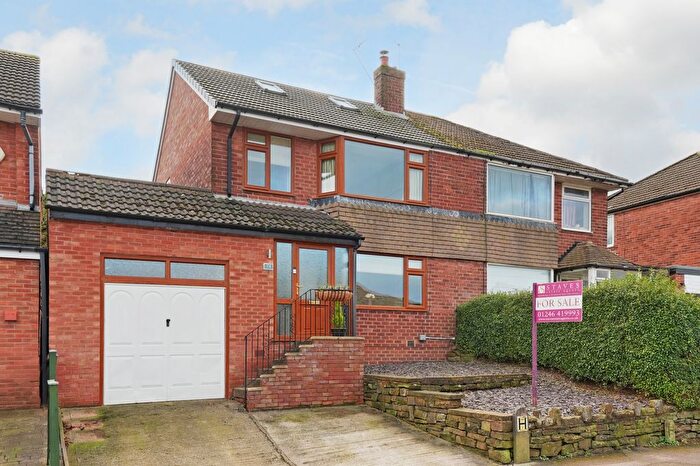
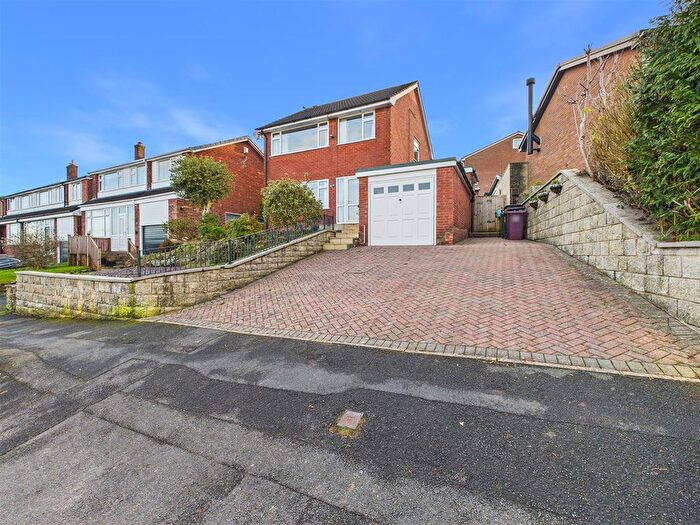
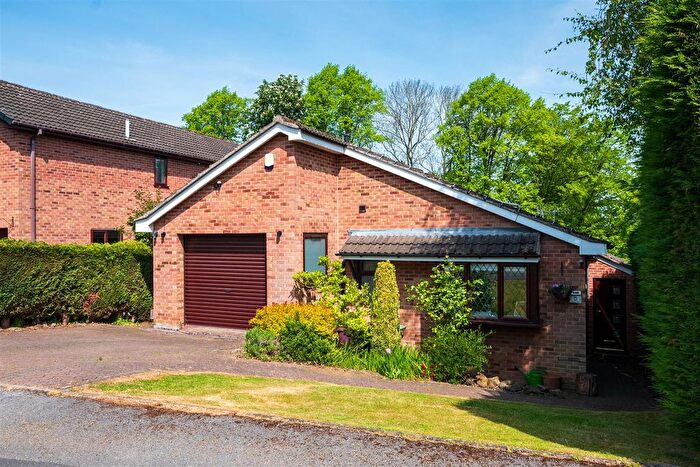
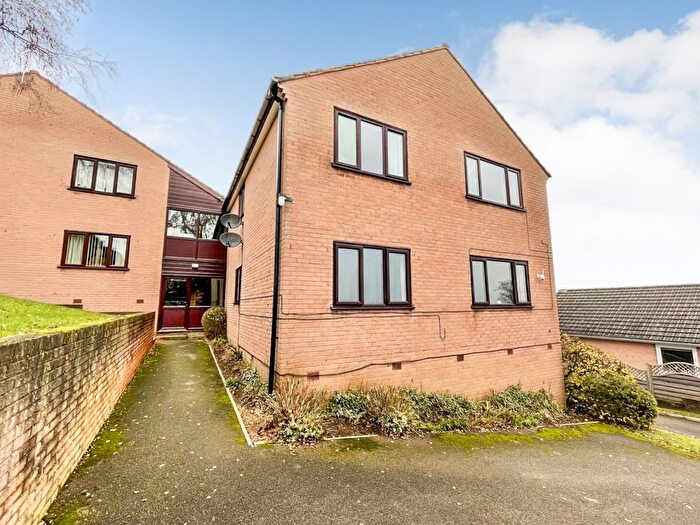
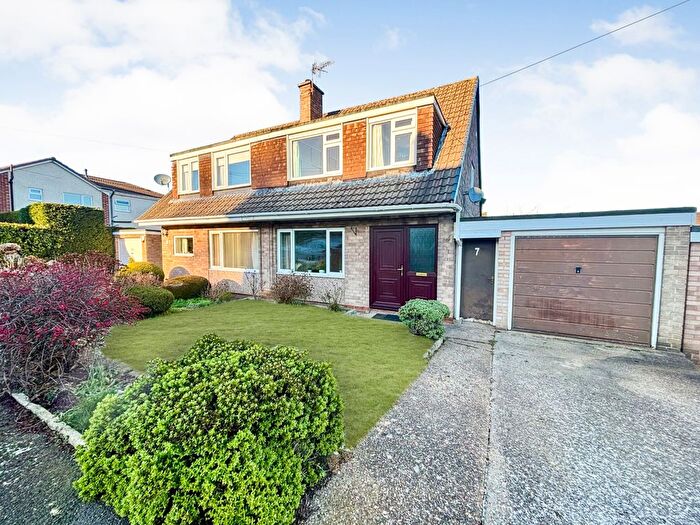
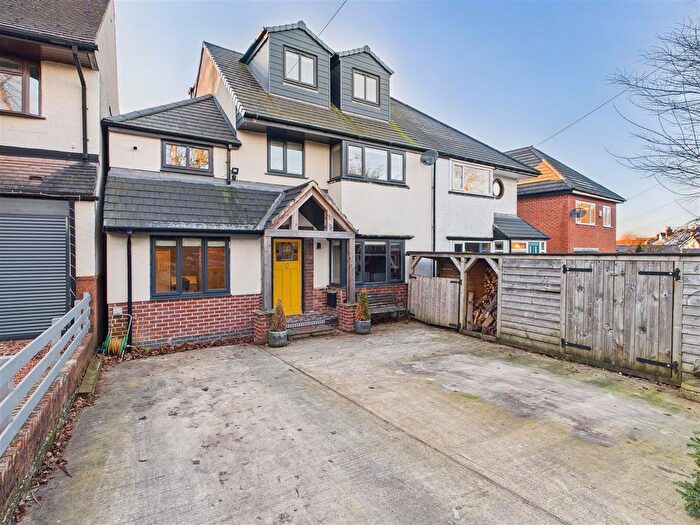
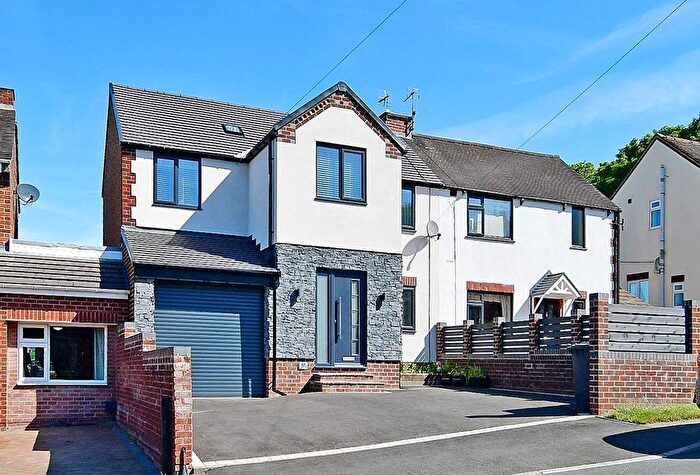
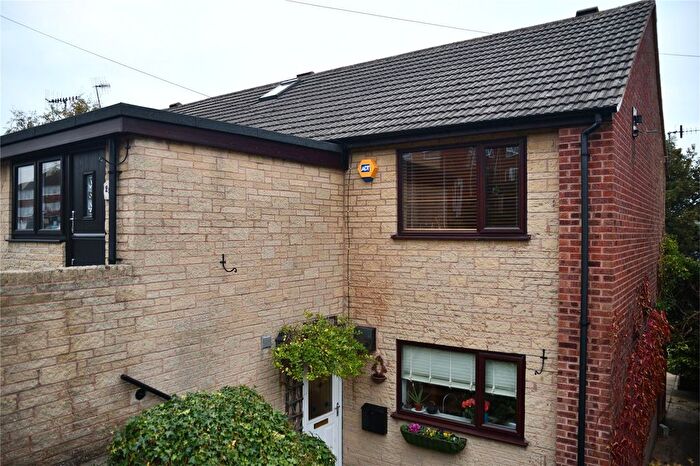
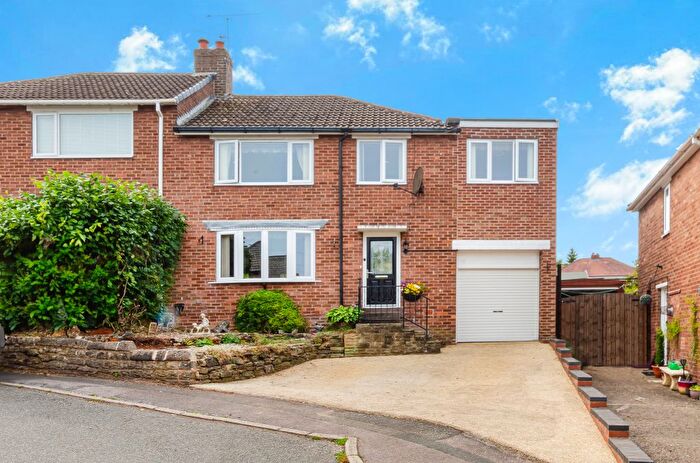
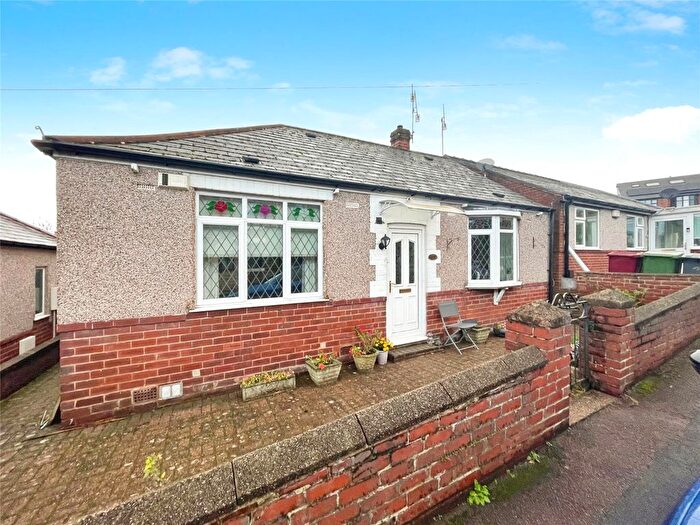
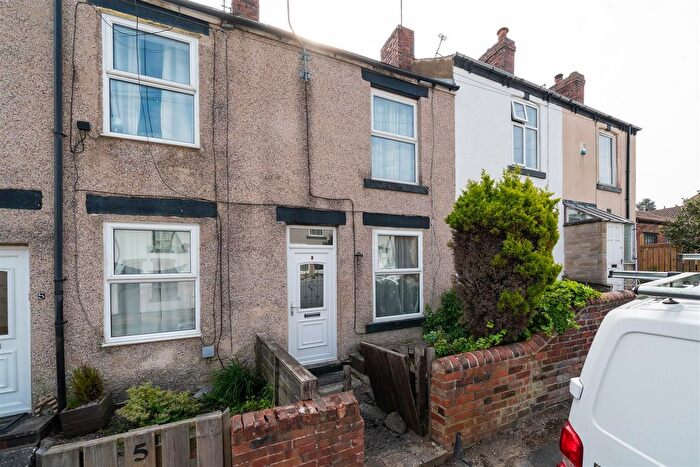
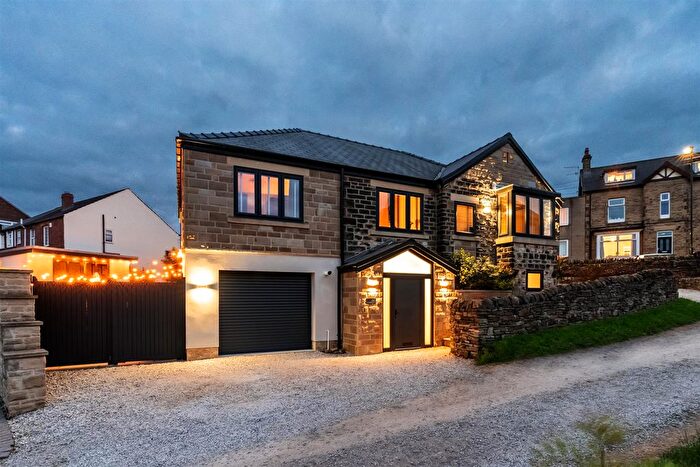
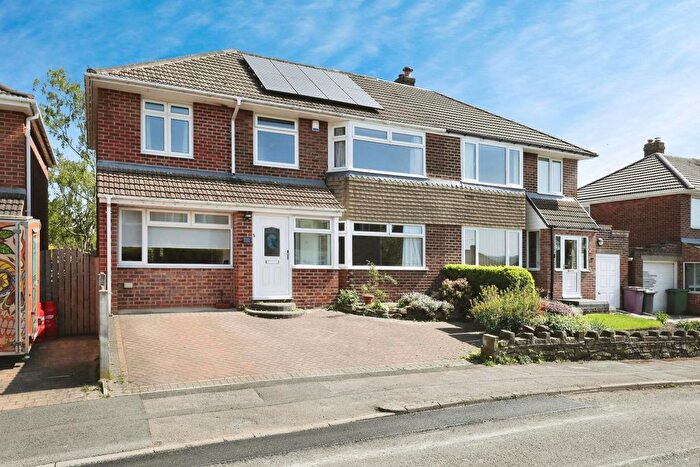
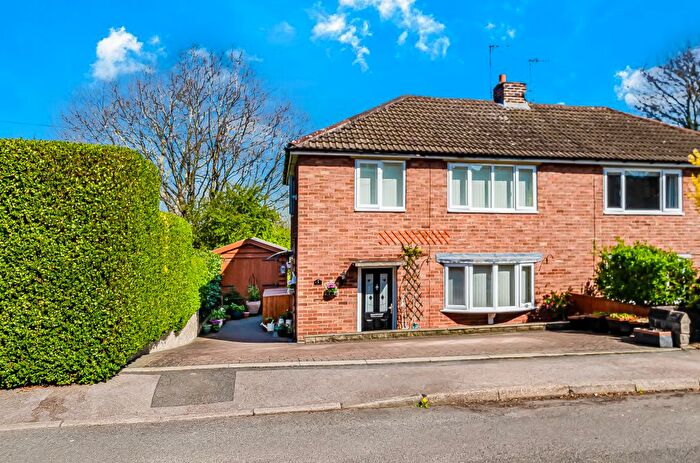
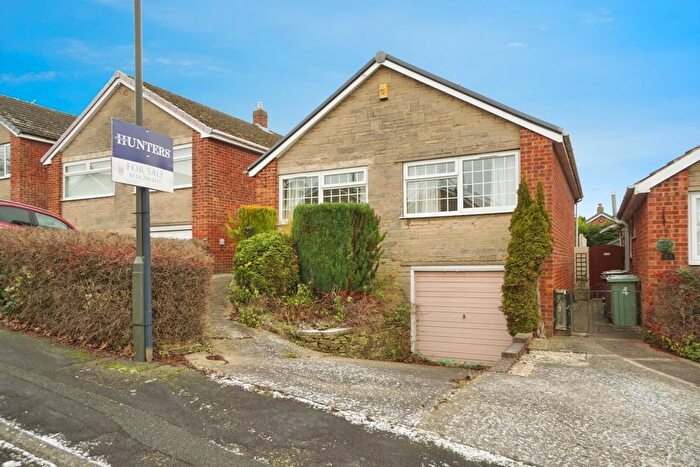
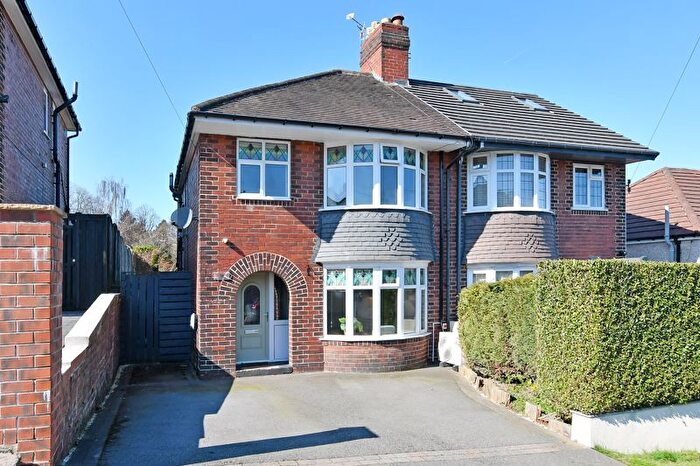
Properties for sale in Dronfield South
Previously listed properties in Dronfield South
Roads and Postcodes in Dronfield South
Navigate through our locations to find the location of your next house in Dronfield South, Dronfield for sale or to rent.
| Streets | Postcodes |
|---|---|
| Anglesey Road | S18 1UZ |
| Appletree Drive | S18 1SG |
| Barlow View | S18 1YJ |
| Burns Drive | S18 1NJ |
| Byron Close | S18 1NG |
| Caernarvon Road | S18 1WJ |
| Caldey Road | S18 1RS |
| Cemetery Road | S18 1XX S18 1XY |
| Chapel Yard | S18 1QE |
| Chaucer Drive | S18 1NE |
| Chesterfield Road | S18 1XG S18 1XH S18 1XJ S18 2XF S18 4AF S18 2XE S18 4AP |
| Chestnut Close | S18 1WF |
| Church Street | S18 1QB S18 1QX |
| Cross Lane | S18 1SH |
| Dale Road | S18 1YG |
| Dronfield Civic Centre | S18 1PD |
| Eastfield Road | S18 1YD |
| Fairwinds Close | S18 1RZ |
| Falkland Rise | S18 1SU |
| Fanshaw Bank | S18 1QD |
| Farwater Close | S18 1RE |
| Farwater Lane | S18 1RA |
| Fletcher Avenue | S18 1RW S18 1RX |
| Gelderd Place | S18 1TB |
| Gledhill Close | S18 1SX |
| Gomersal Lane | S18 1RU |
| Gosforth Lane | S18 1RB |
| Greenacres Close | S18 1WE |
| Hallowes Court | S18 1WL S18 1WG |
| Hallowes Drive | S18 1YH |
| Hallowes Lane | S18 1SR S18 1SS S18 1ST S18 1UA S18 1UR |
| Hallowes Rise | S18 1YA S18 1YB |
| Hazel Close | S18 1TZ |
| Hazel Court | S18 1TW |
| High Street | S18 1PX S18 1PY S18 1PZ |
| Highdale Fold | S18 1TA |
| Highfields Crescent | S18 1UT |
| Highfields Road | S18 1UU S18 1UW |
| Highgate Drive | S18 1UD |
| Highgate Lane | S18 1UB |
| Hillside Avenue | S18 1RQ |
| Hilltop Road | S18 1UH S18 1UJ S18 1UL S18 1UN S18 1UP |
| Hilltop Way | S18 1YL |
| Hollies Close | S18 1TY |
| Hollins Spring Avenue | S18 1RN S18 1RP |
| Hollins Spring Road | S18 1US |
| Kipling Close | S18 1NH |
| Lea Road | S18 1SB S18 1SD S18 1SE |
| Lindisfarne Road | S18 1WA |
| Links Road | S18 1UE |
| Longacre Court | S18 1WQ |
| Longacre Road | S18 1UQ |
| Lundy Road | S18 1UY |
| Machins Court | S18 1QF |
| Mill Lane | S18 2WD |
| Moonpenny Way | S18 1SA S18 1TQ |
| Moorgate Crescent | S18 1YF |
| Netherdene Road | S18 1RR S18 1TR |
| Netherfields Crescent | S18 1UX |
| Palmer Crescent | S18 1XW |
| Peel Gardens | S18 1RG |
| Pembroke Road | S18 1WH S18 1WN |
| Poplar Close | S18 1TX |
| Quoit Green | S18 1SJ |
| Salisbury Avenue | S18 1WD |
| Salisbury Road | S18 1UF S18 1UG |
| Scarsdale Close | S18 1TD |
| Scarsdale Cross | S18 1SL |
| Scarsdale Road | S18 1SN |
| School Lane | S18 1RY |
| Shakespeare Crescent | S18 1NA S18 1NB S18 1ND |
| Sheffield Road | S18 2GG |
| Shelley Drive | S18 1NF |
| Shetland Road | S18 1WB |
| Soaper Lane | S18 1QA |
| Southfield Drive | S18 1YP |
| Southfield Mount | S18 1YQ |
| Southwood Avenue | S18 1YN |
| Stubley Lane | S18 1DJ S18 1LS |
| Upper School Lane | S18 1SQ |
| Vale Close | S18 1SF |
| Wards Yard | S18 1NQ S18 1QJ |
| Westfield Road | S18 1YE |
| Wilson Street | S18 1SP |
| Wordsworth Place | S18 1NL |
| Wreakes Lane | S18 1PN S18 1LY S18 1NW |
Transport near Dronfield South
- FAQ
- Price Paid By Year
- Property Type Price
Frequently asked questions about Dronfield South
What is the average price for a property for sale in Dronfield South?
The average price for a property for sale in Dronfield South is £301,022. This amount is 5% lower than the average price in Dronfield. There are 119 property listings for sale in Dronfield South.
What streets have the most expensive properties for sale in Dronfield South?
The streets with the most expensive properties for sale in Dronfield South are Highdale Fold at an average of £600,000, Highgate Lane at an average of £600,000 and Barlow View at an average of £540,000.
What streets have the most affordable properties for sale in Dronfield South?
The streets with the most affordable properties for sale in Dronfield South are Anglesey Road at an average of £100,000, Pembroke Road at an average of £168,850 and Wilson Street at an average of £175,000.
Which train stations are available in or near Dronfield South?
Some of the train stations available in or near Dronfield South are Dronfield, Dore and Totley and Chesterfield.
Property Price Paid in Dronfield South by Year
The average sold property price by year was:
| Year | Average Sold Price | Price Change |
Sold Properties
|
|---|---|---|---|
| 2025 | £306,724 | 7% |
78 Properties |
| 2024 | £286,427 | -8% |
70 Properties |
| 2023 | £310,480 | 5% |
61 Properties |
| 2022 | £295,325 | 10% |
86 Properties |
| 2021 | £266,203 | 1% |
89 Properties |
| 2020 | £262,351 | 2% |
81 Properties |
| 2019 | £256,858 | 2% |
86 Properties |
| 2018 | £252,047 | 11% |
94 Properties |
| 2017 | £224,435 | 2% |
98 Properties |
| 2016 | £220,928 | -1% |
83 Properties |
| 2015 | £223,568 | 21% |
81 Properties |
| 2014 | £176,449 | -11% |
110 Properties |
| 2013 | £195,093 | 8% |
82 Properties |
| 2012 | £179,637 | 2% |
60 Properties |
| 2011 | £176,839 | 2% |
68 Properties |
| 2010 | £173,706 | -10% |
69 Properties |
| 2009 | £190,737 | -4% |
59 Properties |
| 2008 | £197,985 | 2% |
49 Properties |
| 2007 | £194,105 | 7% |
107 Properties |
| 2006 | £179,909 | 10% |
103 Properties |
| 2005 | £161,351 | 9% |
102 Properties |
| 2004 | £147,395 | 12% |
97 Properties |
| 2003 | £130,218 | 20% |
93 Properties |
| 2002 | £104,442 | 16% |
116 Properties |
| 2001 | £88,028 | 13% |
108 Properties |
| 2000 | £76,693 | 13% |
111 Properties |
| 1999 | £67,098 | 2% |
117 Properties |
| 1998 | £65,560 | 7% |
100 Properties |
| 1997 | £60,951 | 5% |
96 Properties |
| 1996 | £57,652 | -3% |
99 Properties |
| 1995 | £59,555 | - |
74 Properties |
Property Price per Property Type in Dronfield South
Here you can find historic sold price data in order to help with your property search.
The average Property Paid Price for specific property types in the last three years are:
| Property Type | Average Sold Price | Sold Properties |
|---|---|---|
| Semi Detached House | £278,895.00 | 95 Semi Detached Houses |
| Detached House | £408,111.00 | 69 Detached Houses |
| Terraced House | £215,019.00 | 26 Terraced Houses |
| Flat | £140,447.00 | 19 Flats |

