Houses for sale & to rent in Dronfield North, Dronfield
House Prices in Dronfield North
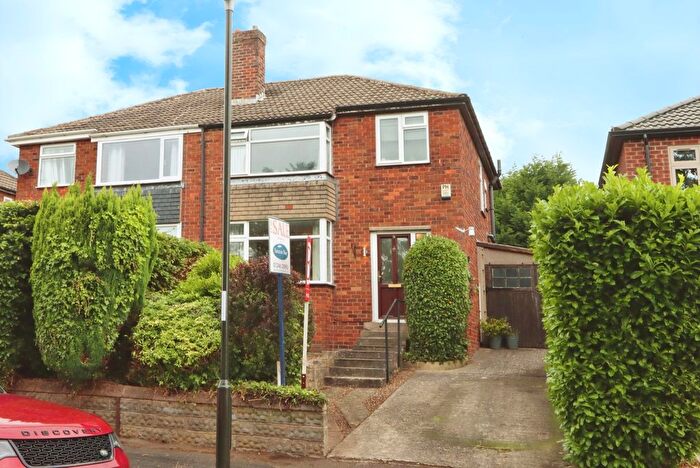
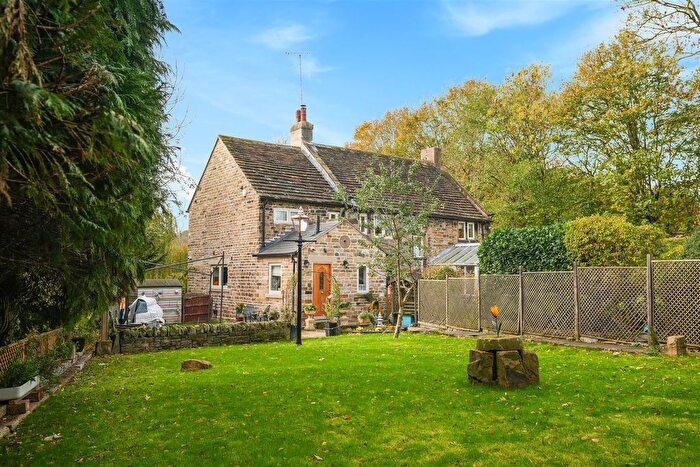
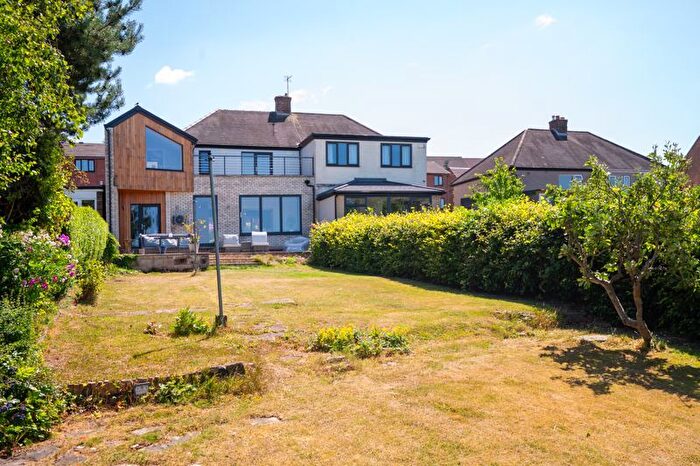
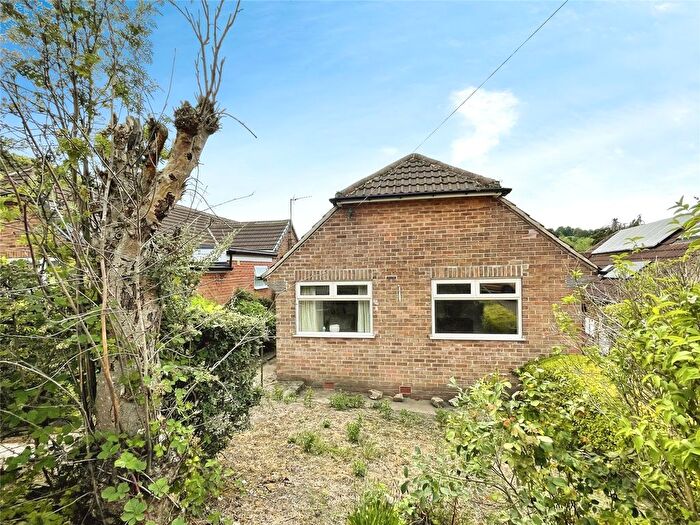
Properties in Dronfield North have an average house price of £254,605.00 and had 160 Property Transactions within the last 3 years¹.
Dronfield North is an area in Dronfield, Derbyshire with 1,832 households², where the most expensive property was sold for £665,000.00.
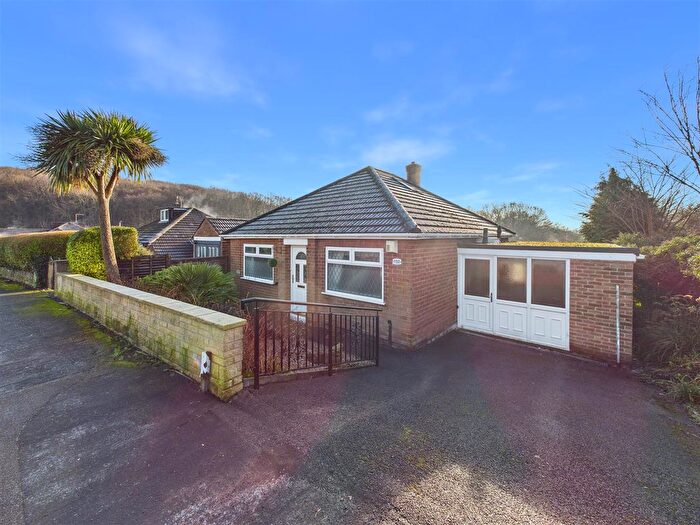
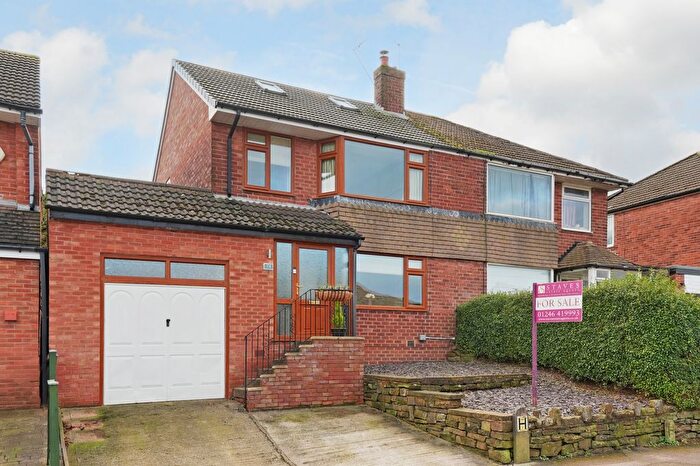
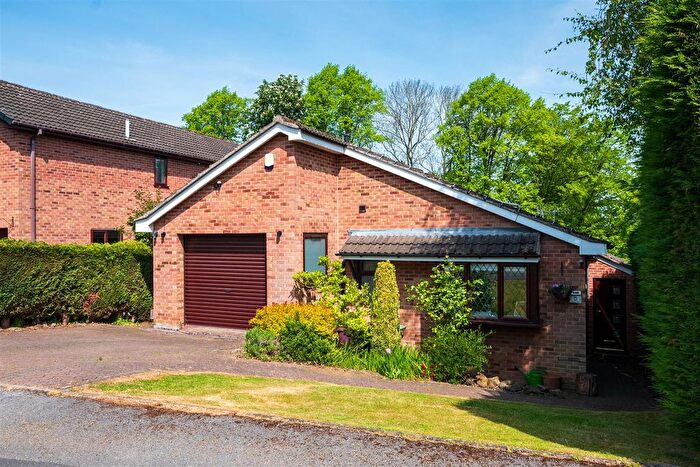
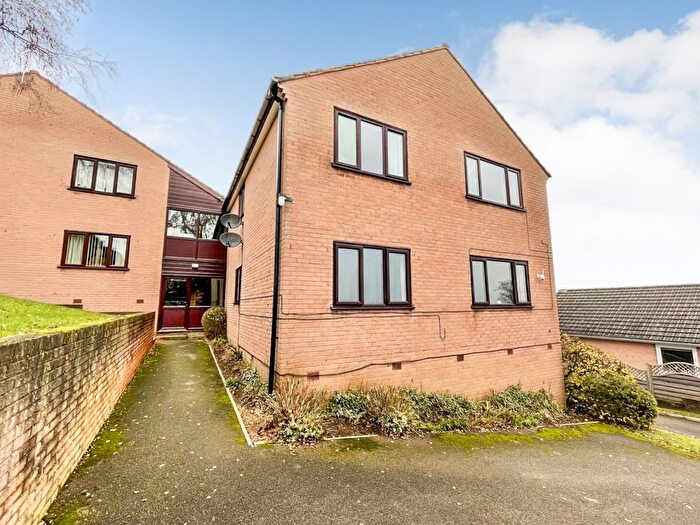
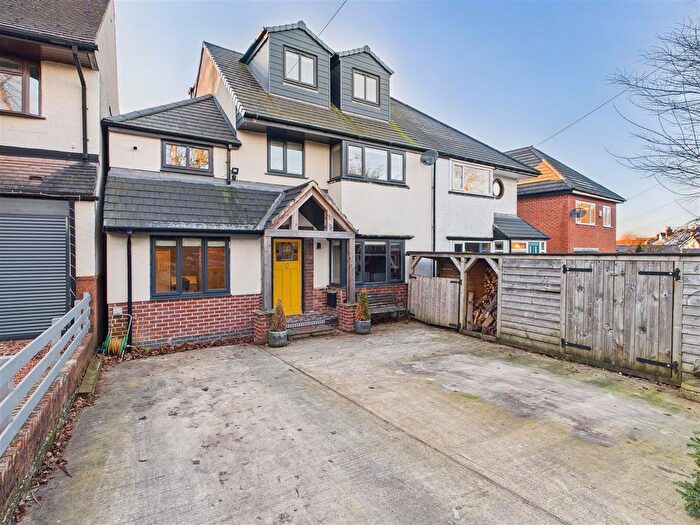
Properties for sale in Dronfield North
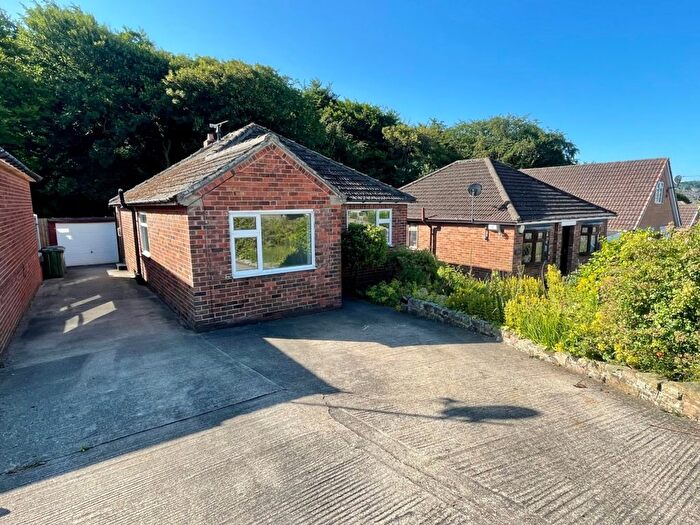
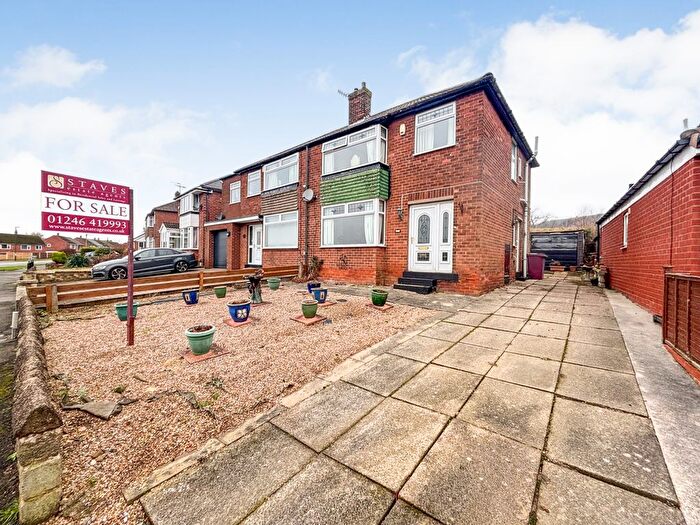
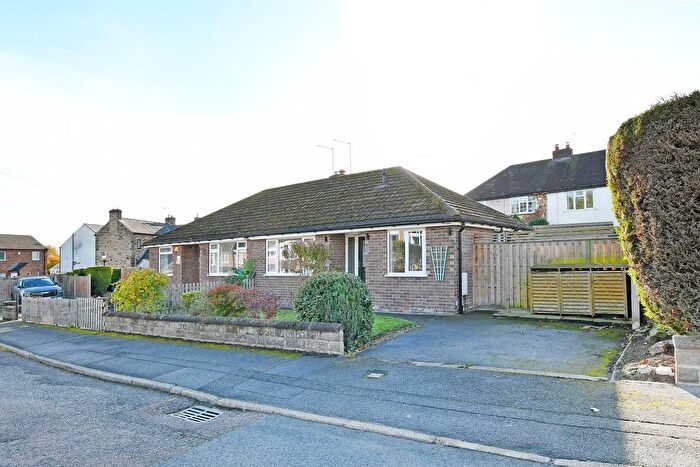
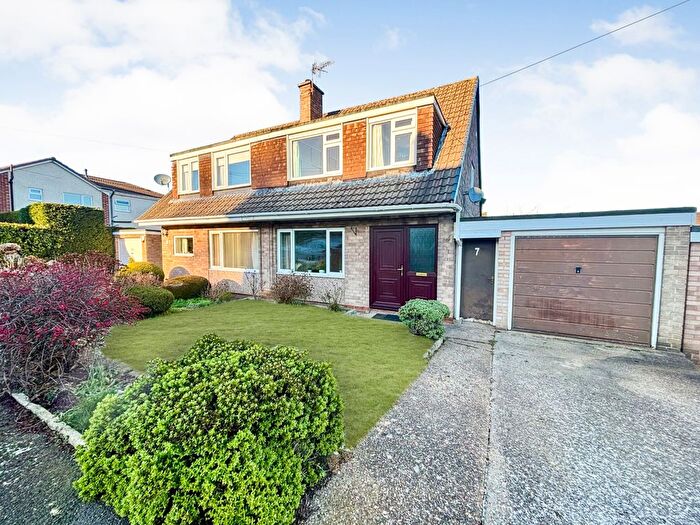
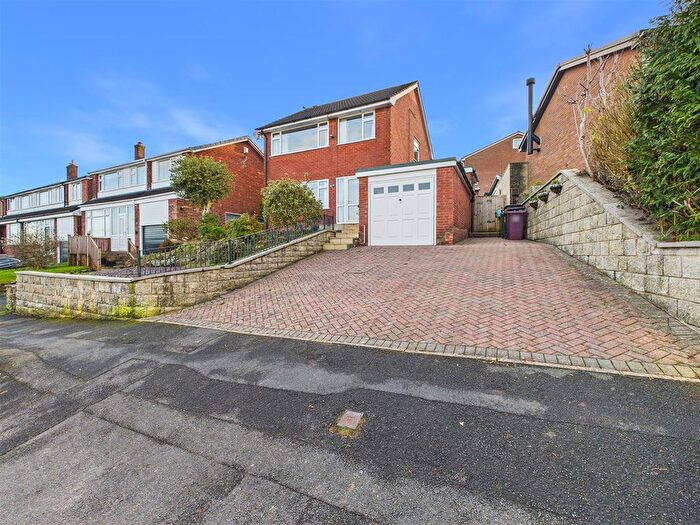
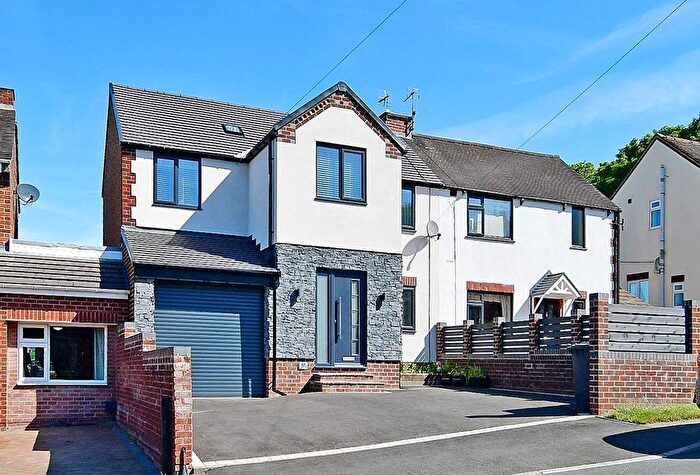
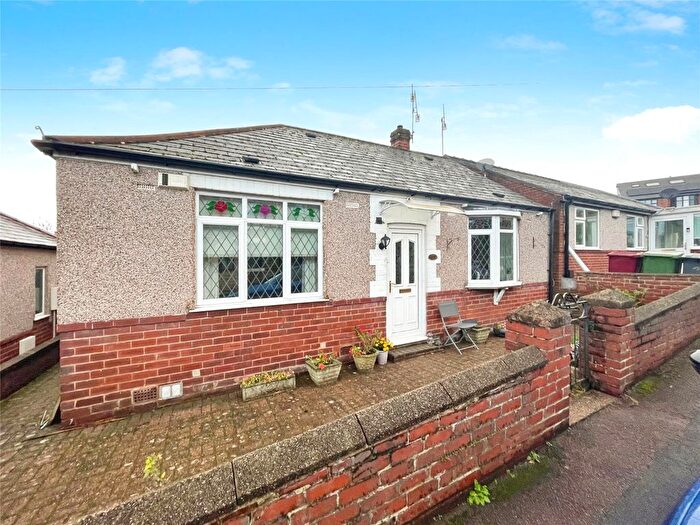
Previously listed properties in Dronfield North
Roads and Postcodes in Dronfield North
Navigate through our locations to find the location of your next house in Dronfield North, Dronfield for sale or to rent.
| Streets | Postcodes |
|---|---|
| Alder Road | S18 2HZ |
| Alexandra Road | S18 2LD |
| Alma Crescent | S18 2HN |
| Avon Close | S18 2FL |
| Beech Way | S18 2HH |
| Birchitt View | S18 2HL |
| Brookview Court | S18 2HT |
| Callywhite Lane | S18 2XP S18 2XR S18 2AA S18 2NS S18 2XJ S18 2XN S18 2XS S18 2XT S18 2XU S18 2XY |
| Cecil Avenue | S18 2GY |
| Cecil Road | S18 2GU S18 2GW S18 2GX |
| Chesterfield Road | S18 2XA S18 2XB S18 2XD |
| Chiverton Close | S18 2GT |
| Deakon Drive | S18 3DJ |
| Derwent Close | S18 2FQ |
| Derwent Road | S18 2FN |
| Egerton Road | S18 2LG |
| Elm Tree Crescent | S18 2HD |
| Fairview Road | S18 2HF S18 2HG |
| Fanshaw Road | S18 2LA S18 2LB |
| Frithwood Drive | S18 2DA |
| Green Cross | S18 2LH |
| Green Lane | S18 2FG S18 2FH S18 2FJ S18 2LL S18 2LN S18 2LP S18 2LZ S18 2FZ S18 2LJ |
| Greendale Court | S18 2FU |
| Haddon Close | S18 2LW |
| Half Acre Lane | S18 4AE |
| Hardwick Close | S18 2LU |
| Hartington Road | S18 2LE S18 2LF S18 2NR |
| Hassop Close | S18 2FX |
| Hawthorn Avenue | S18 2HE |
| Holborn Avenue | S18 2NA |
| Holmley Bank | S18 2HP |
| Holmley Lane | S18 2HQ S18 2HR S18 2HS S18 3DA S18 3DB |
| Marsh Avenue | S18 2HA S18 2HB |
| Mill Lane | S18 2XL |
| Navigation Way | S18 2YA |
| Oakhill Road | S18 2EJ |
| Park Avenue | S18 2LQ |
| Parkgate | S18 2DB |
| Pighills Lane | S18 3BZ |
| Princess Road | S18 2LX S18 2LY |
| Sheffield Road | S18 2DJ S18 2DG S18 2DH S18 2GD S18 2GE S18 2GF S18 2HU |
| Shireoaks Road | S18 2EU |
| Snape Hill | S18 2GH |
| Snape Hill Close | S18 2GS |
| Snape Hill Crescent | S18 2DR S18 2GQ S18 2GR |
| Snape Hill Drive | S18 2FW |
| Snape Hill Gardens | S18 2JB |
| Snape Hill Lane | S18 2GJ S18 2GL S18 2GN S18 2GP |
| Stonelow Green | S18 2ET |
| Stonelow Road | S18 2FY |
| Summerfield Road | S18 2GZ |
| Sycamore Avenue | S18 2HJ |
| The Avenue | S18 2LR S18 2LS |
| The Lawn | S18 2LT |
| Thirlmere Drive | S18 2HW |
| Trent Grove | S18 2FP |
| S18 1ZR S18 7BX S18 7XB S18 8BR S18 9AD S18 9BS S18 9DF S18 9DL S18 9DQ S18 9DS S18 9DU S18 9DW S18 9DX S18 9DY S18 9DZ S18 9EA S18 9EE S18 9EL S18 9EN S18 9EQ S18 9ER S18 9EU S18 9EX |
Transport near Dronfield North
- FAQ
- Price Paid By Year
- Property Type Price
Frequently asked questions about Dronfield North
What is the average price for a property for sale in Dronfield North?
The average price for a property for sale in Dronfield North is £254,605. This amount is 20% lower than the average price in Dronfield. There are 148 property listings for sale in Dronfield North.
What streets have the most expensive properties for sale in Dronfield North?
The streets with the most expensive properties for sale in Dronfield North are Park Avenue at an average of £665,000, Summerfield Road at an average of £382,883 and Princess Road at an average of £359,571.
What streets have the most affordable properties for sale in Dronfield North?
The streets with the most affordable properties for sale in Dronfield North are Stonelow Road at an average of £146,083, Fairview Road at an average of £167,500 and Derwent Close at an average of £191,827.
Which train stations are available in or near Dronfield North?
Some of the train stations available in or near Dronfield North are Dronfield, Dore and Totley and Chesterfield.
Property Price Paid in Dronfield North by Year
The average sold property price by year was:
| Year | Average Sold Price | Price Change |
Sold Properties
|
|---|---|---|---|
| 2025 | £266,573 | 8% |
42 Properties |
| 2024 | £246,478 | -3% |
57 Properties |
| 2023 | £253,959 | -7% |
61 Properties |
| 2022 | £270,468 | 19% |
77 Properties |
| 2021 | £219,716 | -1% |
58 Properties |
| 2020 | £221,047 | 9% |
43 Properties |
| 2019 | £201,881 | -4% |
69 Properties |
| 2018 | £210,165 | 2% |
61 Properties |
| 2017 | £206,827 | 8% |
59 Properties |
| 2016 | £190,800 | 3% |
52 Properties |
| 2015 | £185,355 | -1% |
63 Properties |
| 2014 | £186,304 | 20% |
64 Properties |
| 2013 | £148,282 | -2% |
64 Properties |
| 2012 | £151,529 | -4% |
49 Properties |
| 2011 | £157,671 | 7% |
41 Properties |
| 2010 | £147,169 | 7% |
44 Properties |
| 2009 | £137,555 | -21% |
60 Properties |
| 2008 | £166,345 | -3% |
44 Properties |
| 2007 | £170,875 | -8% |
82 Properties |
| 2006 | £185,238 | 19% |
92 Properties |
| 2005 | £149,992 | 15% |
71 Properties |
| 2004 | £126,850 | 7% |
52 Properties |
| 2003 | £117,573 | 16% |
56 Properties |
| 2002 | £98,914 | 13% |
96 Properties |
| 2001 | £86,521 | 20% |
63 Properties |
| 2000 | £69,036 | 15% |
70 Properties |
| 1999 | £58,602 | -1% |
79 Properties |
| 1998 | £59,478 | 13% |
66 Properties |
| 1997 | £51,759 | -9% |
69 Properties |
| 1996 | £56,282 | 8% |
51 Properties |
| 1995 | £52,028 | - |
44 Properties |
Property Price per Property Type in Dronfield North
Here you can find historic sold price data in order to help with your property search.
The average Property Paid Price for specific property types in the last three years are:
| Property Type | Average Sold Price | Sold Properties |
|---|---|---|
| Semi Detached House | £247,529.00 | 75 Semi Detached Houses |
| Detached House | £392,593.00 | 30 Detached Houses |
| Terraced House | £206,600.00 | 39 Terraced Houses |
| Flat | £146,062.00 | 16 Flats |

