Houses for sale & to rent in Unstone, Dronfield
House Prices in Unstone
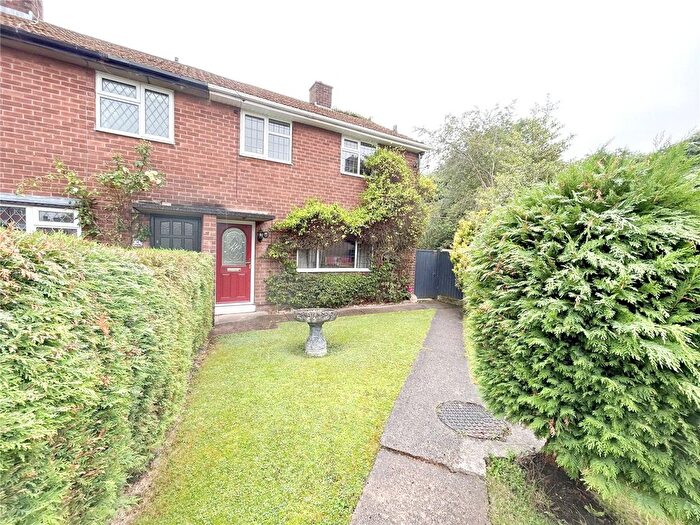
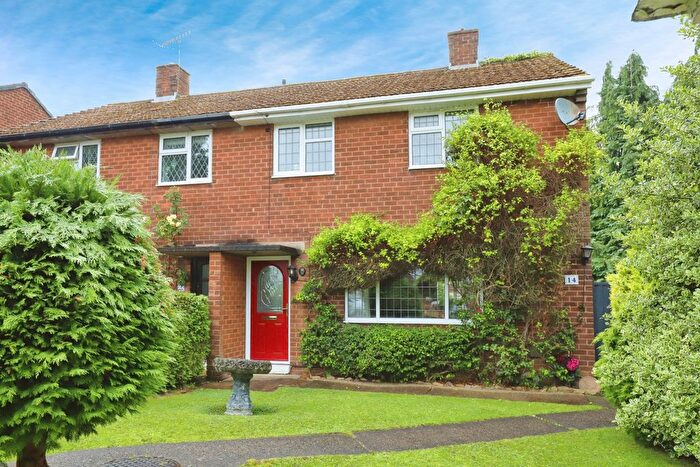
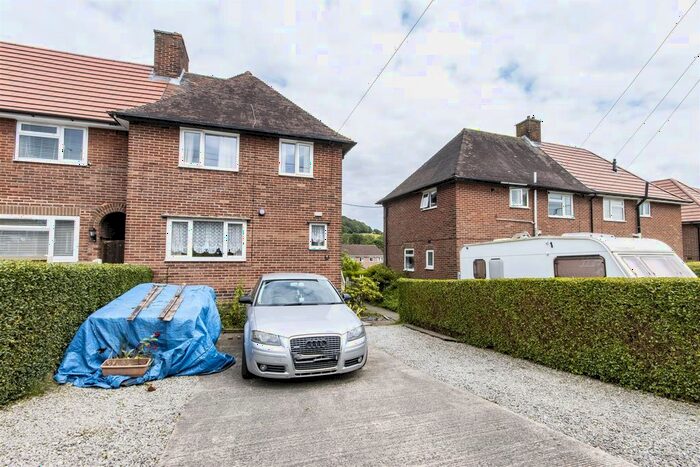
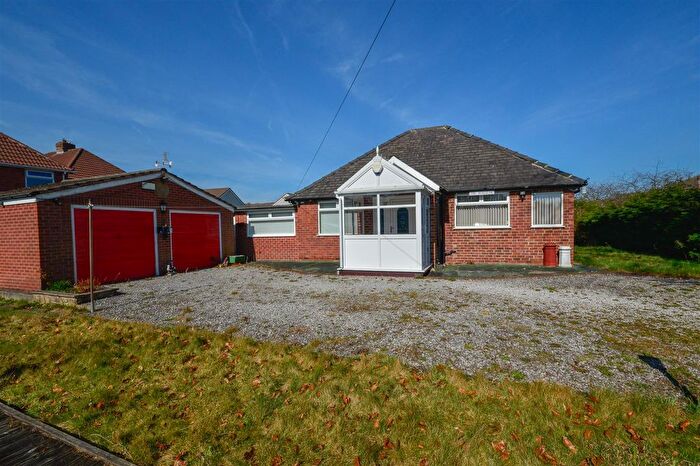
Properties in Unstone have an average house price of £325,282.00 and had 41 Property Transactions within the last 3 years¹.
Unstone is an area in Dronfield, Derbyshire with 740 households², where the most expensive property was sold for £1,000,000.00.
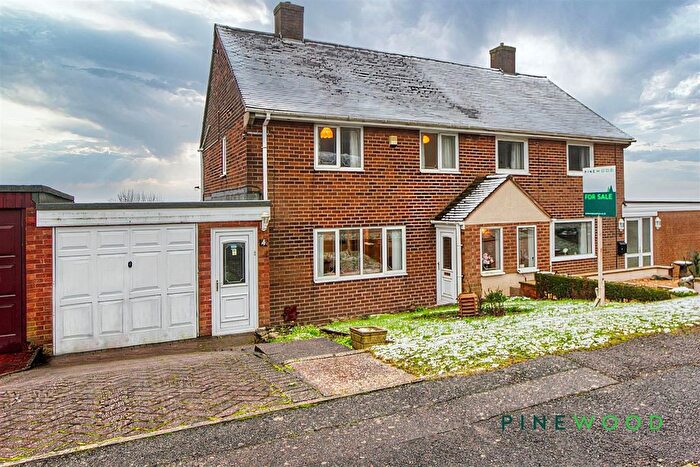
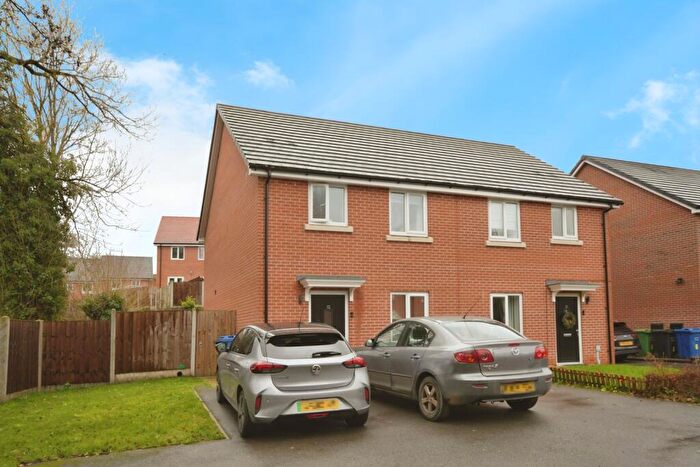
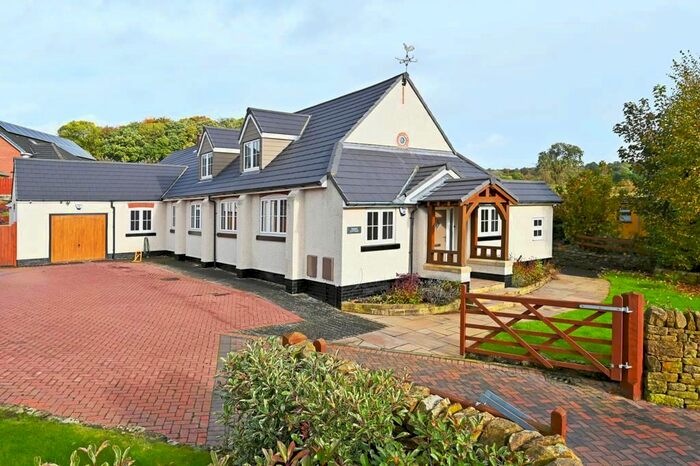
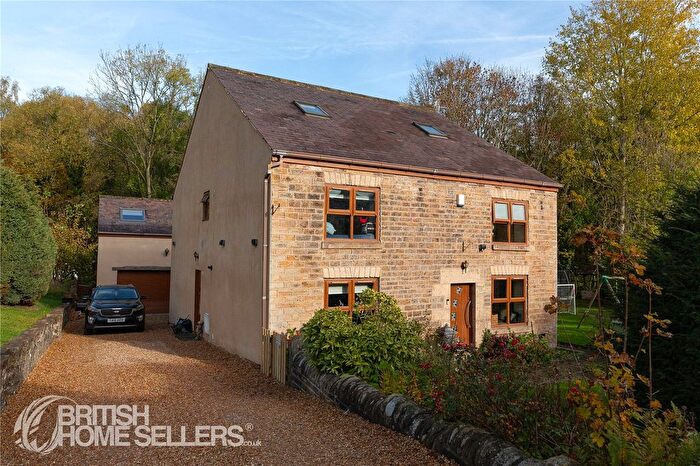
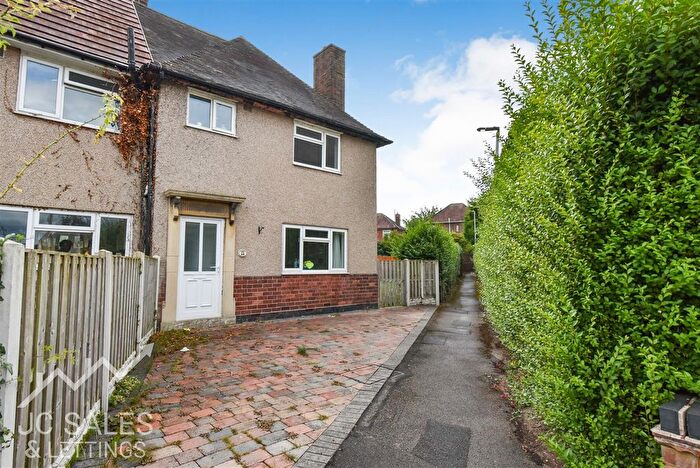
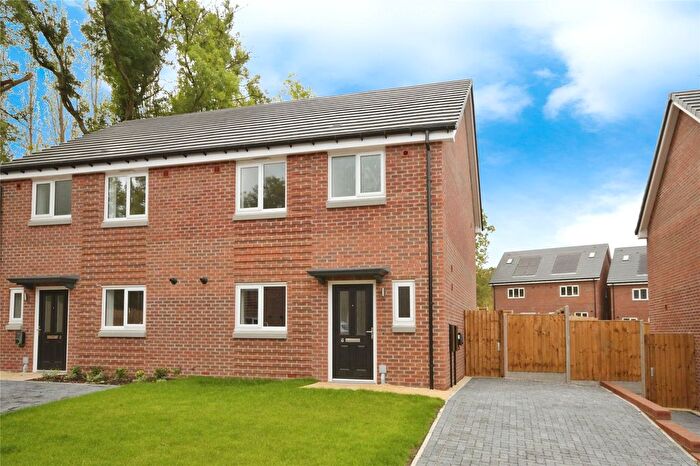
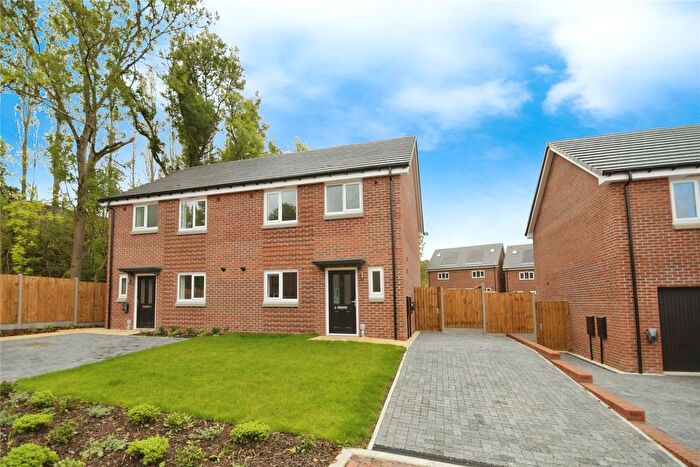
Properties for sale in Unstone
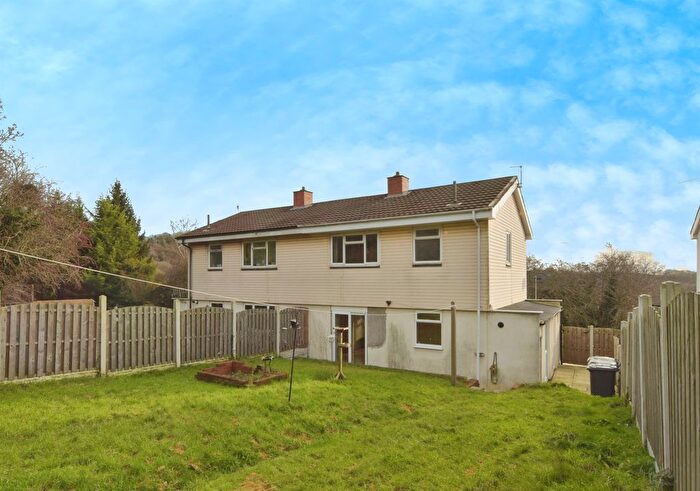
Previously listed properties in Unstone
Roads and Postcodes in Unstone
Navigate through our locations to find the location of your next house in Unstone, Dronfield for sale or to rent.
| Streets | Postcodes |
|---|---|
| Alice Way | S18 4DN |
| Back Lane | S18 4BU |
| Back Road | S18 4AR |
| Barrack Road | S18 4AU |
| Birch Holt Grove | S18 4DH |
| Brierley Road | S18 4DF |
| Central Close | S18 4DW |
| Chapel Lane | S18 4AZ |
| Cheetham Avenue | S18 4DL |
| Church Street | S18 4AG |
| Crow Lane | S18 4AL S18 4AN S18 4AS |
| Gipsy Lane | S18 4AX |
| Green Close | S18 4DU |
| Hardhurst Road | S18 4DS |
| Hawley Street | S18 4AY |
| Hundall | S18 4BS |
| Hundall Lane | S18 4BP |
| Loundes Road | S18 4DE |
| Main Road | S18 4AB S18 4AQ S18 4BR |
| Mill Lane | S18 4DD |
| Moorland View | S18 4BL |
| Moortop Road | S18 4BN |
| New Road | S18 4AT |
| North Close | S18 4DX |
| Old Whittington Lane | S18 4DR |
| Quarry Road | S18 4AW |
| Ramshaw Road | S18 4DG |
| Robert Close | S18 4DJ |
| Sharman Close | S18 4BH |
| Sharman Walk | S18 4BJ |
| Sheffield Road | S18 4DA S18 4DB |
| South Close | S18 4DT |
| Springbank | S18 4AD |
| St Johns Road | S18 4AH S18 4AJ |
| Summerley | S18 4BA S18 4BW |
| Summerley Lower Road | S18 4BB |
| Sylvia Road | S18 4DP |
| The Mount | S18 4BD |
| Town End | S18 4BG |
| Whittington Lane | S18 4DQ |
| Windmill Lane | S18 4BQ S18 4BT |
Transport near Unstone
- FAQ
- Price Paid By Year
- Property Type Price
Frequently asked questions about Unstone
What is the average price for a property for sale in Unstone?
The average price for a property for sale in Unstone is £325,282. This amount is 2% higher than the average price in Dronfield. There are 43 property listings for sale in Unstone.
What streets have the most expensive properties for sale in Unstone?
The streets with the most expensive properties for sale in Unstone are Back Lane at an average of £650,000, Hundall at an average of £632,500 and New Road at an average of £560,000.
What streets have the most affordable properties for sale in Unstone?
The streets with the most affordable properties for sale in Unstone are Green Close at an average of £147,000, Hardhurst Road at an average of £163,500 and Cheetham Avenue at an average of £177,500.
Which train stations are available in or near Unstone?
Some of the train stations available in or near Unstone are Dronfield, Chesterfield and Dore and Totley.
Property Price Paid in Unstone by Year
The average sold property price by year was:
| Year | Average Sold Price | Price Change |
Sold Properties
|
|---|---|---|---|
| 2025 | £288,300 | -5% |
10 Properties |
| 2024 | £304,000 | -21% |
15 Properties |
| 2023 | £368,350 | 25% |
16 Properties |
| 2022 | £275,919 | -16% |
23 Properties |
| 2021 | £320,039 | -4% |
27 Properties |
| 2020 | £332,227 | 34% |
9 Properties |
| 2019 | £218,047 | -30% |
21 Properties |
| 2018 | £284,463 | 15% |
15 Properties |
| 2017 | £242,365 | 10% |
16 Properties |
| 2016 | £219,318 | -0,2% |
18 Properties |
| 2015 | £219,793 | 12% |
16 Properties |
| 2014 | £193,452 | -10% |
18 Properties |
| 2013 | £213,614 | -5% |
17 Properties |
| 2012 | £224,055 | 15% |
17 Properties |
| 2011 | £189,826 | 10% |
13 Properties |
| 2010 | £170,031 | 2% |
11 Properties |
| 2009 | £166,950 | 12% |
11 Properties |
| 2008 | £147,681 | -3% |
10 Properties |
| 2007 | £152,240 | -32% |
20 Properties |
| 2006 | £201,041 | 7% |
34 Properties |
| 2005 | £187,344 | 33% |
17 Properties |
| 2004 | £125,418 | -4% |
16 Properties |
| 2003 | £130,472 | 31% |
21 Properties |
| 2002 | £90,321 | 32% |
25 Properties |
| 2001 | £61,141 | -26% |
23 Properties |
| 2000 | £76,843 | 7% |
24 Properties |
| 1999 | £71,829 | 12% |
16 Properties |
| 1998 | £62,946 | -1% |
15 Properties |
| 1997 | £63,342 | -6% |
17 Properties |
| 1996 | £67,281 | -13% |
16 Properties |
| 1995 | £76,246 | - |
16 Properties |
Property Price per Property Type in Unstone
Here you can find historic sold price data in order to help with your property search.
The average Property Paid Price for specific property types in the last three years are:
| Property Type | Average Sold Price | Sold Properties |
|---|---|---|
| Semi Detached House | £207,363.00 | 11 Semi Detached Houses |
| Detached House | £518,875.00 | 16 Detached Houses |
| Terraced House | £201,815.00 | 13 Terraced Houses |
| Flat | £130,000.00 | 1 Flat |

