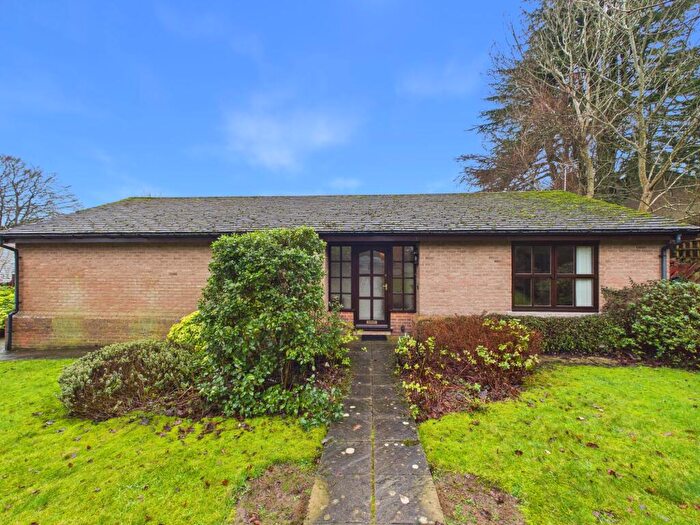
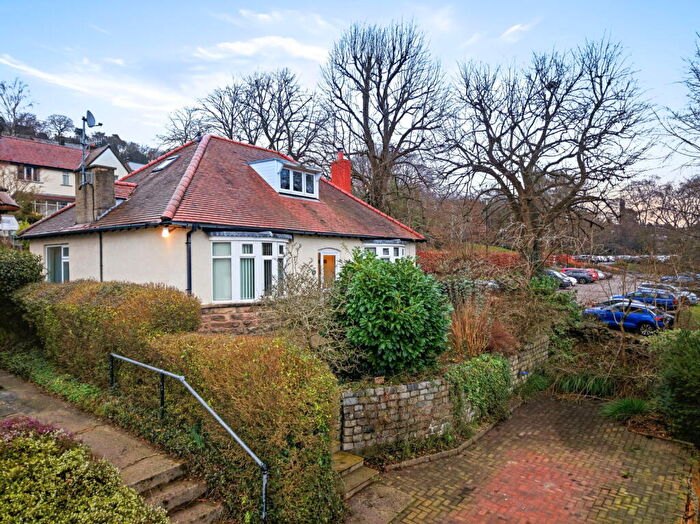
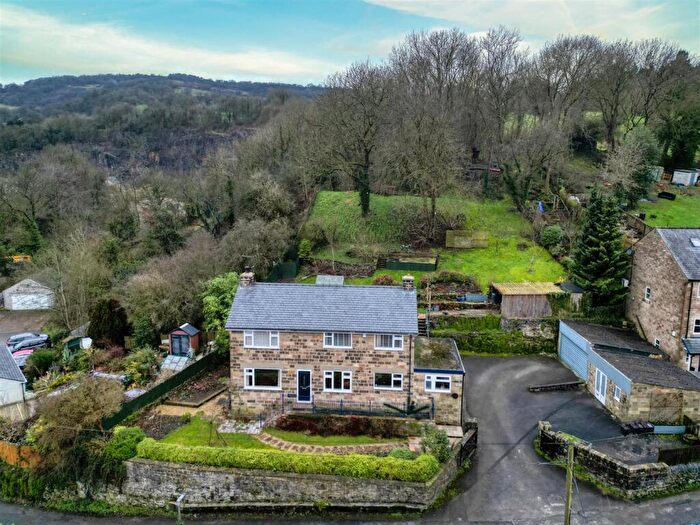
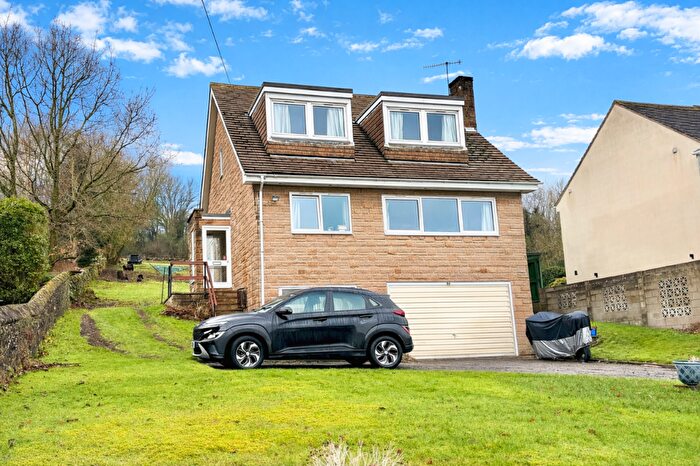
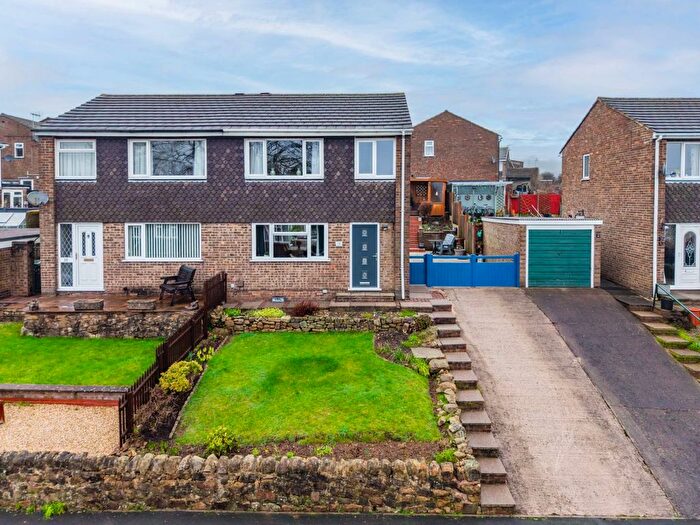
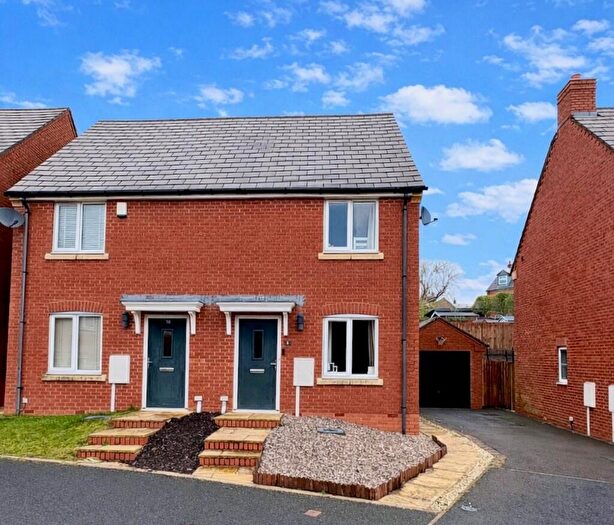
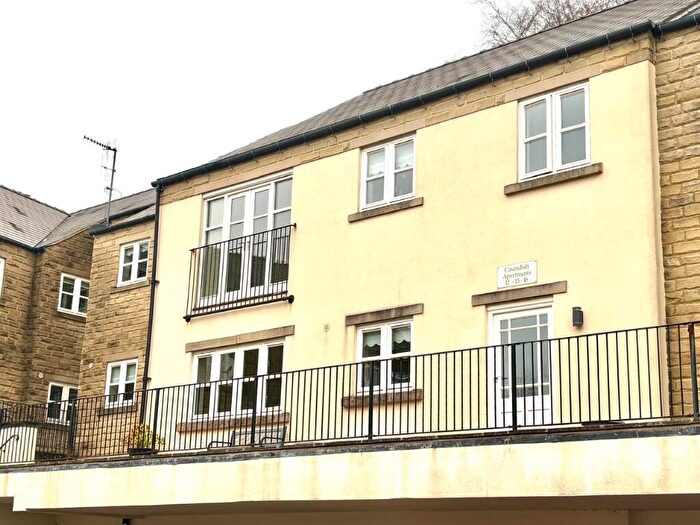
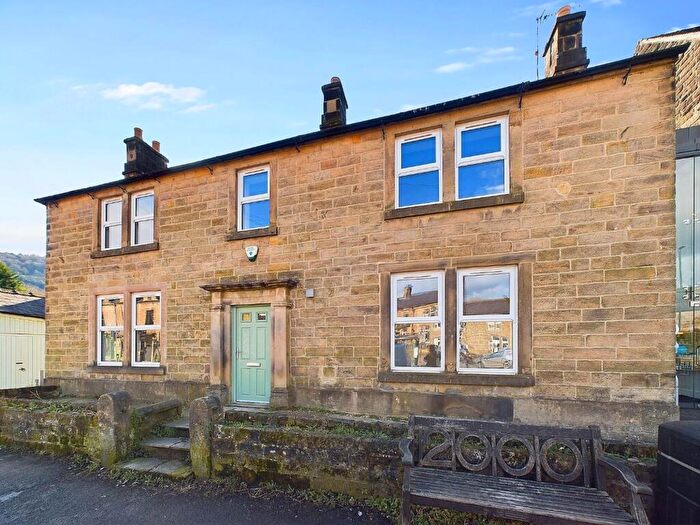
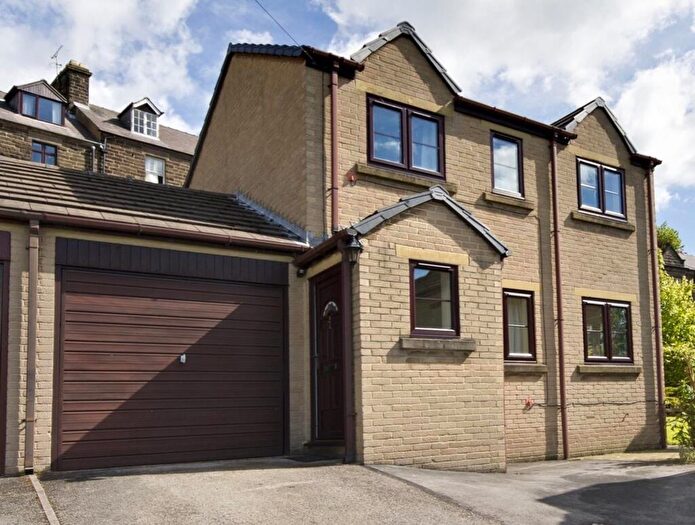
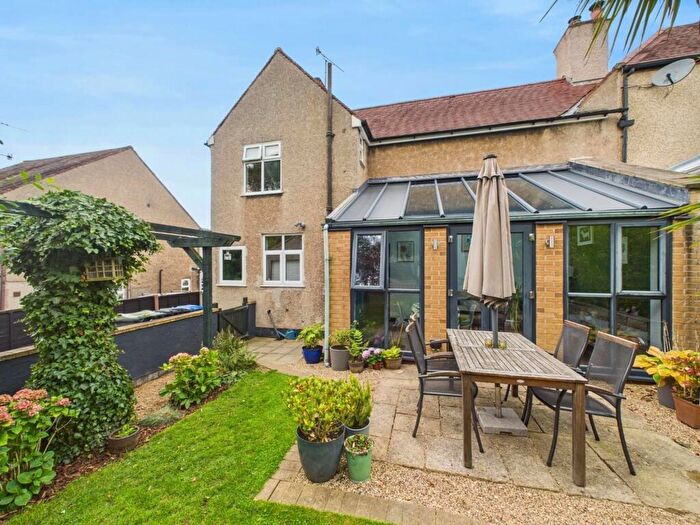
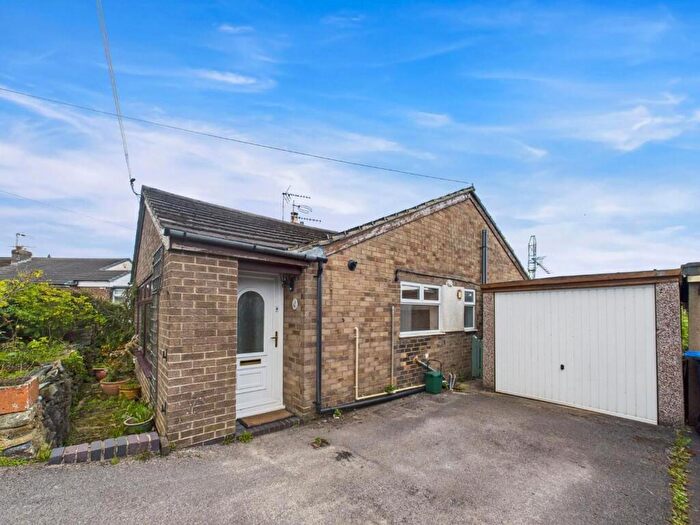
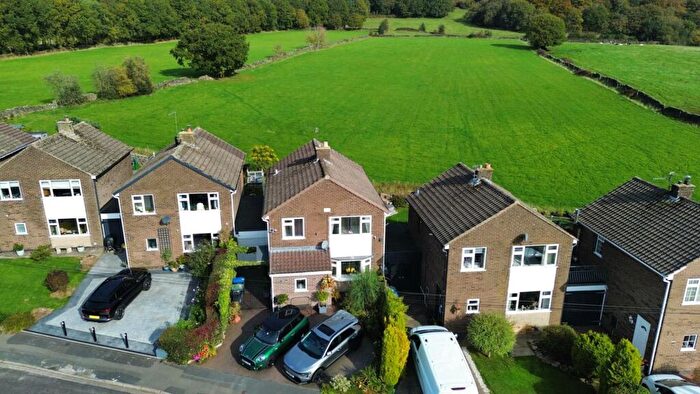
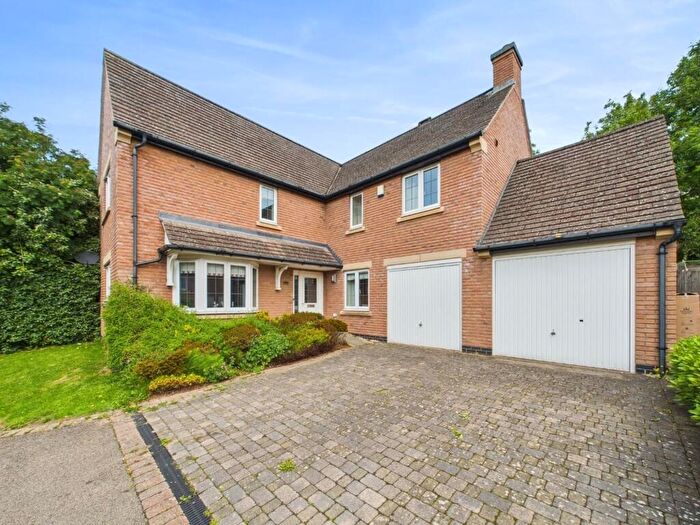
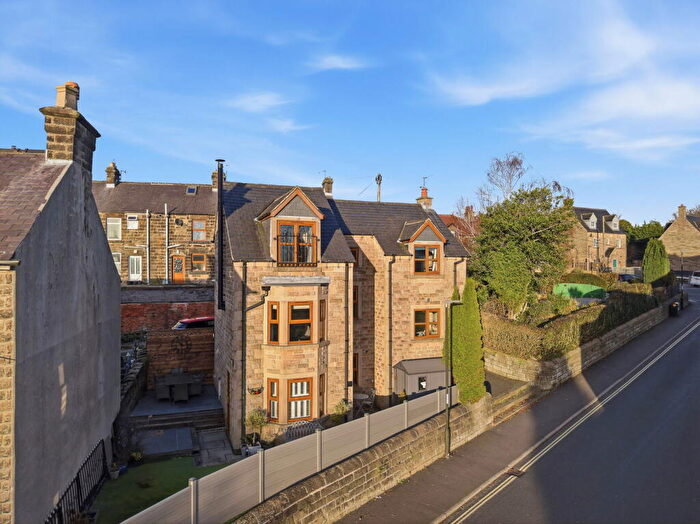
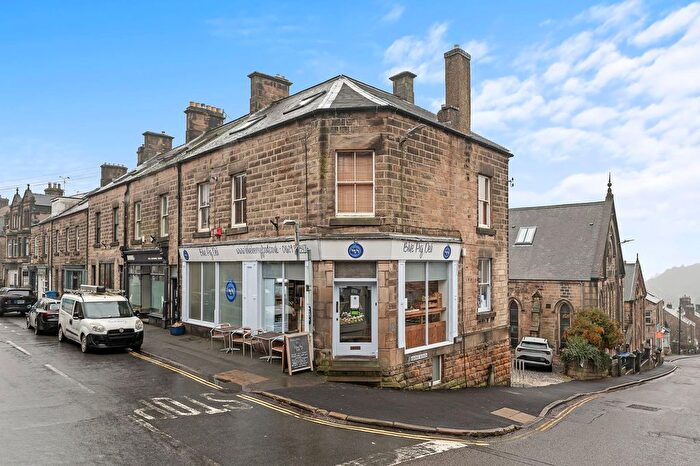
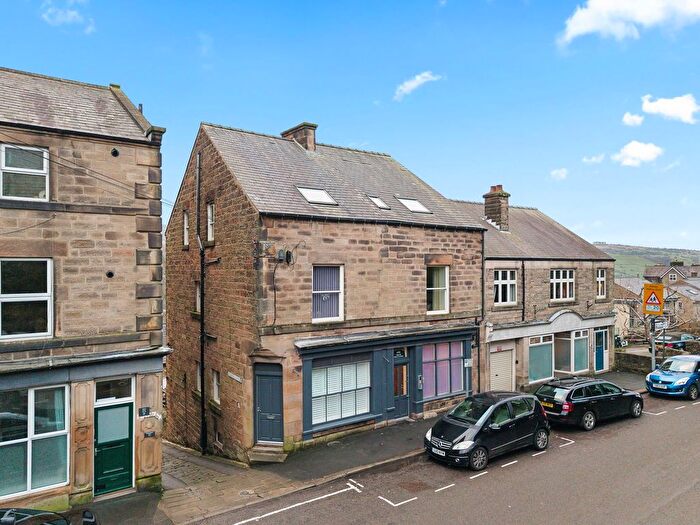
Houses for sale & to rent in Matlock All Saints, Matlock
House Prices in Matlock All Saints
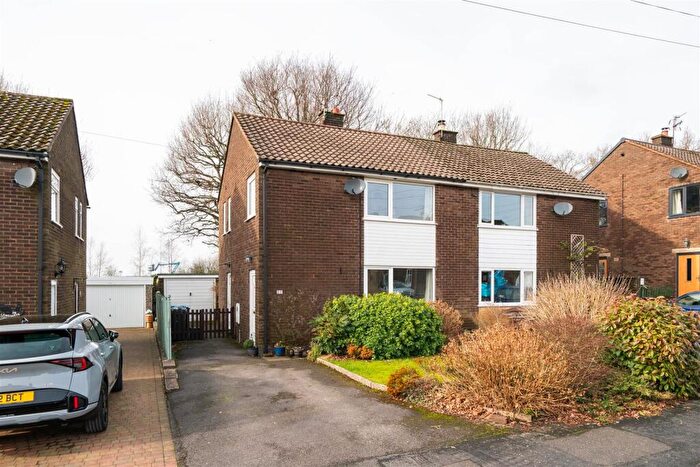
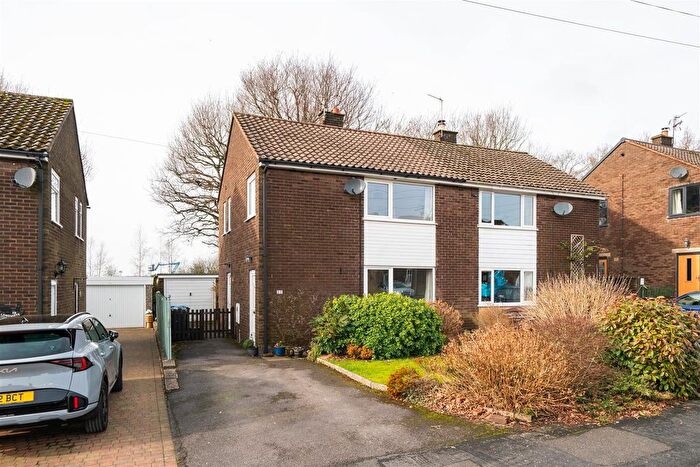
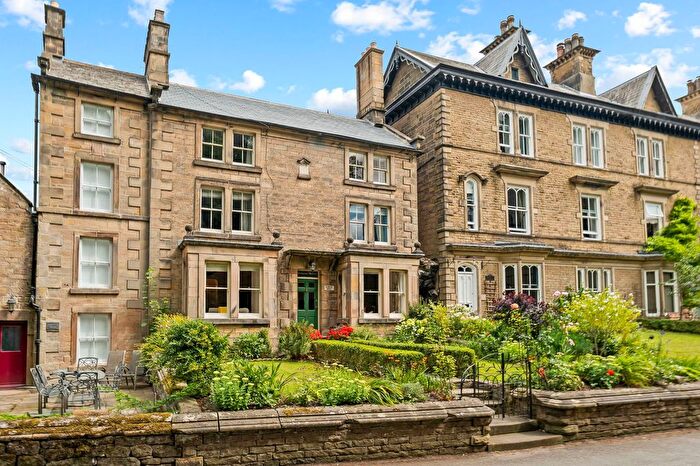
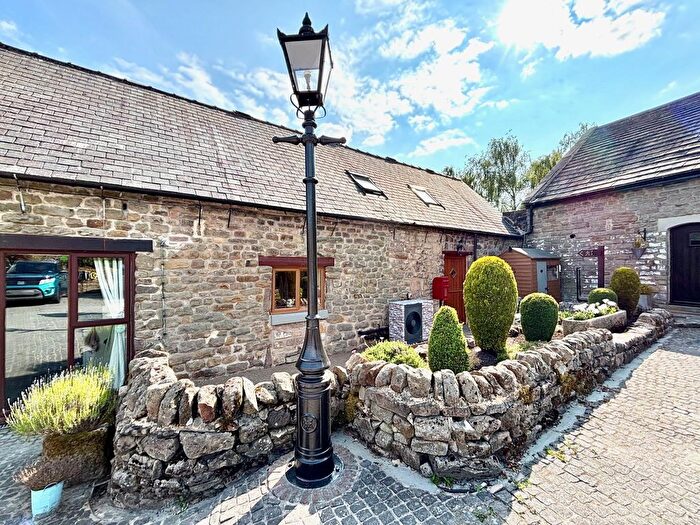
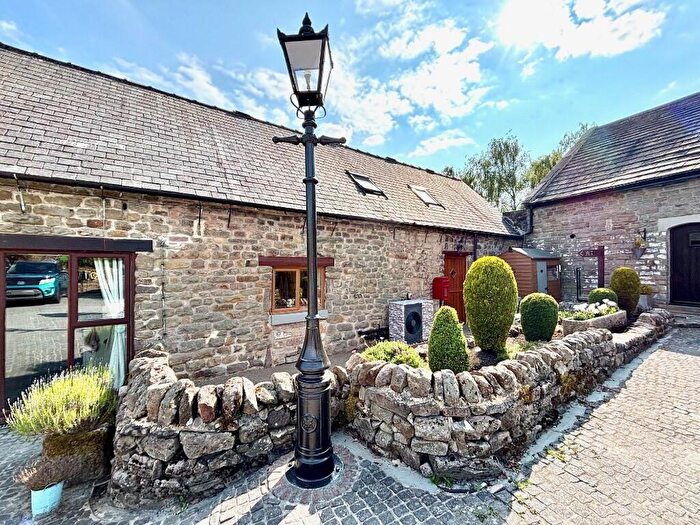
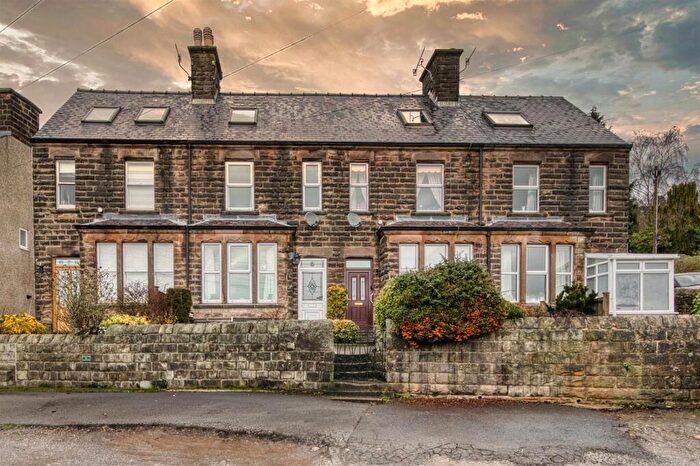
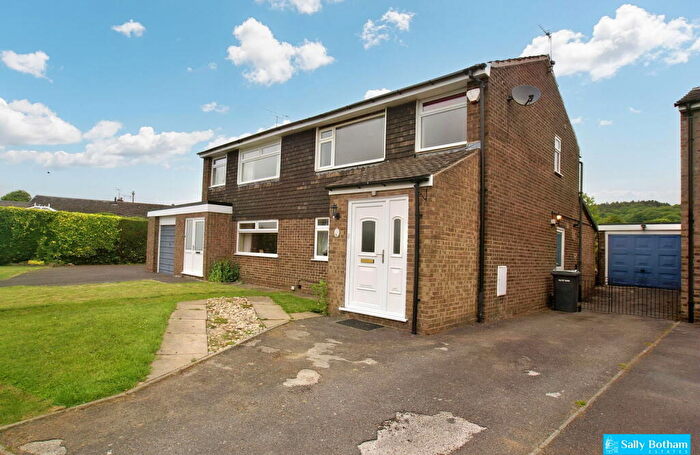
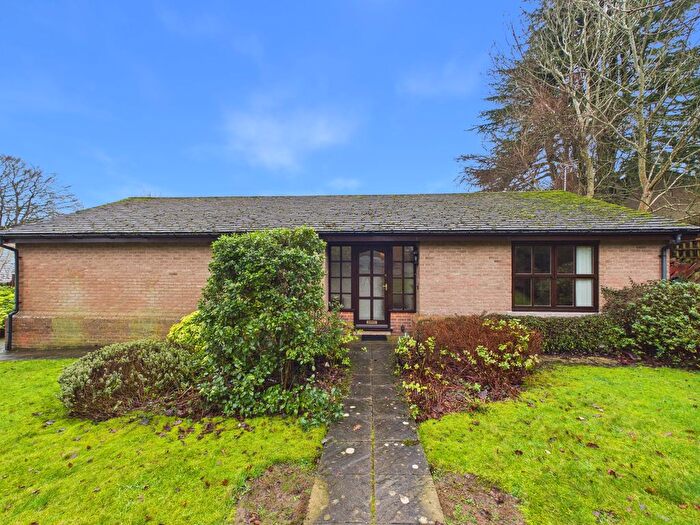
Properties in Matlock All Saints have an average house price of £282,632.00 and had 272 Property Transactions within the last 3 years¹.
Matlock All Saints is an area in Matlock, Derbyshire with 2,449 households², where the most expensive property was sold for £760,000.00.
Properties for sale in Matlock All Saints
Roads and Postcodes in Matlock All Saints
Navigate through our locations to find the location of your next house in Matlock All Saints, Matlock for sale or to rent.
| Streets | Postcodes |
|---|---|
| Acorn Ridge | DE4 3TT |
| All Saints Road | DE4 3HW |
| Allen Hill | DE4 3LR |
| Amberdene | DE4 3HR |
| Bakewell Road | DE4 3AU DE4 3AZ |
| Bank Gardens | DE4 3WA |
| Bank Road | DE4 3GL DE4 3NF DE4 3AA DE4 3AQ DE4 3NN DE4 9SA DE4 9SB DE4 9SD DE4 9SE DE4 9SF DE4 9SG DE4 9SH DE4 9SJ DE4 9SL DE4 9SN DE4 9SP DE4 9SQ DE4 9SS DE4 9ST DE4 9SU DE4 9SW DE4 9SX DE4 9SY DE4 9SZ DE4 9TA DE4 9TB DE4 9TD DE4 9TE DE4 9TF DE4 9TG DE4 9TH DE4 9TJ DE4 9TL DE4 9TN DE4 9ZY DE4 9ZZ |
| Barn Close | DE4 3TU |
| Bent Lane | DE4 3HL |
| Bentley Close | DE4 3GF |
| Bidston Close | DE4 3PZ |
| Buckley Drive | DE4 5PN |
| Cardinshaw Road | DE4 5PX |
| Carson Croft | DE4 3GR |
| Causeway Lane | DE4 3AP DE4 3AR |
| Cavendish Road | DE4 3FN DE4 3GY DE4 3HD DE4 3HE DE4 3RX |
| Cawdor Way | DE4 3SP |
| Chesterfield Road | DE4 3DQ DE4 3FS DE4 3GA DE4 5LE DE4 3FW |
| Cobden Road | DE4 3JR |
| Collingwood Crescent | DE4 3TB |
| Crook Stile | DE4 3LJ |
| Crown Square | DE4 3AT |
| Dale Road | DE4 3LT DE4 3LU DE4 3LW DE4 3NB DE4 3RD |
| Dalesfield | DE4 3LS |
| Daysmill Close | DE4 3NP |
| Derwent Avenue | DE4 3LX |
| Dimple Crescent | DE4 3PJ |
| Dimple Road | DE4 3HX DE4 3JX |
| Drabbles Road | DE4 3LD |
| Dudleys Yard | DE4 3PL |
| Edge Road | DE4 3NH |
| Edgefold Road | DE4 3NJ |
| Far Cross | DE4 3HG |
| Far Green | DE4 3JF |
| Farm Lane | DE4 3GZ |
| Firs Parade | DE4 3AS |
| Gateway Court | DE4 3TJ DE4 3TL DE4 3TP DE4 3TW |
| George Road | DE4 3HA |
| Green Close | DE4 3AB |
| Gritstone Road | DE4 3GB DE4 3GD |
| Heathfield | DE4 3HQ |
| Henry Avenue | DE4 3FL |
| High Court | DE4 3JL |
| High Ridge | DE4 3HP |
| Holt Lane | DE4 3LY |
| Hopewell Road | DE4 3JN |
| Hurds Hollow | DE4 3JZ DE4 3LA |
| Hurker Rise | DE4 3GG |
| Imperial Road | DE4 3NL |
| Jackson Road | DE4 3JQ |
| Jackson Tor Road | DE4 3JS |
| John Street | DE4 3JE |
| Lilybank Close | DE4 3EH |
| Lime Grove Avenue | DE4 3FG |
| Lime Grove Walk | DE4 3FD |
| Limestone Croft | DE4 3SW |
| Malpas Road | DE4 3HT |
| Malvern Gardens | DE4 3JH |
| Megdale | DE4 3JW DE4 3TE |
| Moor Croft | DE4 5LL |
| Moorfield | DE4 3HF |
| New Street | DE4 3DN DE4 3FE DE4 3FH |
| Oak Road | DE4 3FJ |
| Olde Englishe Road | DE4 3RR DE4 3SX |
| Paxton Close | DE4 3TD |
| Pinewood Road | DE4 3HN |
| Pope Carr Road | DE4 3FF |
| Prospect Drive | DE4 3TA |
| River Walk | DE4 3SU |
| Rockside Hall | DE4 3JB |
| Rockside Steps | DE4 3HB |
| Rockside View | DE4 3GP |
| Rutland Avenue | DE4 3GQ DE4 3GU |
| Rutland Gate Close | DE4 3LQ |
| Rutland Street | DE4 3GN |
| Salters Lane | DE4 2PA |
| Sandy Lane | DE4 5LD |
| Sheriff Drive | DE4 3JT |
| Smedley Street | DE4 3JA DE4 3JD DE4 3JG DE4 3JJ DE4 3LH |
| Smedley Street East | DE4 3FQ DE4 3GH |
| Snitterton Road | DE4 3LZ |
| Springfield Rise | DE4 3QA DE4 3QB |
| St Joseph Street | DE4 3NG DE4 3FB |
| Station Yard | DE4 3NA |
| Sycamore Road | DE4 3HZ |
| The Beeches | DE4 3EZ |
| The Close | DE4 3LE |
| Tinkers Place | DE4 3SR |
| Upland Drive | DE4 3SF |
| Upper Greenhill Gardens | DE4 3GT |
| Victoria Hall Gardens | DE4 3SQ |
| Wellfield Court | DE4 3GJ |
| Wellington Close | DE4 3GE |
| Wellington Mews | DE4 3LG |
| Wellington Street | DE4 3GS DE4 3GW DE4 3GX DE4 3JP DE4 3RW |
| West Crescent | DE4 3LB |
| White Rock Court | DE4 3JY |
| Wilmot Street | DE4 3HY |
| Woburn Cottages | DE4 3LF |
| Wolds Rise | DE4 3HH DE4 3HJ |
| Woolley Road | DE4 3HS DE4 3HU |
| Wyvern Close | DE4 3JU |
| DE4 9EH DE4 9EL DE4 9EP DE4 9EQ DE4 2ZQ DE4 3AG DE4 3AH DE4 3FR DE4 3WP DE4 3WU DE4 3XF DE4 3XU DE4 3XW DE4 3YH DE4 3YS DE4 5PY DE4 5ZP DE4 5ZU DE4 9AD DE4 9BR DE4 9DB DE4 9DX DE4 9DY DE4 9EA DE4 9EE |
Transport near Matlock All Saints
- FAQ
- Price Paid By Year
- Property Type Price
Frequently asked questions about Matlock All Saints
What is the average price for a property for sale in Matlock All Saints?
The average price for a property for sale in Matlock All Saints is £282,632. This amount is 13% lower than the average price in Matlock. There are 599 property listings for sale in Matlock All Saints.
What streets have the most expensive properties for sale in Matlock All Saints?
The streets with the most expensive properties for sale in Matlock All Saints are Woburn Cottages at an average of £557,500, Buckley Drive at an average of £525,000 and Moor Croft at an average of £522,500.
What streets have the most affordable properties for sale in Matlock All Saints?
The streets with the most affordable properties for sale in Matlock All Saints are Dale Road at an average of £91,000, Wellington Mews at an average of £109,000 and High Court at an average of £125,000.
Which train stations are available in or near Matlock All Saints?
Some of the train stations available in or near Matlock All Saints are Matlock, Matlock Bath and Cromford.
Property Price Paid in Matlock All Saints by Year
The average sold property price by year was:
| Year | Average Sold Price | Price Change |
Sold Properties
|
|---|---|---|---|
| 2025 | £290,050 | 2% |
79 Properties |
| 2024 | £282,934 | 2% |
99 Properties |
| 2023 | £276,080 | -7% |
94 Properties |
| 2022 | £294,618 | 8% |
97 Properties |
| 2021 | £271,657 | 15% |
125 Properties |
| 2020 | £230,343 | -0,4% |
106 Properties |
| 2019 | £231,341 | -3% |
85 Properties |
| 2018 | £237,158 | 5% |
128 Properties |
| 2017 | £225,559 | 14% |
112 Properties |
| 2016 | £193,499 | -4% |
110 Properties |
| 2015 | £201,578 | 5% |
125 Properties |
| 2014 | £192,154 | -2% |
123 Properties |
| 2013 | £195,599 | 3% |
102 Properties |
| 2012 | £189,744 | 5% |
92 Properties |
| 2011 | £180,190 | -9% |
70 Properties |
| 2010 | £196,274 | 17% |
87 Properties |
| 2009 | £162,276 | -14% |
75 Properties |
| 2008 | £184,204 | -12% |
79 Properties |
| 2007 | £206,471 | 7% |
112 Properties |
| 2006 | £192,438 | 4% |
151 Properties |
| 2005 | £184,922 | 9% |
103 Properties |
| 2004 | £168,331 | 16% |
110 Properties |
| 2003 | £141,125 | 19% |
119 Properties |
| 2002 | £114,375 | 14% |
142 Properties |
| 2001 | £98,708 | 20% |
126 Properties |
| 2000 | £78,767 | -1% |
110 Properties |
| 1999 | £79,424 | 5% |
142 Properties |
| 1998 | £75,468 | 19% |
121 Properties |
| 1997 | £60,862 | -3% |
125 Properties |
| 1996 | £62,509 | 7% |
111 Properties |
| 1995 | £58,139 | - |
79 Properties |
Property Price per Property Type in Matlock All Saints
Here you can find historic sold price data in order to help with your property search.
The average Property Paid Price for specific property types in the last three years are:
| Property Type | Average Sold Price | Sold Properties |
|---|---|---|
| Flat | £180,078.00 | 32 Flats |
| Semi Detached House | £272,012.00 | 95 Semi Detached Houses |
| Detached House | £418,512.00 | 67 Detached Houses |
| Terraced House | £220,922.00 | 78 Terraced Houses |

