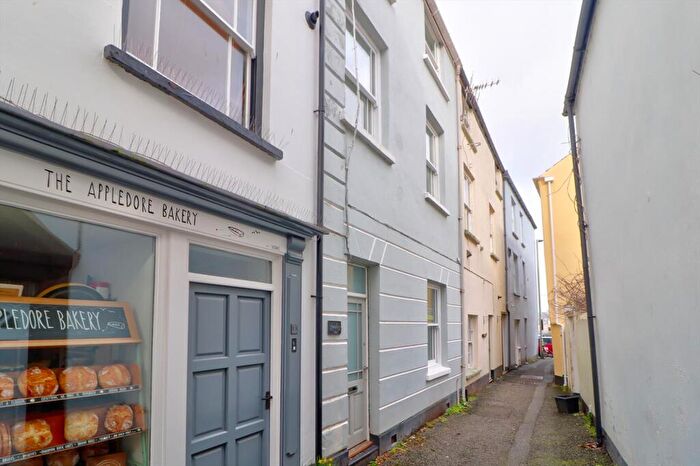
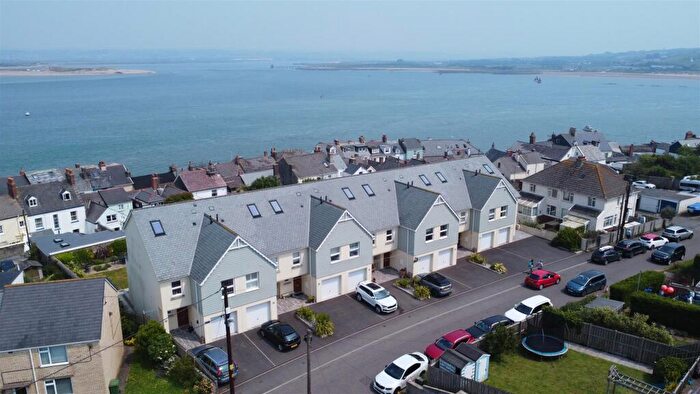
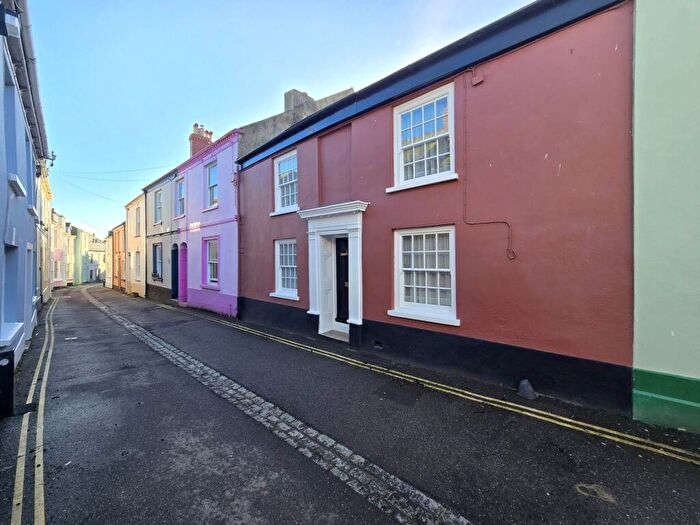
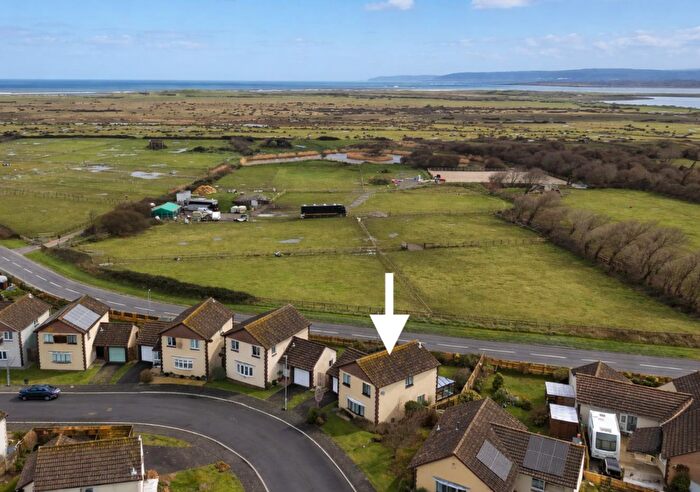
Houses for sale & to rent in Appledore, Bideford
House Prices in Appledore
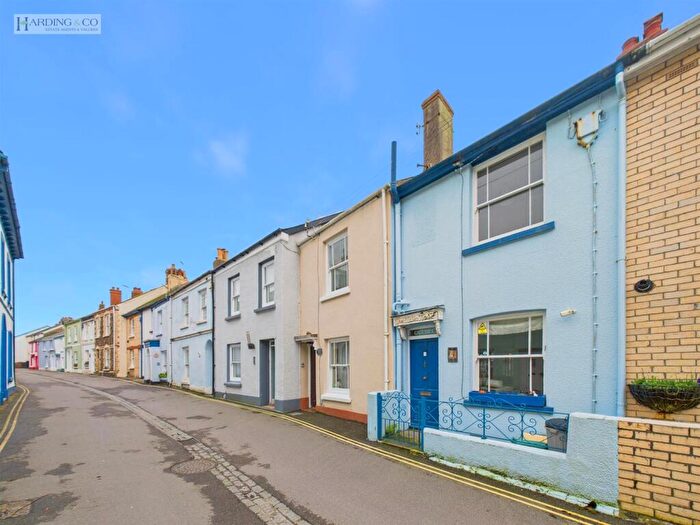
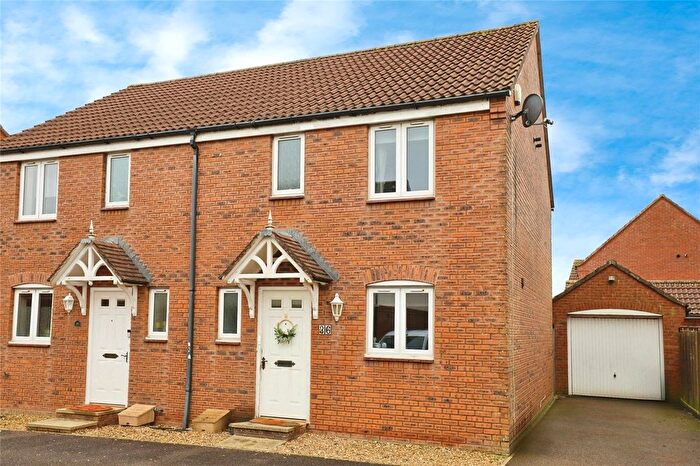
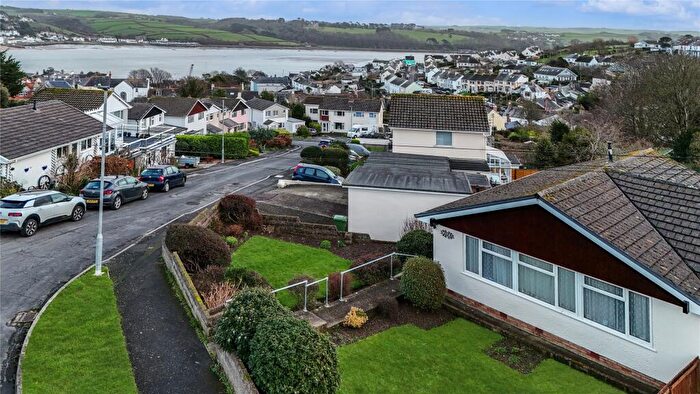
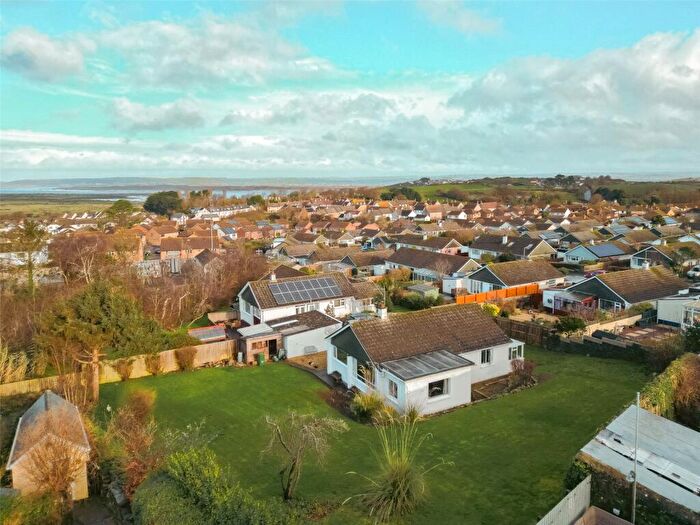
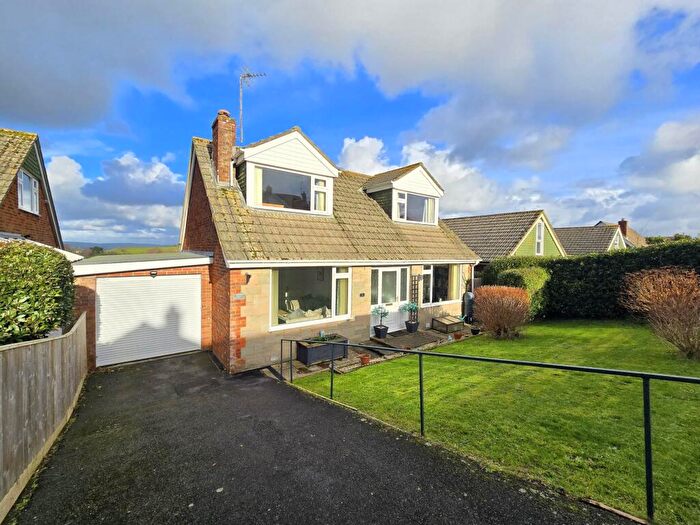
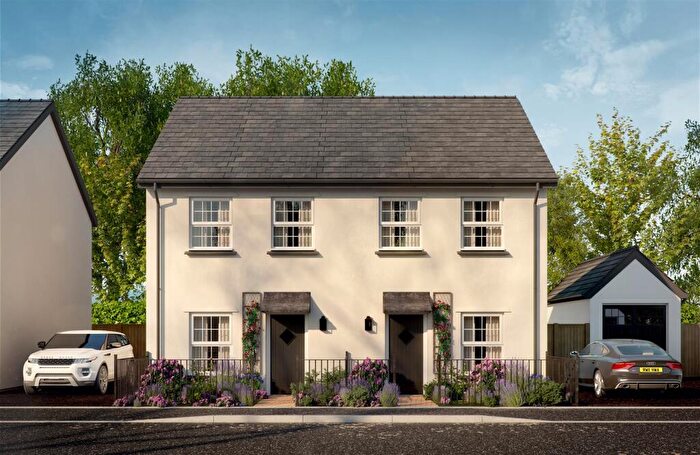
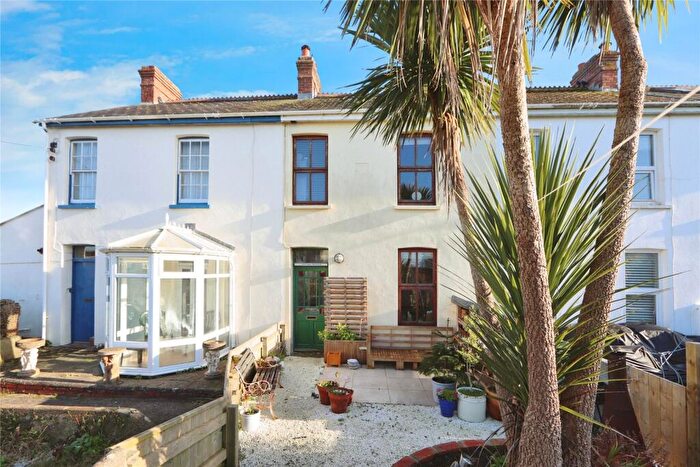
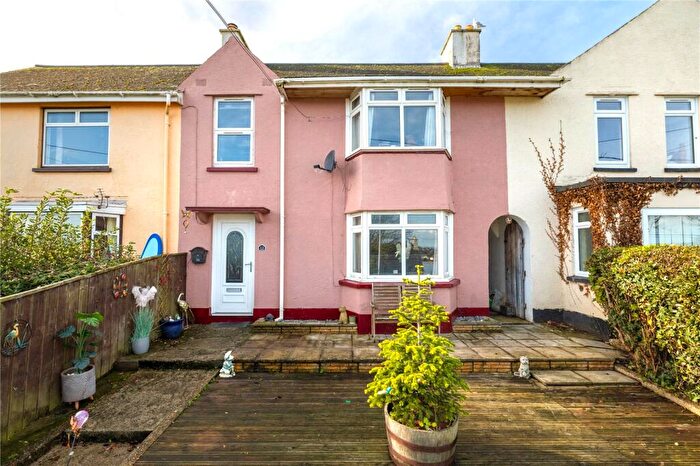
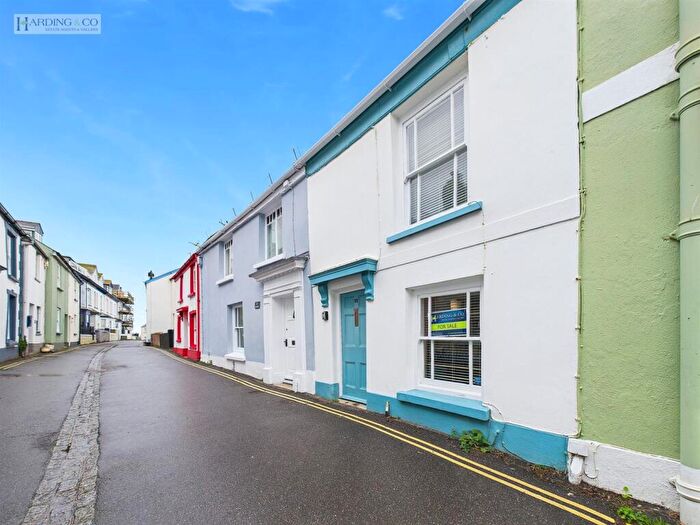
Properties in Appledore have an average house price of £376,293.00 and had 170 Property Transactions within the last 3 years¹.
Appledore is an area in Bideford, Devon with 1,362 households², where the most expensive property was sold for £1,150,000.00.
Properties for sale in Appledore
Roads and Postcodes in Appledore
Navigate through our locations to find the location of your next house in Appledore, Bideford for sale or to rent.
| Streets | Postcodes |
|---|---|
| Alpha Place | EX39 1QY |
| Appletree Mews | EX39 1QR |
| Ashfield Terrace | EX39 1DU |
| Bassetts Close | EX39 1SZ |
| Bidna Lane | EX39 1NU |
| Broad Lane | EX39 1ND |
| Broadlands | EX39 1ST |
| Bude Street | EX39 1PS |
| Burrows Lane | EX39 1NL |
| Burrows Way | EX39 1HA |
| Churchfield | EX39 1RL |
| Churchill Way | EX39 1NR EX39 1NS EX39 1PA EX39 1NT |
| Darracotts Court | EX39 1RT |
| Diddywell Close | EX39 1BT |
| Diddywell Road | EX39 1NP EX39 1NW |
| Estuary Avenue | EX39 1GF |
| Estuary View | EX39 1XZ |
| Factory Ope | EX39 1QW |
| Fairway | EX39 1PB |
| Gibbs Lane | EX39 1PR |
| Glazon Way | EX39 1TD |
| Great Burrow Rise | EX39 1TB |
| Green Lane | EX39 1QZ |
| Greysand Crescent | EX39 1SE |
| Highbury Hill | EX39 1NJ |
| Hillcliff Terrace | EX39 1SA |
| Hubbastone Road | EX39 1LZ |
| Ibex Court | EX39 1RR |
| Irsha Court | EX39 1RN |
| Irsha Street | EX39 1RY EX39 1RZ |
| Ivy Court | EX39 1RP |
| J H Taylor Drive | EX39 1TT |
| Jackets Lane | EX39 1HT |
| Jubilee Road | EX39 1SL |
| Kimberley Park | EX39 1GG EX39 1GQ |
| Kimberley Terrace | EX39 1NN |
| Kingsley Avenue | EX39 1PF |
| Knightsfield Rise | EX39 1TG |
| Land At | EX39 1TU |
| Lea Terrace | EX39 1PZ |
| Lever Close | EX39 1SS |
| Long Lane | EX39 1NF EX39 1NH |
| Longfield | EX39 1QA |
| Marine Parade | EX39 1PJ |
| Mariners Way | EX39 1RA |
| Market Street | EX39 1PP EX39 1PW |
| Meeting Street | EX39 1RH EX39 1RJ |
| Myra Court | EX39 1RW |
| Myrtle Street | EX39 1PH |
| New Quay Street | EX39 1LU |
| New Street | EX39 1QJ |
| Oakfield Terrace | EX39 1DS |
| Odun Place | EX39 1QP |
| Odun Road | EX39 1PT |
| Odun Terrace | EX39 1PQ |
| One End Street | EX39 1PN |
| Pen Stour Lane | EX39 1GH |
| Pitt Avenue | EX39 1PY |
| Pitt Court | EX39 1PU |
| Pitt Hill | EX39 1PX |
| Pitt Lane | EX39 1QB |
| Polywell | EX39 1SG |
| Quayside | EX39 1FR |
| Reardon Way | EX39 1GB |
| Retreat Place | EX39 1QX |
| Richmond Green | EX39 1PD |
| Richmond Rise | EX39 1GD |
| Richmond Road | EX39 1PE EX39 1QN |
| Richmond Terrace | EX39 1PG |
| Ridge View Crescent | EX39 1FQ |
| River View | EX39 1GA |
| Riversmeet | EX39 1RE |
| Riversmeet Close | EX39 1GE |
| Sandymere Road | EX39 1HB EX39 1XR EX39 1XS |
| Scott Avenue | EX39 1HF EX39 1RQ |
| Sea View Place | EX39 1QL |
| Silver Street | EX39 1PL |
| Skern Close | EX39 1TA |
| Skern Way | EX39 1HZ |
| South Road | EX39 1QH EX39 1QQ |
| Staddon Road | EX39 1RB EX39 1RF EX39 1RG |
| The Lifeboat Slip | EX39 1SB |
| The Mount | EX39 1NZ |
| The Old Boat Yard | EX39 1FJ |
| The Path | EX39 1RU |
| The Quay | EX39 1QS |
| Tomouth Crescent | EX39 1QG |
| Tomouth Road | EX39 1FE EX39 1QD EX39 1WH |
| Tomouth Square | EX39 1QE |
| Tomouth Terrace | EX39 1QF |
| Torridge Road | EX39 1SF EX39 1SQ |
| Vanrenen Grove | EX39 1ZL |
| Vernons Lane | EX39 1QU EX39 1SJ |
| Vickers Ground | EX39 1SW |
| Victoria Crescent | EX39 1RS |
| Watertown | EX39 1NQ EX39 1NG |
| West Moor Close | EX39 1SR |
| West Moor Way | EX39 1SP |
| Westcroft Terrace | EX39 1RX |
| Western Avenue | EX39 1SD |
| Wooda Road | EX39 1NB EX39 1UZ |
| Yeo Drive | EX39 1RD |
| EX39 1FY |
Transport near Appledore
- FAQ
- Price Paid By Year
- Property Type Price
Frequently asked questions about Appledore
What is the average price for a property for sale in Appledore?
The average price for a property for sale in Appledore is £376,293. This amount is 22% higher than the average price in Bideford. There are 427 property listings for sale in Appledore.
What streets have the most expensive properties for sale in Appledore?
The streets with the most expensive properties for sale in Appledore are Odun Road at an average of £975,000, Churchill Way at an average of £821,666 and Torridge Road at an average of £620,000.
What streets have the most affordable properties for sale in Appledore?
The streets with the most affordable properties for sale in Appledore are The Mount at an average of £167,100, Oakfield Terrace at an average of £184,000 and Burrows Way at an average of £196,500.
Which train stations are available in or near Appledore?
Some of the train stations available in or near Appledore are Barnstaple, Chapelton and Umberleigh.
Property Price Paid in Appledore by Year
The average sold property price by year was:
| Year | Average Sold Price | Price Change |
Sold Properties
|
|---|---|---|---|
| 2025 | £348,535 | -8% |
42 Properties |
| 2024 | £375,401 | -5% |
66 Properties |
| 2023 | £396,047 | 1% |
62 Properties |
| 2022 | £393,011 | 11% |
71 Properties |
| 2021 | £350,837 | 13% |
79 Properties |
| 2020 | £304,946 | 6% |
62 Properties |
| 2019 | £285,170 | 3% |
79 Properties |
| 2018 | £276,296 | 3% |
85 Properties |
| 2017 | £267,209 | 8% |
99 Properties |
| 2016 | £246,744 | 2% |
93 Properties |
| 2015 | £241,267 | 5% |
91 Properties |
| 2014 | £228,480 | 7% |
77 Properties |
| 2013 | £213,627 | 4% |
65 Properties |
| 2012 | £204,236 | -7% |
65 Properties |
| 2011 | £218,015 | -1% |
81 Properties |
| 2010 | £220,922 | 12% |
68 Properties |
| 2009 | £194,553 | -7% |
60 Properties |
| 2008 | £207,221 | -9% |
53 Properties |
| 2007 | £225,441 | 15% |
94 Properties |
| 2006 | £192,731 | 6% |
105 Properties |
| 2005 | £181,109 | -6% |
117 Properties |
| 2004 | £192,472 | 22% |
77 Properties |
| 2003 | £149,594 | 13% |
86 Properties |
| 2002 | £130,562 | 23% |
100 Properties |
| 2001 | £100,041 | 14% |
102 Properties |
| 2000 | £86,516 | 24% |
105 Properties |
| 1999 | £65,771 | 3% |
119 Properties |
| 1998 | £63,698 | 8% |
91 Properties |
| 1997 | £58,872 | 11% |
112 Properties |
| 1996 | £52,581 | -5% |
95 Properties |
| 1995 | £54,990 | - |
65 Properties |
Property Price per Property Type in Appledore
Here you can find historic sold price data in order to help with your property search.
The average Property Paid Price for specific property types in the last three years are:
| Property Type | Average Sold Price | Sold Properties |
|---|---|---|
| Semi Detached House | £374,222.00 | 27 Semi Detached Houses |
| Detached House | £490,511.00 | 40 Detached Houses |
| Terraced House | £353,795.00 | 88 Terraced Houses |
| Flat | £207,433.00 | 15 Flats |

