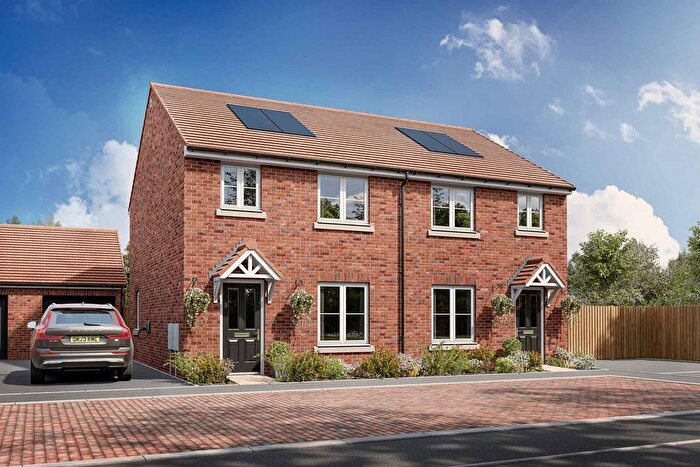
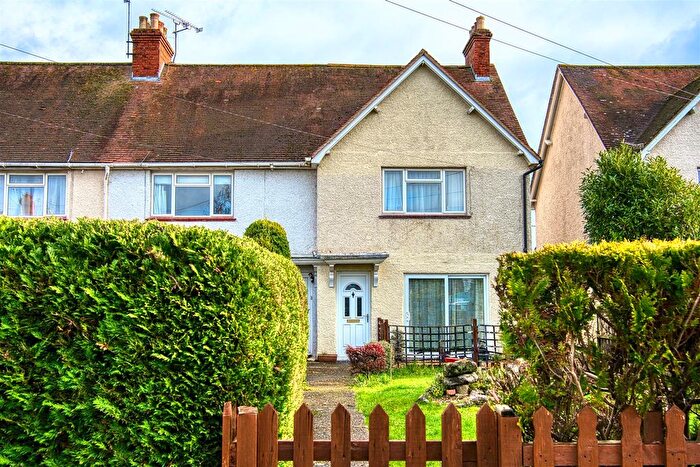
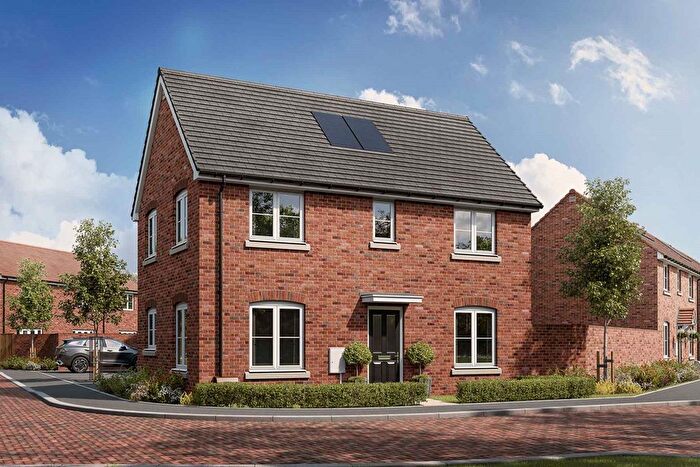
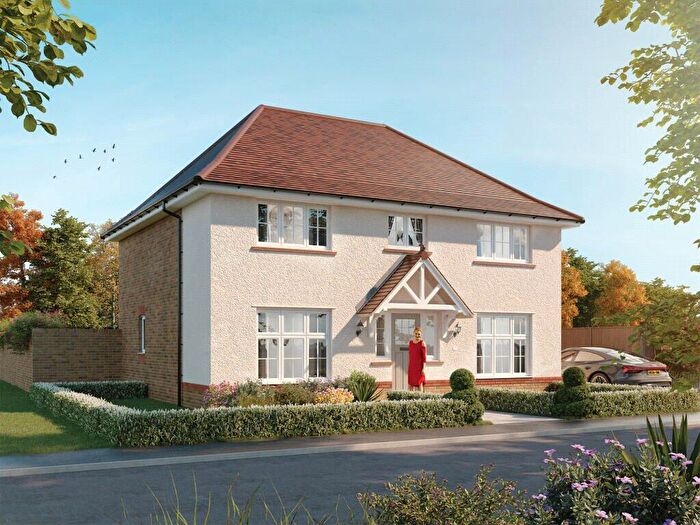
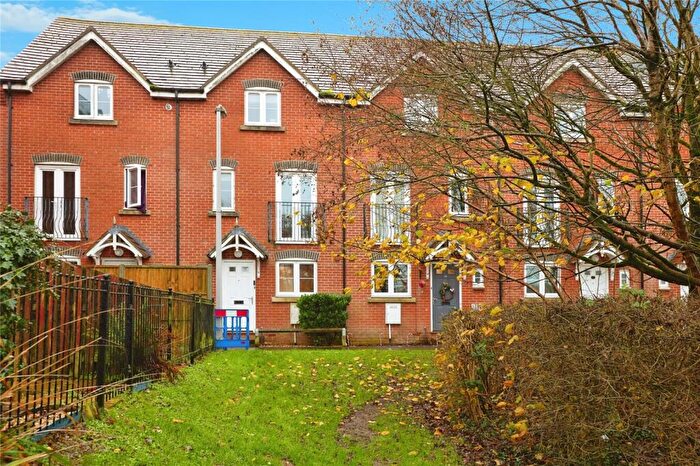
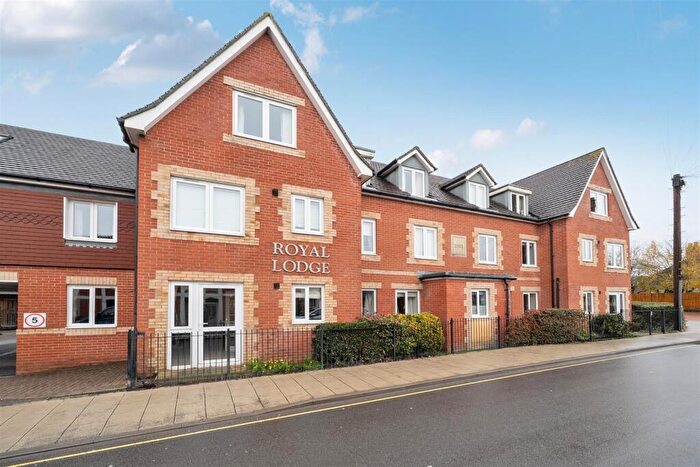
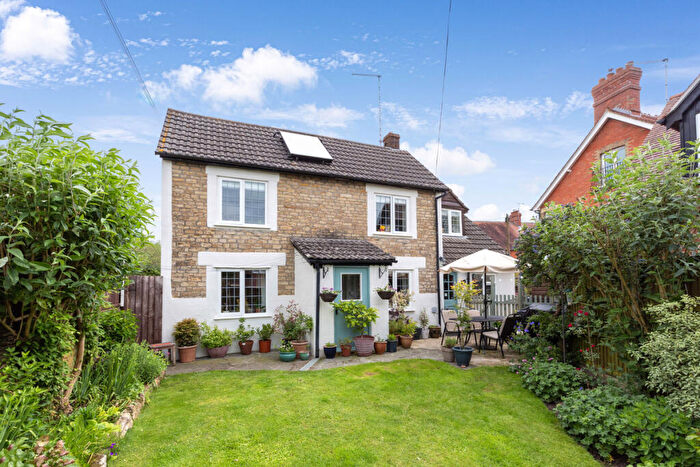
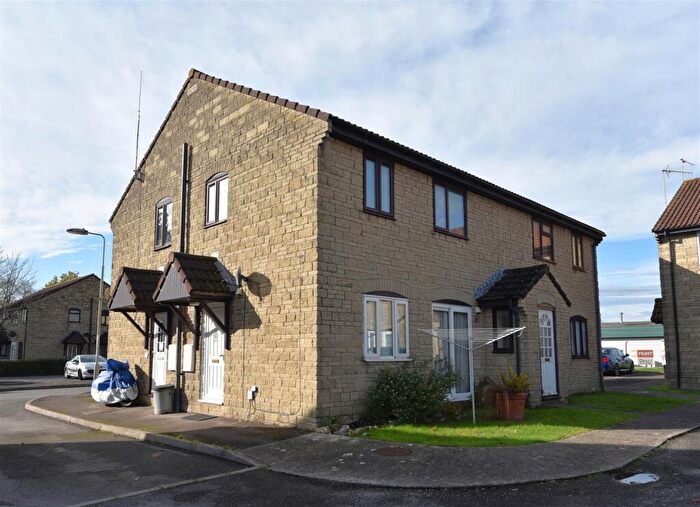
Houses for sale & to rent in Motcombe And Ham, Gillingham
House Prices in Motcombe And Ham
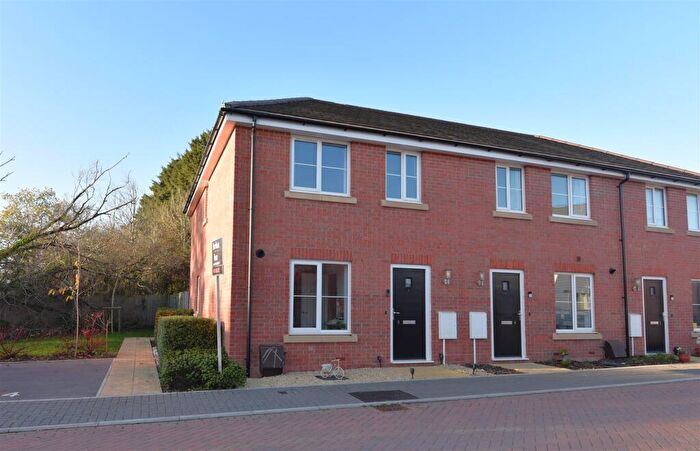
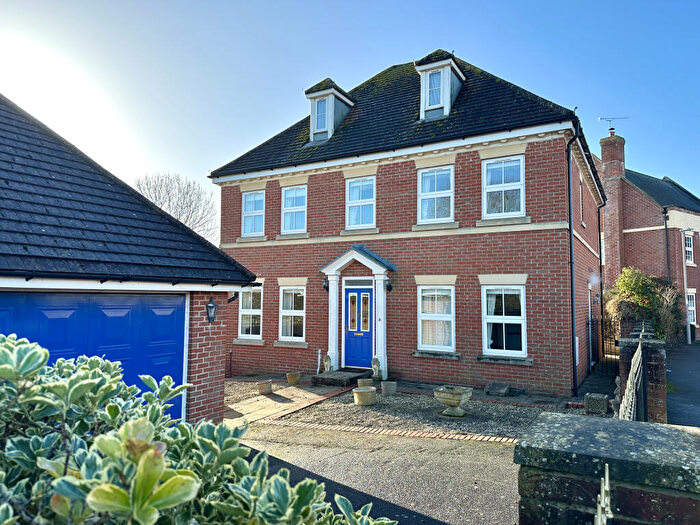
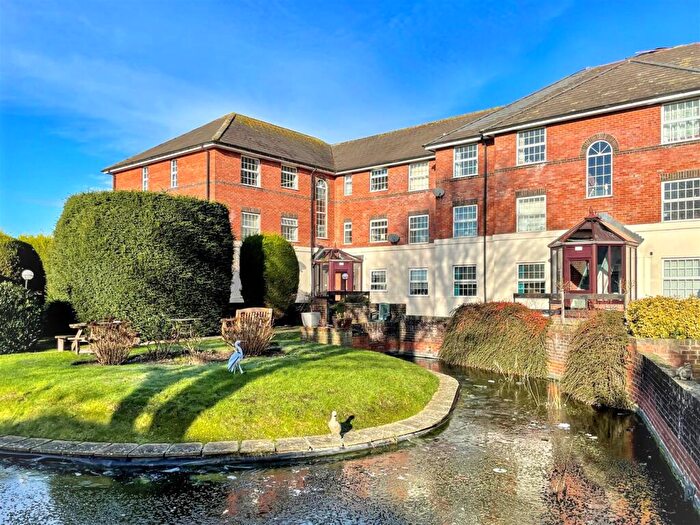
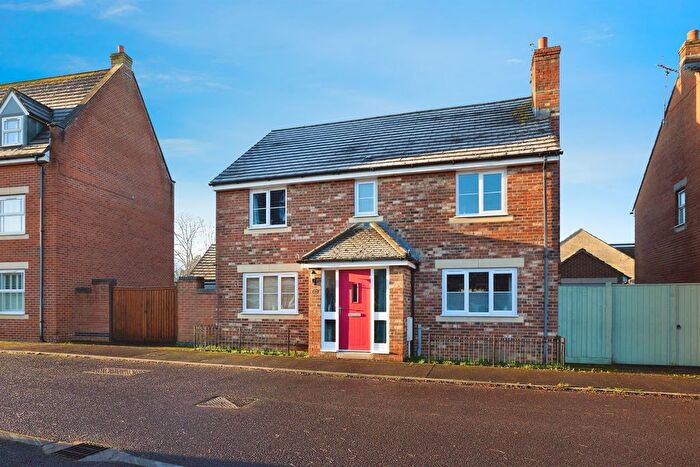
Properties in Motcombe And Ham have an average house price of £281,982.00 and had 89 Property Transactions within the last 3 years¹.
Motcombe And Ham is an area in Gillingham, Dorset with 631 households², where the most expensive property was sold for £625,000.00.
Properties for sale in Motcombe And Ham
Roads and Postcodes in Motcombe And Ham
Navigate through our locations to find the location of your next house in Motcombe And Ham, Gillingham for sale or to rent.
| Streets | Postcodes |
|---|---|
| Bridge Close | SP8 4LS |
| Cale Way | SP8 4FT |
| Cerne Avenue | SP8 4FW SP8 4FX |
| Chaffinch Chase | SP8 4GP SP8 4GT |
| Deer Gardens | SP8 4WF |
| Fern Brook Lane | SP8 4FL SP8 4FP |
| Frog Road | SP8 4GU |
| Goldfinch Gate | SP8 4GZ |
| Ham Road | SP8 4LB |
| Hedgehog Path | SP8 4GD |
| Hine Close | SP8 4GN |
| Jay Walk | SP8 4GQ SP8 4GY |
| Kingfisher Avenue | SP8 4GL SP8 4GW |
| Kings Chase | SP8 4GE |
| Kings Court Close | SP8 4LF |
| Kings Court Road | SP8 4LD SP8 4LE |
| Lockwood Terrace | SP8 4LQ |
| North Close | SP8 4LA |
| Otter Springs | SP8 4GX |
| Pheasant Way | SP8 4GG |
| Rookery Close | SP8 4LH |
| Shaftesbury Road | SP8 4ED SP8 4GJ SP8 4JZ SP8 4LJ SP8 4LL SP8 4LN SP8 4LP SP8 4LU SP8 4LW SP8 5JG |
| Simene Walk | SP8 4FU |
| Sparrow Croft | SP8 4GA |
| Trent Square | SP8 4FS |
| Woodpecker Meadow | SP8 4GB |
| Wren Place | SP8 4WE |
Transport near Motcombe And Ham
- FAQ
- Price Paid By Year
- Property Type Price
Frequently asked questions about Motcombe And Ham
What is the average price for a property for sale in Motcombe And Ham?
The average price for a property for sale in Motcombe And Ham is £281,982. This amount is 11% lower than the average price in Gillingham. There are 422 property listings for sale in Motcombe And Ham.
What streets have the most expensive properties for sale in Motcombe And Ham?
The streets with the most expensive properties for sale in Motcombe And Ham are Rookery Close at an average of £403,750, Hine Close at an average of £399,950 and Fern Brook Lane at an average of £375,833.
What streets have the most affordable properties for sale in Motcombe And Ham?
The streets with the most affordable properties for sale in Motcombe And Ham are Otter Springs at an average of £180,800, Hedgehog Path at an average of £190,000 and Goldfinch Gate at an average of £205,000.
Which train stations are available in or near Motcombe And Ham?
Some of the train stations available in or near Motcombe And Ham are Gillingham (Dorset), Templecombe and Tisbury.
Property Price Paid in Motcombe And Ham by Year
The average sold property price by year was:
| Year | Average Sold Price | Price Change |
Sold Properties
|
|---|---|---|---|
| 2025 | £268,477 | -1% |
24 Properties |
| 2024 | £272,220 | -11% |
34 Properties |
| 2023 | £303,145 | 10% |
31 Properties |
| 2022 | £273,023 | 14% |
41 Properties |
| 2021 | £235,773 | -0,1% |
42 Properties |
| 2020 | £235,998 | 4% |
31 Properties |
| 2019 | £226,559 | -0,2% |
32 Properties |
| 2018 | £227,093 | 3% |
37 Properties |
| 2017 | £221,283 | 6% |
46 Properties |
| 2016 | £208,952 | 8% |
34 Properties |
| 2015 | £191,635 | -7% |
48 Properties |
| 2014 | £204,269 | 10% |
44 Properties |
| 2013 | £183,674 | -0,4% |
37 Properties |
| 2012 | £184,395 | 6% |
24 Properties |
| 2011 | £174,060 | -7% |
25 Properties |
| 2010 | £186,956 | 7% |
30 Properties |
| 2009 | £174,507 | -10% |
32 Properties |
| 2008 | £191,189 | -0,2% |
39 Properties |
| 2007 | £191,592 | 4% |
59 Properties |
| 2006 | £184,847 | 6% |
128 Properties |
| 2005 | £173,417 | -8% |
118 Properties |
| 2004 | £187,155 | 9% |
130 Properties |
| 2003 | £169,663 | 6% |
113 Properties |
| 2002 | £160,227 | 35% |
55 Properties |
| 2001 | £104,544 | 19% |
26 Properties |
| 2000 | £84,885 | 11% |
7 Properties |
| 1999 | £75,152 | 5% |
19 Properties |
| 1998 | £71,642 | 20% |
7 Properties |
| 1997 | £57,430 | -11% |
15 Properties |
| 1996 | £64,025 | 11% |
8 Properties |
| 1995 | £56,795 | - |
11 Properties |
Property Price per Property Type in Motcombe And Ham
Here you can find historic sold price data in order to help with your property search.
The average Property Paid Price for specific property types in the last three years are:
| Property Type | Average Sold Price | Sold Properties |
|---|---|---|
| Semi Detached House | £240,451.00 | 31 Semi Detached Houses |
| Detached House | £390,306.00 | 30 Detached Houses |
| Terraced House | £257,289.00 | 19 Terraced Houses |
| Flat | £116,083.00 | 9 Flats |

