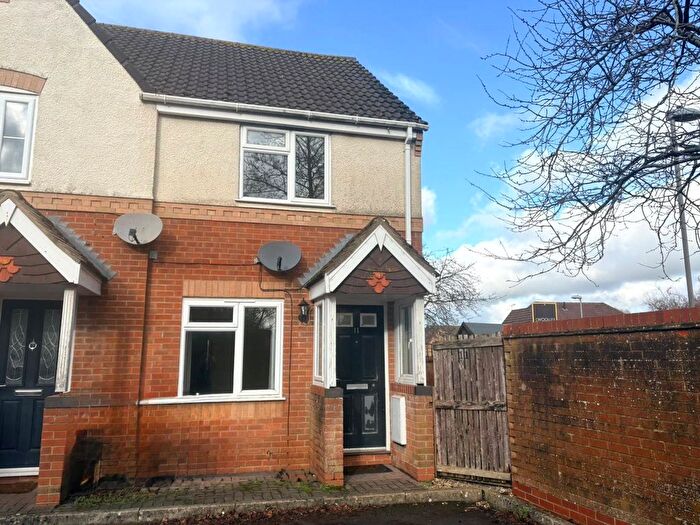
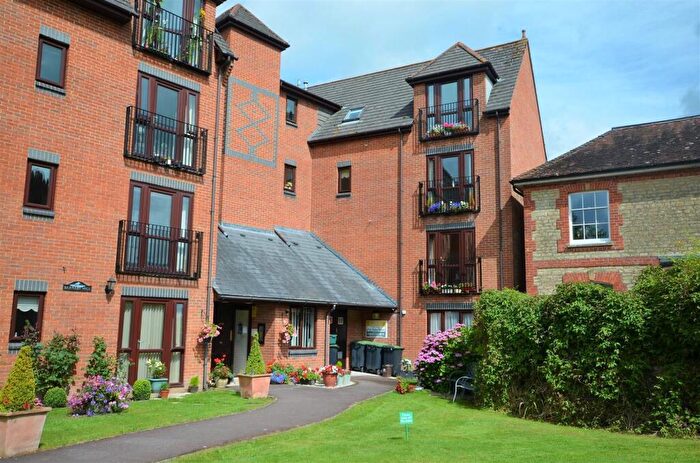
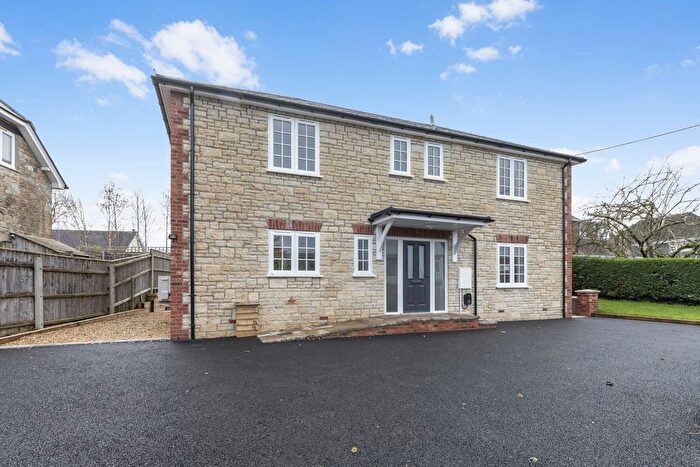
Houses for sale & to rent in Gillingham, Gillingham
House Prices in Gillingham
Properties in Gillingham have an average house price of £389,933.00 and had 15 Property Transactions within the last 3 years¹.
Gillingham is an area in Gillingham, Dorset with 387 households², where the most expensive property was sold for £1,250,000.00.
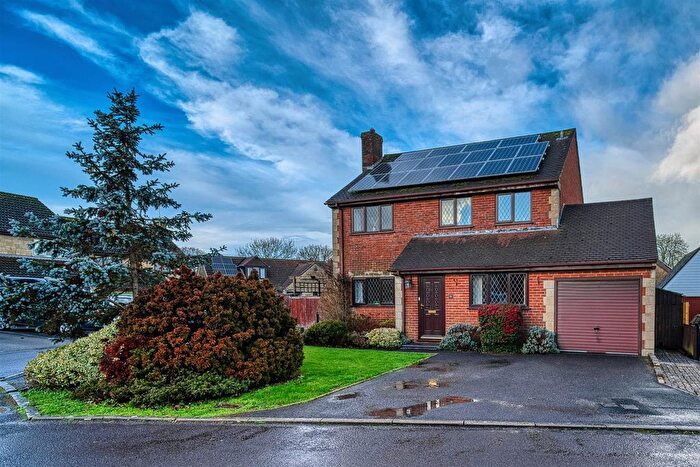
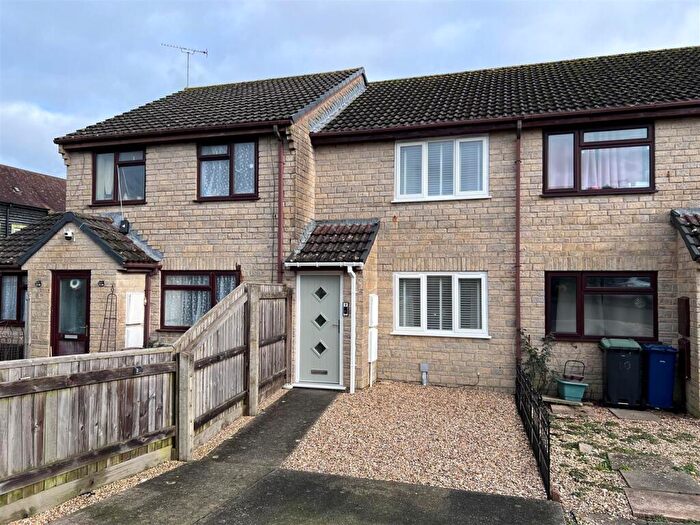
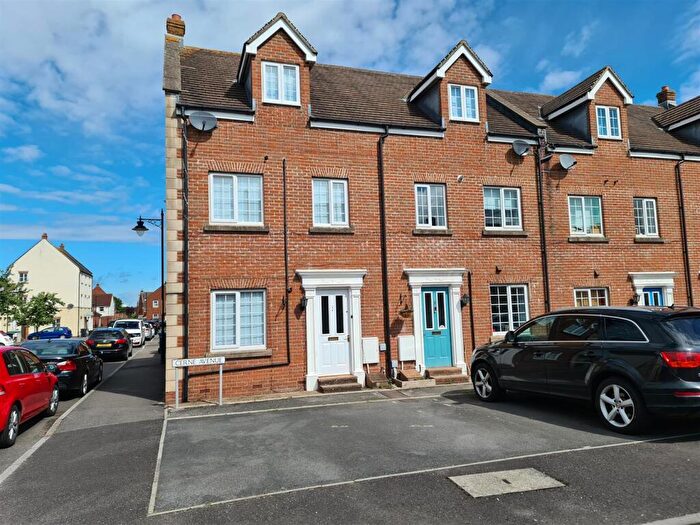
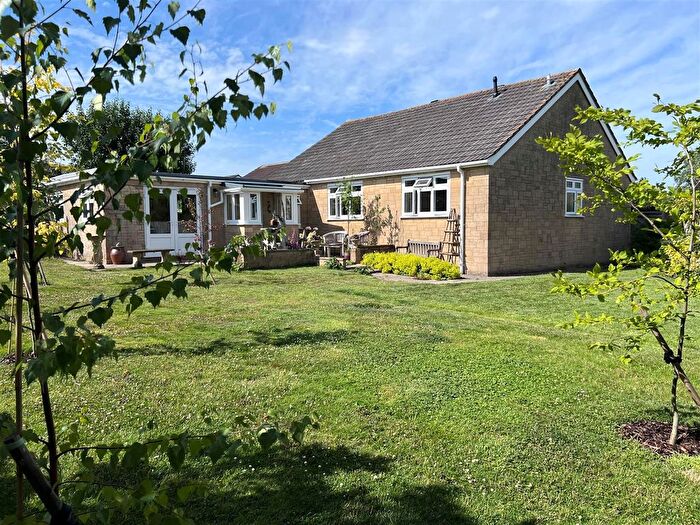
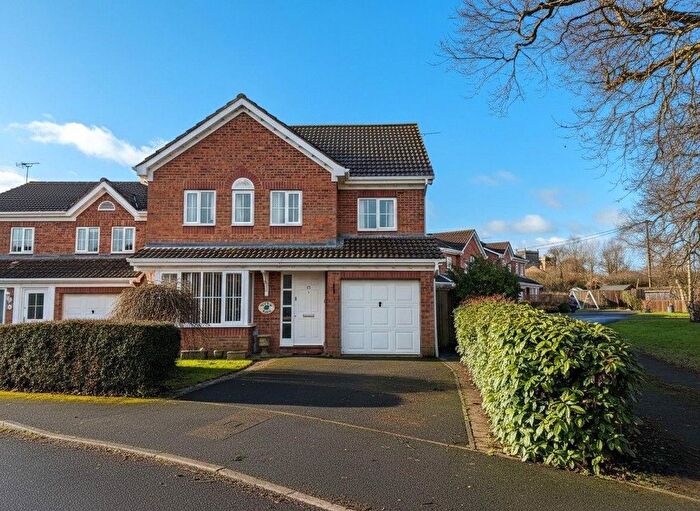
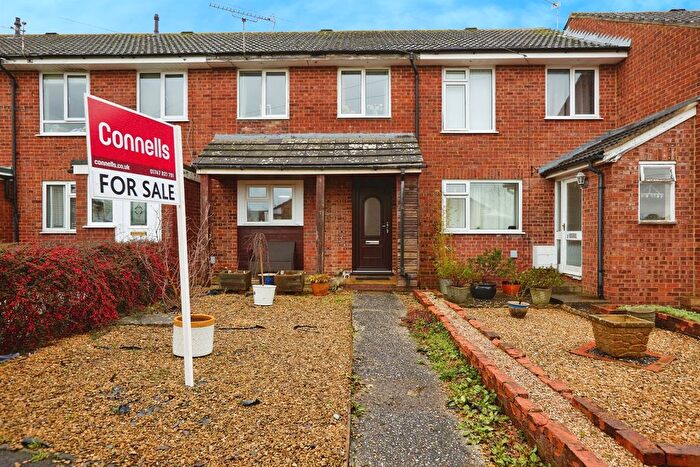
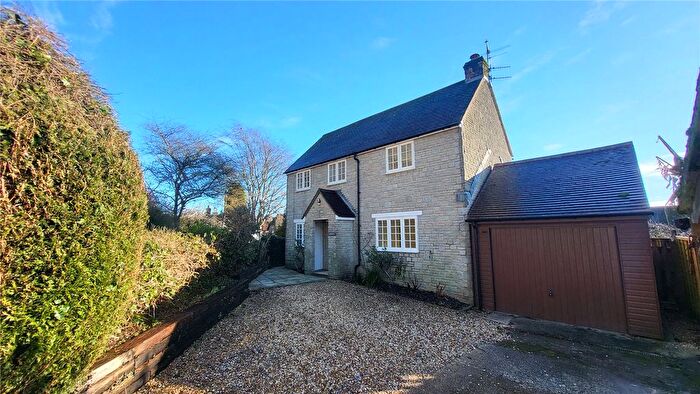
Properties for sale in Gillingham
Roads and Postcodes in Gillingham
Navigate through our locations to find the location of your next house in Gillingham, Gillingham for sale or to rent.
| Streets | Postcodes |
|---|---|
| Weston Street | SP8 5HQ |
| Addison Close | SP8 4UZ |
| Anglers Road | SP8 4YR |
| Ash Green | SP8 5FL |
| Barton Elms | SP8 5EH |
| Bay Road | SP8 5FP |
| Blackwater Lane | SP8 5FW |
| Bleet Lane | SP8 5RF |
| Breach Lane | SP8 5EJ |
| Brickfield Industrial Estate | SP8 4LT SP8 4XT |
| Brickfields Business Park | SP8 4PX |
| Broad Close | SP8 5JE |
| Buckingham Road | SP8 4QE |
| Calves Lane | SP7 8GU |
| Cemetery Road | SP8 4BA |
| Chantry Fields | SP8 4UA |
| Cherry Orchard Lane | SP8 5FH |
| Church Mead | SP8 5PH |
| Church Street | SP8 5FT |
| Common Lane | SP8 5EX |
| Crier Close | SP8 4YU |
| Factory Hill | SP8 5FN SP8 5FS |
| Fairey Close | SP8 4PA |
| Fern Brook Lane | SP8 4QD |
| Field Lane | SP8 5EP |
| Forge Lane | SP8 5AU |
| Grays Close | SP7 9QB |
| Great House Walk | SP8 4DE |
| Green Pleck | SP8 5RQ |
| Grimsey Lane | SP8 5JB |
| Gyllas Way | SP8 4QU |
| Hardings Lane | SP8 4QP |
| Head Lane | SP8 5LN |
| High Street | SP8 4AJ SP8 4AN SP8 4AQ SP8 4WH |
| Hope Cross | SP8 5SS |
| Laburnum Way | SP8 4RU |
| Lakeside Drive | SP8 4YN |
| Le Neubourg Way | SP8 4DN |
| Lintern Lane | SP8 5JN |
| Lodden View | SP8 4TZ |
| Longbury Hill Lane | SP8 5SY |
| Lox Lane | SP7 9PU |
| Lynch Lane | SP8 5FQ |
| Matthews Place | SP8 4DB |
| New Barn Cottages | SP8 5JL |
| New Lane | SP7 9PB |
| New Road | SP8 4JJ SP8 4XF |
| Nyland | SP8 5SG |
| Old Market Centre | SP8 4QQ |
| Park Villas | SP8 4LG |
| Pleasant View | SP8 5BU |
| Purns Mill | SP8 4HW |
| Queen Street | SP8 4DY SP8 4EB SP8 4UU |
| Rawson Court | SP8 4RZ |
| Reads Bungalows | SP8 4HE |
| Roads Lane | SP8 5FF |
| Rolls Bridge Bungalows | SP8 4BD |
| School Lane | SP8 4QW |
| Shaftesbury Road | SP7 9NP SP7 9PN SP7 9PW SP8 5NG |
| Silton Road | SP8 5FJ |
| Slaughtergate | SP8 5NJ |
| Spinners Way | SP8 4YP |
| Station Yard | SP8 4PZ |
| Stroud Bungalows | SP8 5PW |
| Stud Drive | SP8 5DX |
| The Centre | SP8 4AB |
| The Parade | SP8 4BP SP8 4EG |
| The Square | SP8 4AS SP8 4AX SP8 4AY |
| Tomlins Way | SP8 4BN |
| Turners Lane | SP8 4DS |
| Wathen Court | SP8 4YS |
| West Bourton Road | SP8 5FG |
| SP7 9BT SP7 9BX SP7 9HF SP7 9HT SP7 9HW SP7 9HY SP7 9LD SP7 9LE SP7 9PL SP7 9PR SP7 9QA SP8 4EY SP8 4JB SP8 4JN SP8 4PU SP8 4QL SP8 4QX SP8 4WB SP8 4WL SP8 4XL SP8 4XS SP8 5AA SP8 5AG SP8 5DS SP8 5DU SP8 5EY SP8 5EZ SP8 5FB SP8 5HA SP8 5HB SP8 5HE SP8 5HN SP8 5HP SP8 5HR SP8 5JF SP8 5JJ SP8 5JW SP8 5LP SP8 5NN SP8 5NP SP8 5NQ SP8 5NU SP8 5NW SP8 5PB SP8 5PD SP8 5PT SP8 5QE SP8 5QF SP8 5QN SP8 5QR SP8 5QW SP8 5RA SP8 5RH SP8 9AL SP8 9AP SP8 9AU SP8 9AX SP8 5FR SP8 5FX SP8 9AZ |
Transport near Gillingham
- FAQ
- Price Paid By Year
- Property Type Price
Frequently asked questions about Gillingham
What is the average price for a property for sale in Gillingham?
The average price for a property for sale in Gillingham is £389,933. This amount is 24% higher than the average price in Gillingham. There are 3,798 property listings for sale in Gillingham.
What streets have the most expensive properties for sale in Gillingham?
The streets with the most expensive properties for sale in Gillingham are Calves Lane at an average of £1,250,000, Head Lane at an average of £327,500 and Turners Lane at an average of £320,000.
What streets have the most affordable properties for sale in Gillingham?
The streets with the most affordable properties for sale in Gillingham are Stroud Bungalows at an average of £120,000, Grays Close at an average of £211,500 and Ash Green at an average of £256,000.
Which train stations are available in or near Gillingham?
Some of the train stations available in or near Gillingham are Gillingham (Dorset), Templecombe and Bruton.
Property Price Paid in Gillingham by Year
The average sold property price by year was:
| Year | Average Sold Price | Price Change |
Sold Properties
|
|---|---|---|---|
| 2025 | £371,625 | -3% |
8 Properties |
| 2024 | £382,200 | -26% |
5 Properties |
| 2023 | £482,500 | 21% |
2 Properties |
| 2022 | £382,833 | -279% |
6 Properties |
| 2021 | £1,450,000 | 80% |
1 Property |
| 2020 | £286,700 | 10% |
5 Properties |
| 2019 | £256,785 | -29% |
7 Properties |
| 2018 | £330,775 | -46% |
8 Properties |
| 2017 | £482,927 | 30% |
8 Properties |
| 2016 | £339,750 | -19% |
2 Properties |
| 2015 | £403,790 | 36% |
5 Properties |
| 2014 | £257,500 | 51% |
2 Properties |
| 2008 | £125,000 | -204% |
1 Property |
| 2006 | £380,000 | 75% |
1 Property |
| 2001 | £96,247 | - |
2 Properties |
Property Price per Property Type in Gillingham
Here you can find historic sold price data in order to help with your property search.
The average Property Paid Price for specific property types in the last three years are:
| Property Type | Average Sold Price | Sold Properties |
|---|---|---|
| Detached House | £603,333.00 | 6 Detached Houses |
| Semi Detached House | £215,750.00 | 4 Semi Detached Houses |
| Terraced House | £273,200.00 | 5 Terraced Houses |

