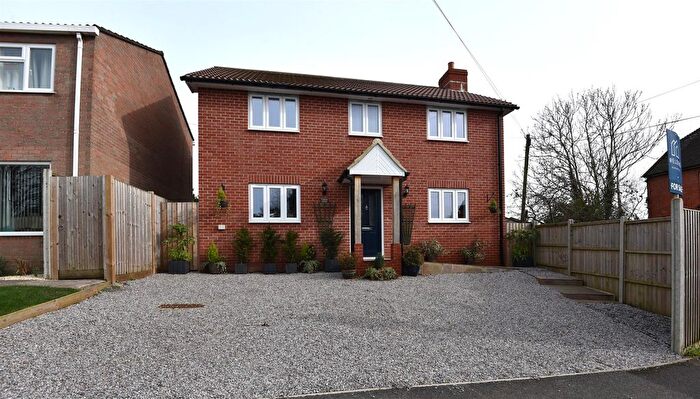
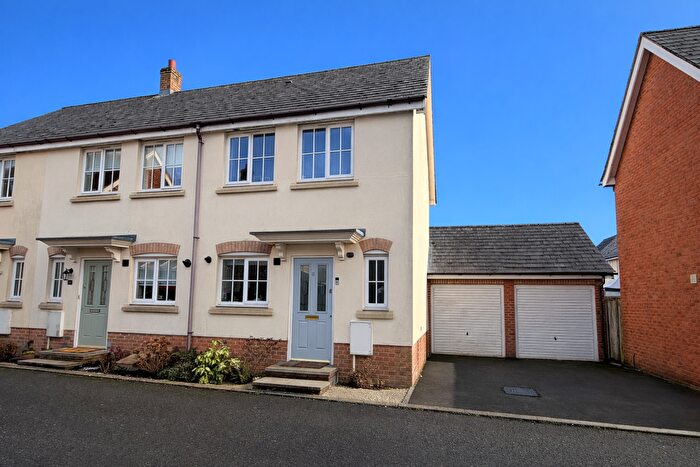
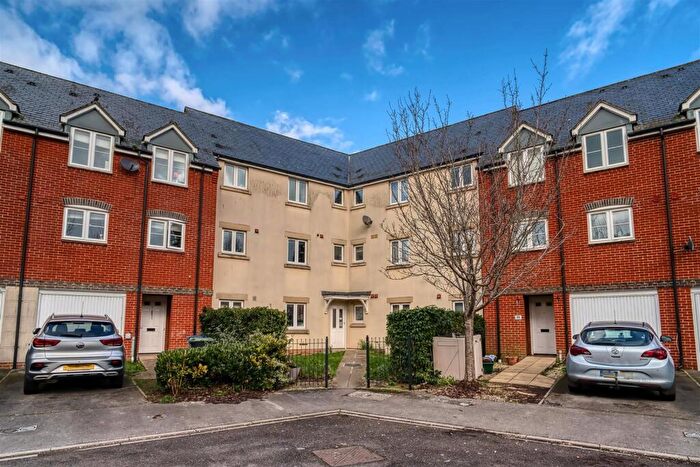
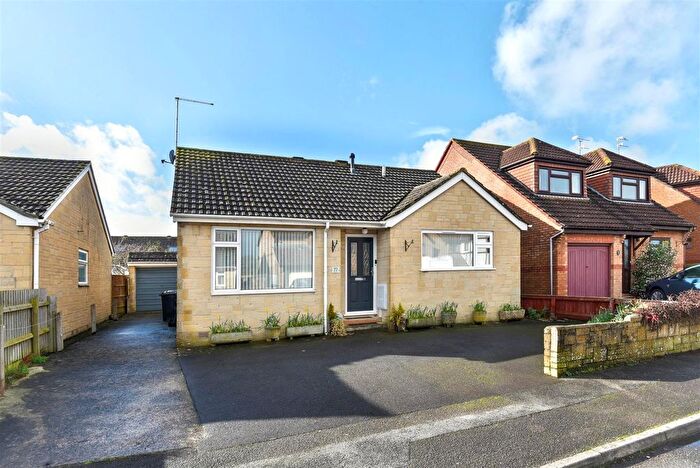
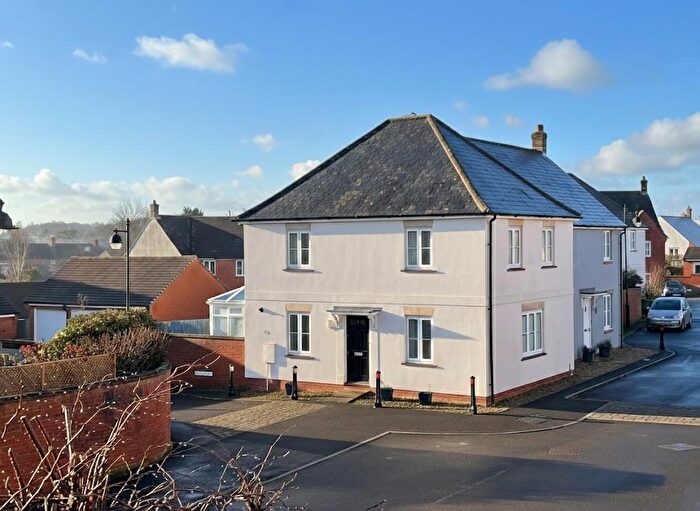
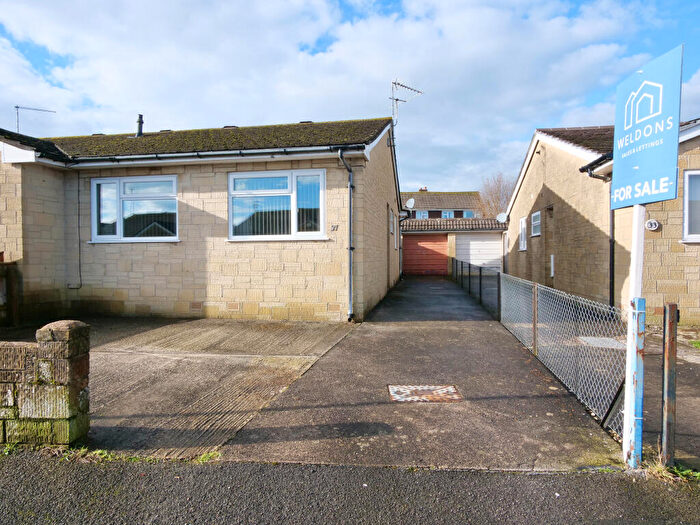
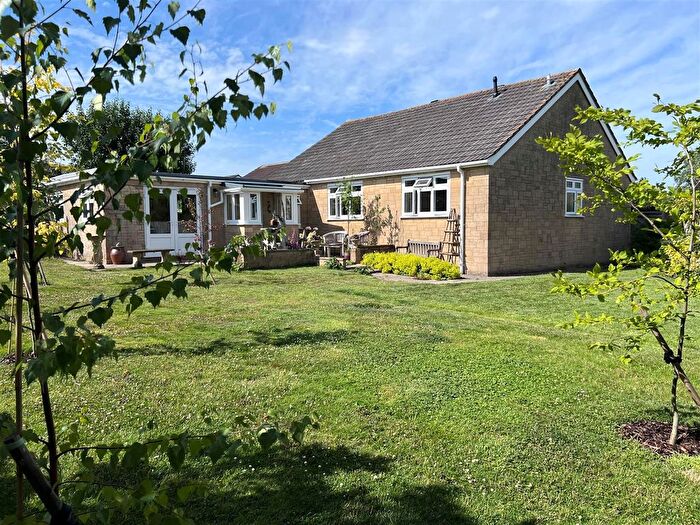
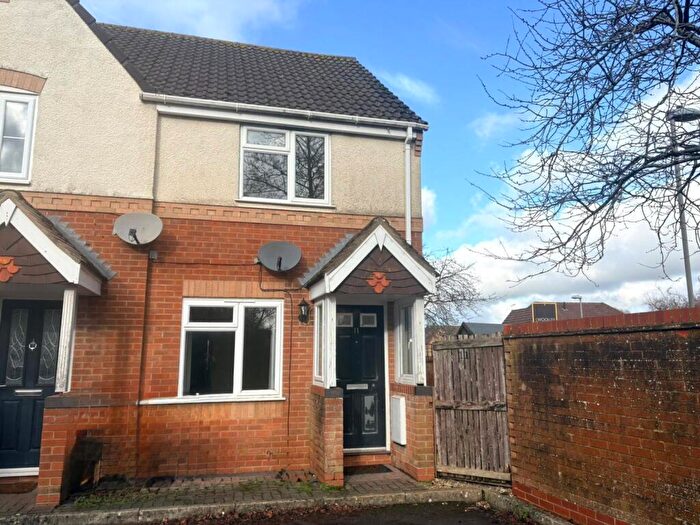
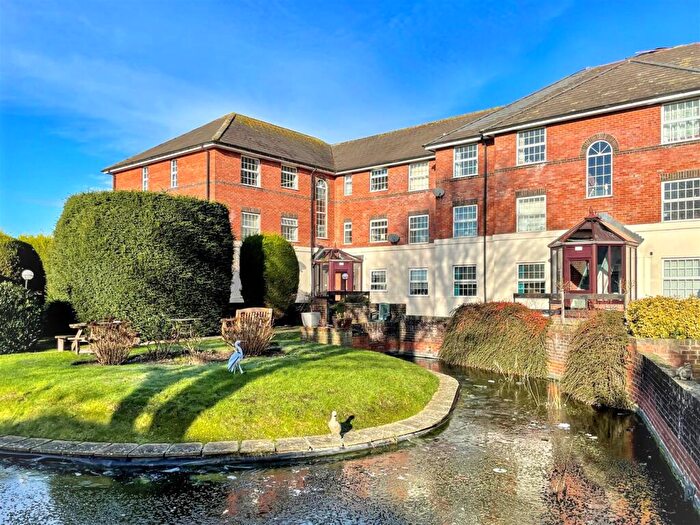
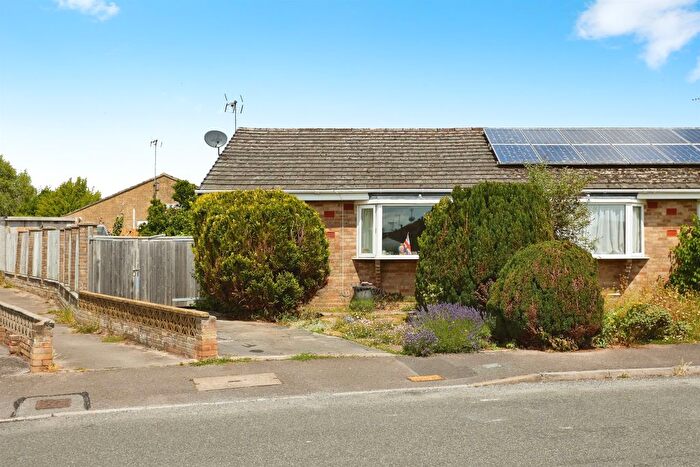
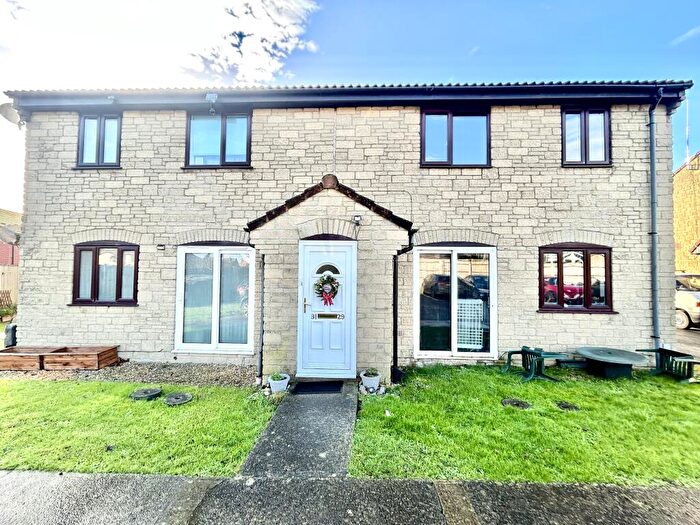
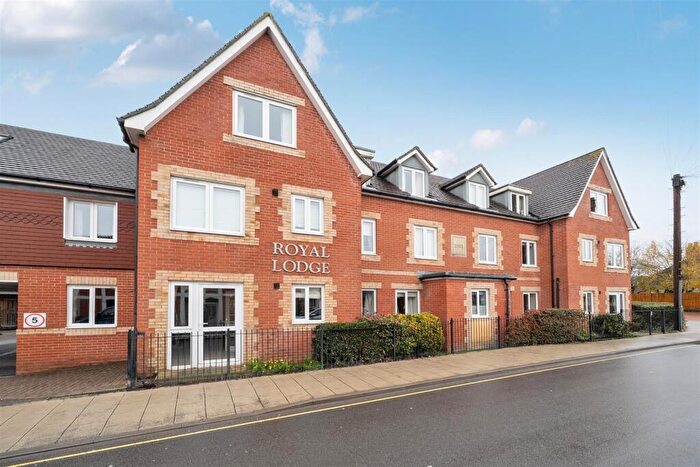
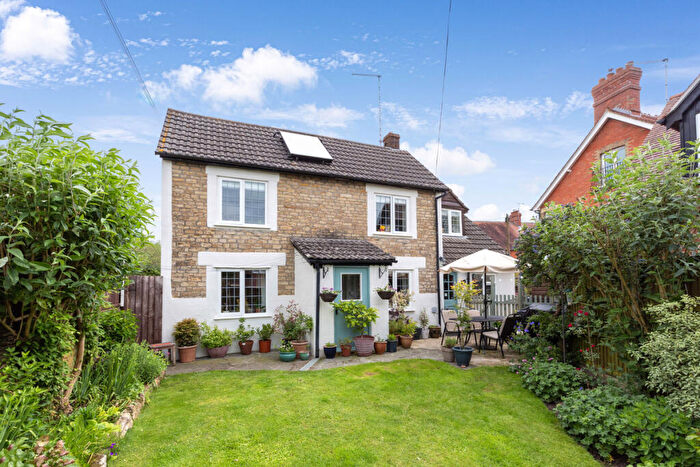
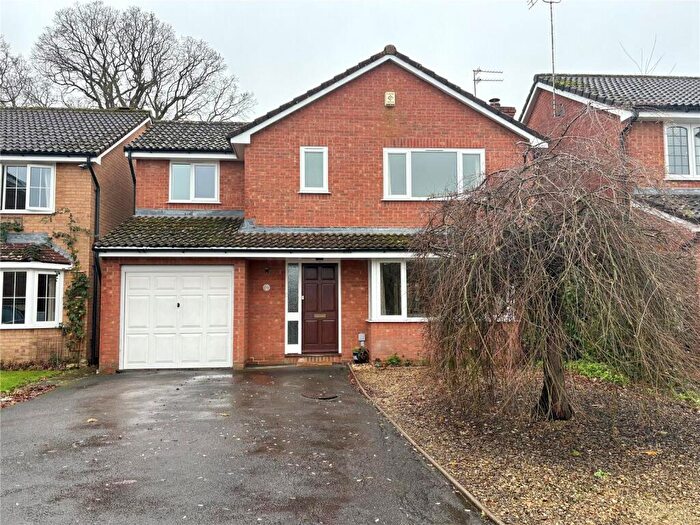
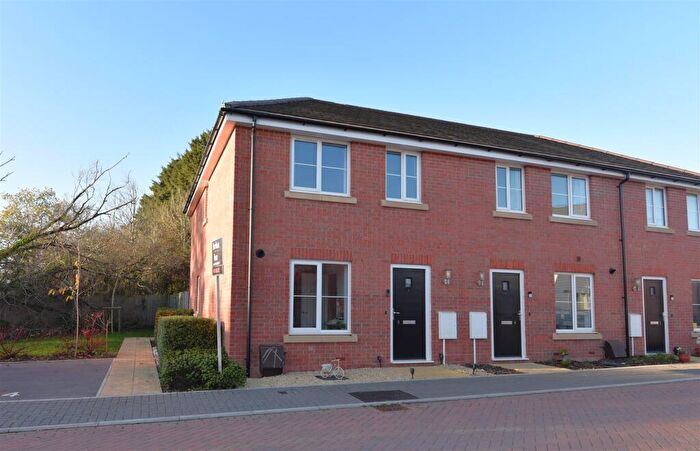
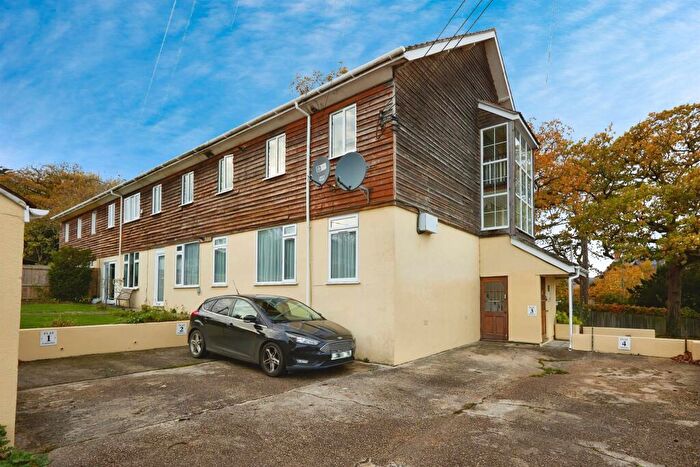
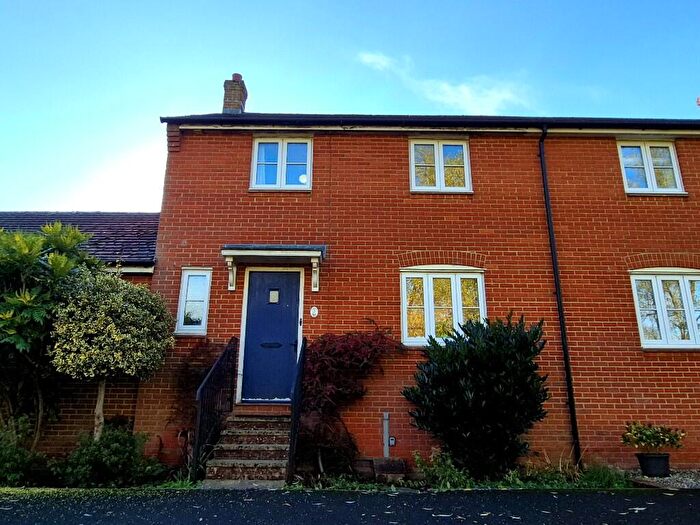
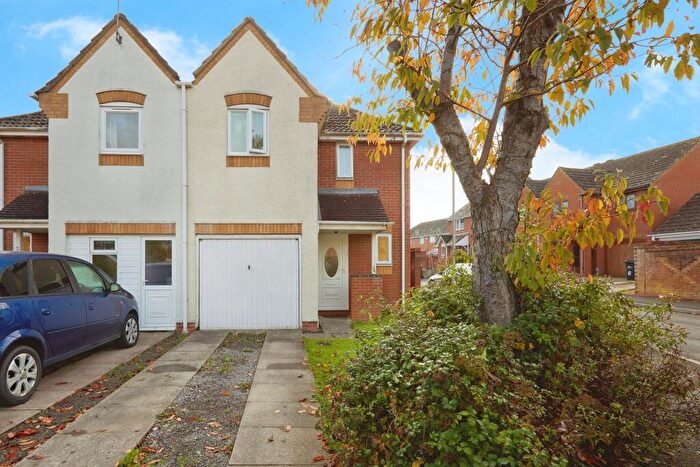
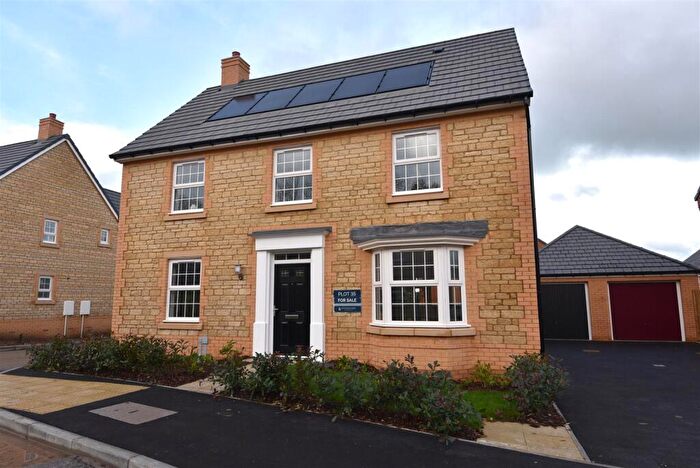
Houses for sale & to rent in Lodbourne, Gillingham
House Prices in Lodbourne
Properties in Lodbourne have an average house price of £291,085.00 and had 88 Property Transactions within the last 3 years¹.
Lodbourne is an area in Gillingham, Dorset with 807 households², where the most expensive property was sold for £625,000.00.
Properties for sale in Lodbourne
Roads and Postcodes in Lodbourne
Navigate through our locations to find the location of your next house in Lodbourne, Gillingham for sale or to rent.
| Streets | Postcodes |
|---|---|
| Abbotts Way | SP8 4BS |
| Bay Lane | SP8 4ER |
| Bay Road | SP8 4EF SP8 4EP SP8 4EW |
| Bay Villas | SP8 4ES |
| Bayfields | SP8 4AE |
| Black Lawn | SP8 4SD |
| Bourne Way | SP8 4PF |
| Broad Acres | SP8 4SB |
| Brookside | SP8 4HR |
| Coronation Road | SP8 4BU |
| Fairey Crescent | SP8 4NY SP8 4PE |
| Fairybridge Walk | SP8 4SE |
| Highgrove | SP8 4SA |
| Hyde Road | SP8 4BX SP8 4DA SP8 4DD |
| Knoll Place | SP8 4HS |
| Lammas Close | SP8 4RP |
| Lodbourne | SP8 4DG |
| Lodbourne Gardens | SP8 4DF |
| Lodbourne Terrace | SP8 4DQ |
| Mill Race | SP8 4DW |
| Mulberry Close | SP8 4AU |
| Peacemarsh | SP8 4ET SP8 4EZ SP8 4HD |
| Roseberry Gardens | SP8 4RG |
| Saxon Mead Close | SP8 4HP |
| Shreen Close | SP8 4EN |
| Shreen Way | SP8 4EL SP8 4HT |
| Somerset Close | SP8 4LY |
| Sylvan Close | SP8 4EJ |
| Sylvan Way | SP8 4EQ |
| Wavering Lane East | SP8 4NS SP8 4NX |
| Waverland Terrace | SP8 4NT |
| Waverland Terrace Bungalows | SP8 4NU |
| Wessex Way | SP8 4LX |
| Wiltshire Close | SP8 4LZ |
Transport near Lodbourne
- FAQ
- Price Paid By Year
- Property Type Price
Frequently asked questions about Lodbourne
What is the average price for a property for sale in Lodbourne?
The average price for a property for sale in Lodbourne is £291,085. This amount is 8% lower than the average price in Gillingham. There are 849 property listings for sale in Lodbourne.
What streets have the most expensive properties for sale in Lodbourne?
The streets with the most expensive properties for sale in Lodbourne are Wavering Lane East at an average of £438,714, Brookside at an average of £419,333 and Bay Lane at an average of £407,500.
What streets have the most affordable properties for sale in Lodbourne?
The streets with the most affordable properties for sale in Lodbourne are Hyde Road at an average of £156,666, Wiltshire Close at an average of £213,050 and Coronation Road at an average of £215,000.
Which train stations are available in or near Lodbourne?
Some of the train stations available in or near Lodbourne are Gillingham (Dorset), Templecombe and Tisbury.
Property Price Paid in Lodbourne by Year
The average sold property price by year was:
| Year | Average Sold Price | Price Change |
Sold Properties
|
|---|---|---|---|
| 2025 | £292,567 | 6% |
26 Properties |
| 2024 | £273,953 | -12% |
32 Properties |
| 2023 | £308,075 | 2% |
30 Properties |
| 2022 | £300,858 | 2% |
48 Properties |
| 2021 | £295,484 | 22% |
48 Properties |
| 2020 | £231,060 | -17% |
32 Properties |
| 2019 | £269,439 | 5% |
32 Properties |
| 2018 | £254,926 | 14% |
34 Properties |
| 2017 | £218,676 | -2% |
40 Properties |
| 2016 | £222,870 | 9% |
39 Properties |
| 2015 | £203,625 | -0,2% |
39 Properties |
| 2014 | £203,987 | 4% |
40 Properties |
| 2013 | £196,324 | 6% |
27 Properties |
| 2012 | £184,142 | 2% |
35 Properties |
| 2011 | £179,883 | -17% |
26 Properties |
| 2010 | £210,046 | 23% |
32 Properties |
| 2009 | £161,593 | -6% |
31 Properties |
| 2008 | £171,700 | -20% |
20 Properties |
| 2007 | £206,634 | 3% |
46 Properties |
| 2006 | £201,149 | 9% |
57 Properties |
| 2005 | £182,096 | 3% |
41 Properties |
| 2004 | £177,379 | 4% |
60 Properties |
| 2003 | £169,742 | 24% |
54 Properties |
| 2002 | £129,631 | 16% |
50 Properties |
| 2001 | £109,437 | 30% |
54 Properties |
| 2000 | £77,147 | 2% |
43 Properties |
| 1999 | £75,732 | 13% |
43 Properties |
| 1998 | £66,115 | 10% |
51 Properties |
| 1997 | £59,560 | 3% |
54 Properties |
| 1996 | £57,701 | 3% |
42 Properties |
| 1995 | £55,756 | - |
33 Properties |
Property Price per Property Type in Lodbourne
Here you can find historic sold price data in order to help with your property search.
The average Property Paid Price for specific property types in the last three years are:
| Property Type | Average Sold Price | Sold Properties |
|---|---|---|
| Semi Detached House | £237,937.00 | 36 Semi Detached Houses |
| Detached House | £368,572.00 | 38 Detached Houses |
| Terraced House | £250,000.00 | 10 Terraced Houses |
| Flat | £136,000.00 | 4 Flats |

