Houses for sale & to rent in Gillingham Town, Gillingham
House Prices in Gillingham Town
Properties in Gillingham Town have an average house price of £197,918.00 and had 145 Property Transactions within the last 3 years¹.
Gillingham Town is an area in Gillingham, Dorset with 959 households², where the most expensive property was sold for £735,000.00.
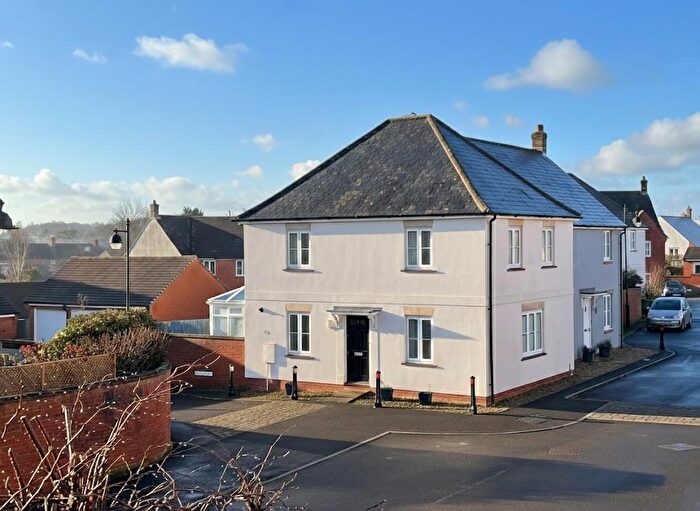
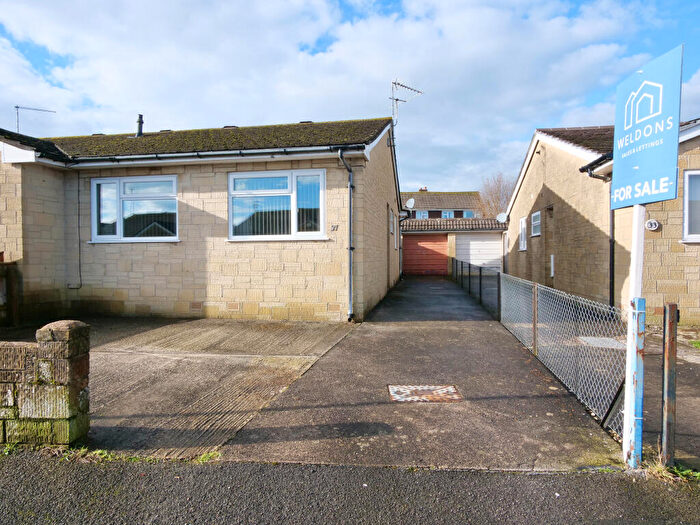
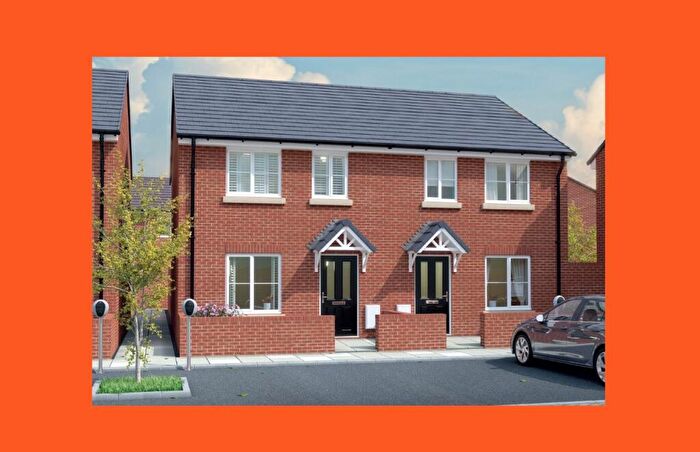
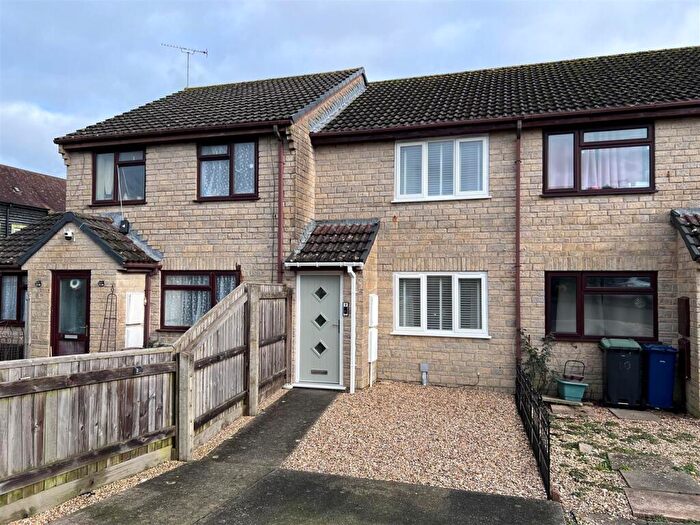
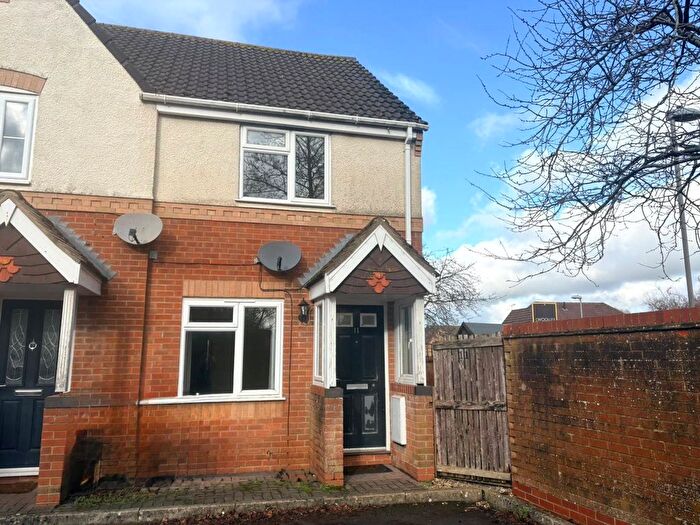
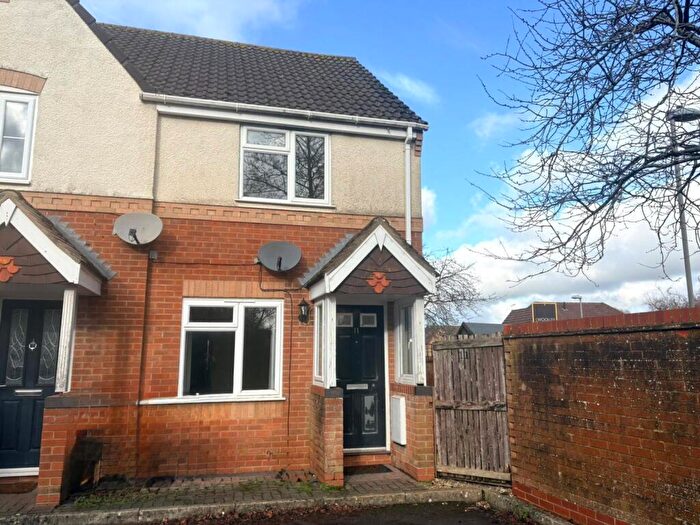
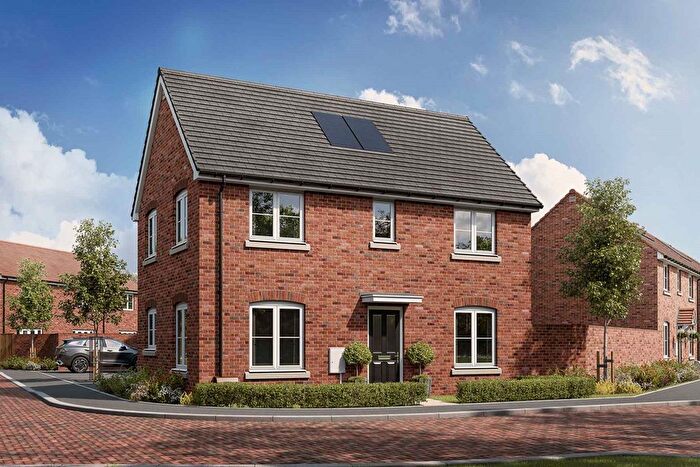
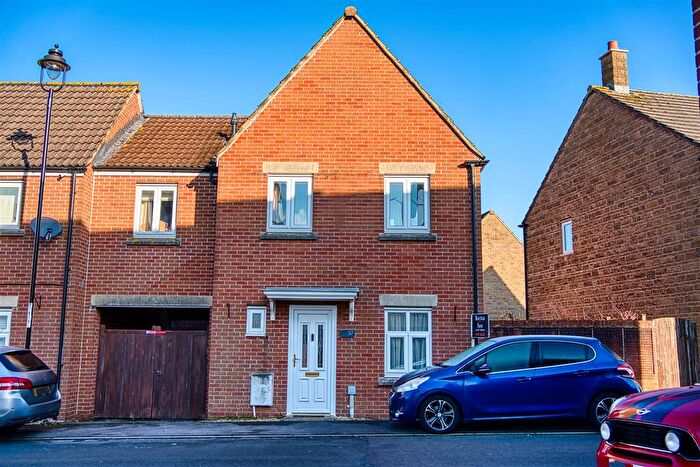
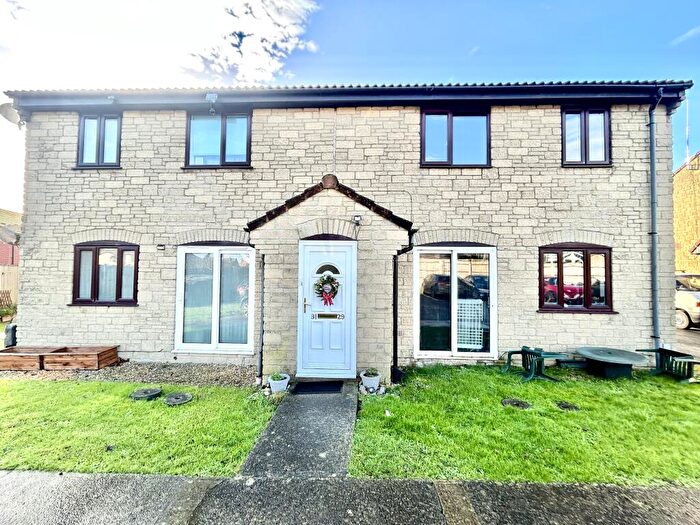
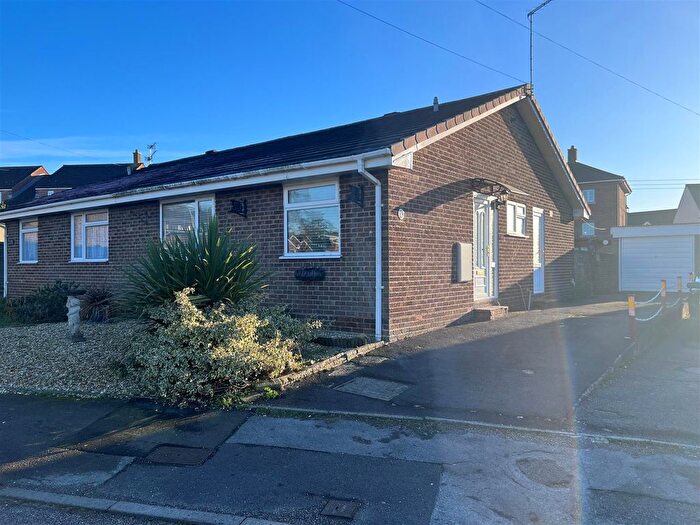
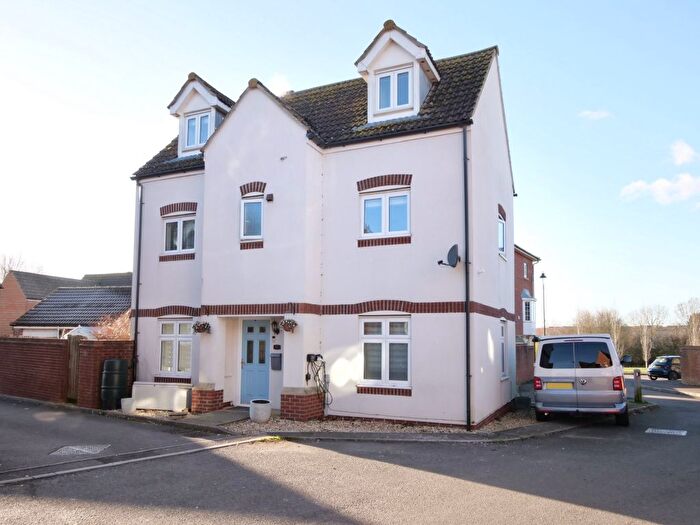
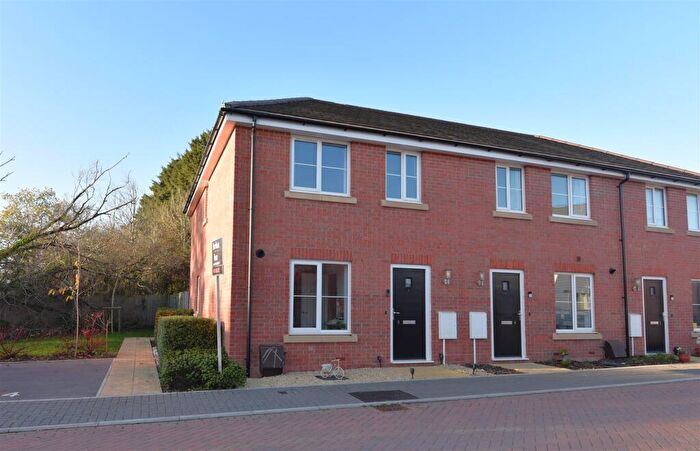
Properties for sale in Gillingham Town
Roads and Postcodes in Gillingham Town
Navigate through our locations to find the location of your next house in Gillingham Town, Gillingham for sale or to rent.
| Streets | Postcodes |
|---|---|
| Addison Close | SP8 4JS SP8 4LR |
| Addison Terrace | SP8 4JP |
| Barnaby Mead | SP8 4AD SP8 4AL |
| Buckingham Road | SP8 4QF |
| Cemetery Road | SP8 4AZ |
| Chapel Mews | SP8 4FY |
| Church Walk | SP8 4DR |
| Coronation Road | SP8 4BT |
| Cypress Way | SP8 4BY |
| Deweys Way | SP8 4BW |
| Floramour Place | SP8 4BF |
| Gordon Villas | SP8 4JQ |
| Hardings Lane | SP8 4HX |
| High Street | SP8 4AA SP8 4AG SP8 4AH SP8 4AW SP8 4QT |
| King John Road | SP8 4PG |
| Lawrence Cottages | SP8 4JU |
| Lawrence Walk | SP8 4PD |
| Le Neubourg Way | SP8 4XH |
| Lodbourne Green | SP8 4EH |
| Lodden | SP8 4JY |
| Meadowcroft | SP8 4SR |
| New Road | SP8 4JG SP8 4JH SP8 4JL |
| Newbury | SP8 4HG SP8 4HZ SP8 4JX SP8 4QG SP8 4QH SP8 4QJ SP8 4WG |
| Oake Woods | SP8 4QS |
| Octave Terrace | SP8 4DT |
| Orchard Court | SP8 4QZ |
| Orchard Road | SP8 4BQ |
| Palace Road | SP8 4PQ |
| Pottery Villas | SP8 4JW |
| Prospect Close | SP8 4NZ |
| Queen Eleanor Road | SP8 4PH |
| Queen Street | SP8 4DX SP8 4DZ SP8 4EA SP8 4EE |
| Railway Terrace | SP8 4JF |
| Rose Court | SP8 4TS |
| Rufus Court | SP8 4SZ |
| School Road | SP8 4QR |
| South Street | SP8 4AP |
| St Martins Square | SP8 4DP |
| St Mary's Place | SP8 4AT |
| Station Road | SP8 4PY SP8 4QA |
| The Firs | SP8 4HU |
| The Meadows | SP8 4SP |
| The Square | SP8 4AR |
| Tomlins Corner | SP8 4DJ |
| Tomlins Lane | SP8 4BH SP8 4BL |
| Turners Lane | SP8 4BG |
| Victoria Road | SP8 4HY |
| Victoria Terrace | SP8 4BE |
| White House Court | SP8 4DU |
Transport near Gillingham Town
- FAQ
- Price Paid By Year
- Property Type Price
Frequently asked questions about Gillingham Town
What is the average price for a property for sale in Gillingham Town?
The average price for a property for sale in Gillingham Town is £197,918. This amount is 37% lower than the average price in Gillingham. There are 905 property listings for sale in Gillingham Town.
What streets have the most expensive properties for sale in Gillingham Town?
The streets with the most expensive properties for sale in Gillingham Town are St Martins Square at an average of £390,000, Floramour Place at an average of £340,000 and Lodbourne Green at an average of £276,625.
What streets have the most affordable properties for sale in Gillingham Town?
The streets with the most affordable properties for sale in Gillingham Town are Meadowcroft at an average of £76,222, Addison Close at an average of £136,428 and Newbury at an average of £147,190.
Which train stations are available in or near Gillingham Town?
Some of the train stations available in or near Gillingham Town are Gillingham (Dorset), Templecombe and Tisbury.
Property Price Paid in Gillingham Town by Year
The average sold property price by year was:
| Year | Average Sold Price | Price Change |
Sold Properties
|
|---|---|---|---|
| 2025 | £206,633 | 1% |
51 Properties |
| 2024 | £205,553 | 12% |
47 Properties |
| 2023 | £180,827 | -4% |
47 Properties |
| 2022 | £187,920 | -11% |
68 Properties |
| 2021 | £208,028 | -5% |
53 Properties |
| 2020 | £217,753 | 8% |
36 Properties |
| 2019 | £201,069 | 5% |
43 Properties |
| 2018 | £191,867 | 9% |
49 Properties |
| 2017 | £174,986 | 7% |
72 Properties |
| 2016 | £163,110 | 4% |
56 Properties |
| 2015 | £156,173 | 3% |
63 Properties |
| 2014 | £150,833 | 8% |
74 Properties |
| 2013 | £139,227 | -12% |
36 Properties |
| 2012 | £156,351 | -5% |
38 Properties |
| 2011 | £164,860 | 1% |
34 Properties |
| 2010 | £163,635 | 7% |
37 Properties |
| 2009 | £152,105 | -2% |
27 Properties |
| 2008 | £155,125 | -0,4% |
38 Properties |
| 2007 | £155,792 | 2% |
137 Properties |
| 2006 | £152,364 | 5% |
108 Properties |
| 2005 | £145,390 | -0,1% |
58 Properties |
| 2004 | £145,597 | 4% |
62 Properties |
| 2003 | £139,625 | 11% |
91 Properties |
| 2002 | £124,028 | 35% |
132 Properties |
| 2001 | £80,995 | 10% |
62 Properties |
| 2000 | £72,833 | 16% |
42 Properties |
| 1999 | £61,480 | 8% |
66 Properties |
| 1998 | £56,737 | 3% |
50 Properties |
| 1997 | £55,202 | 6% |
52 Properties |
| 1996 | £51,873 | 15% |
50 Properties |
| 1995 | £44,003 | - |
30 Properties |
Property Price per Property Type in Gillingham Town
Here you can find historic sold price data in order to help with your property search.
The average Property Paid Price for specific property types in the last three years are:
| Property Type | Average Sold Price | Sold Properties |
|---|---|---|
| Semi Detached House | £246,525.00 | 20 Semi Detached Houses |
| Detached House | £362,133.00 | 15 Detached Houses |
| Terraced House | £221,584.00 | 51 Terraced Houses |
| Flat | £119,236.00 | 59 Flats |

