
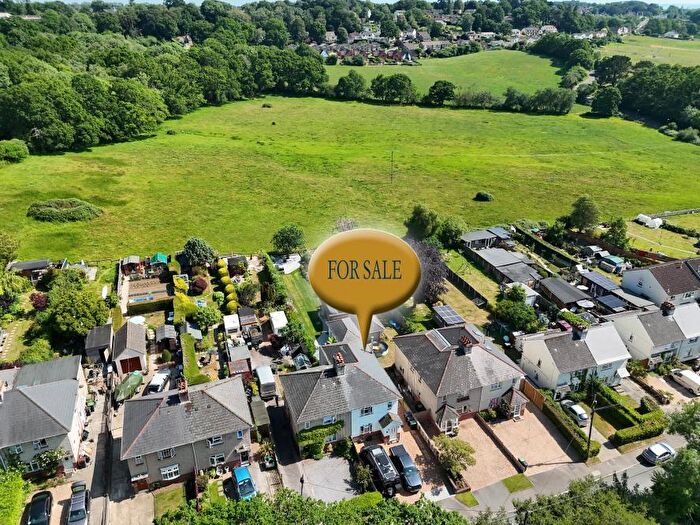
Houses for sale in Corfe Mullen North, Wimborne
House Prices in Corfe Mullen North
Properties in Corfe Mullen North have an average house price of £515k and had 59 Property Transactions within the last 3 years¹.
Corfe Mullen North is an area in Wimborne, Dorset with 1,035 households², where the most expensive property was sold for £1.13M.
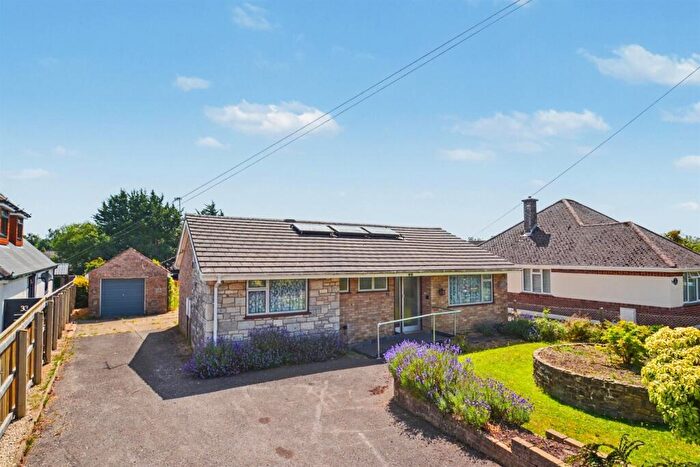
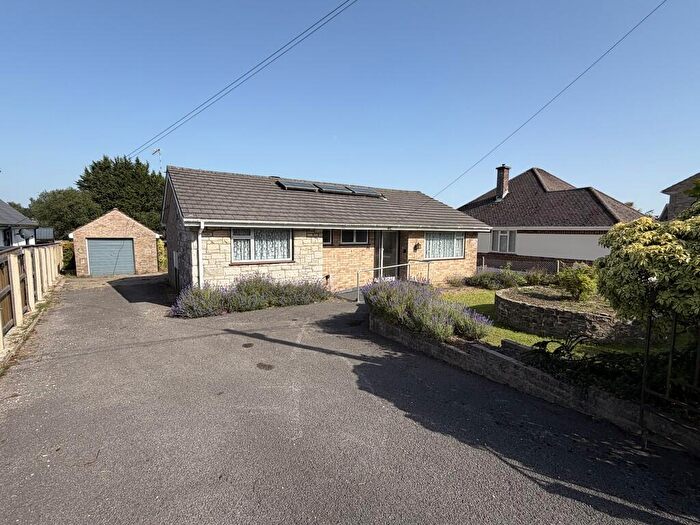
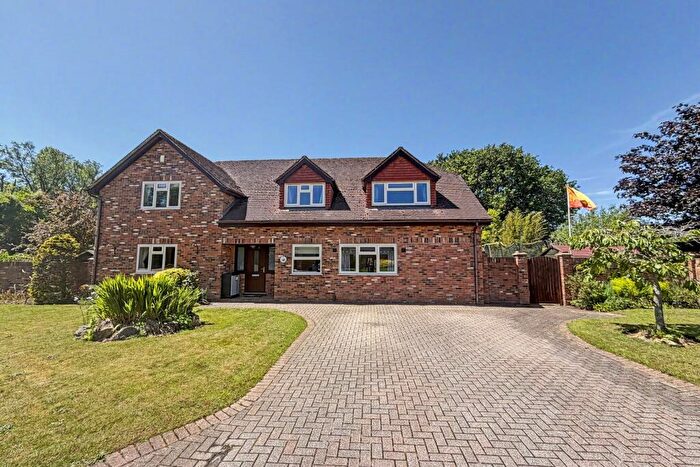
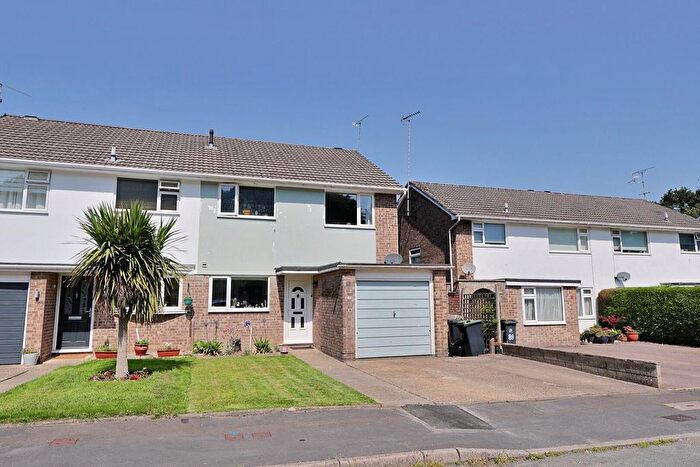
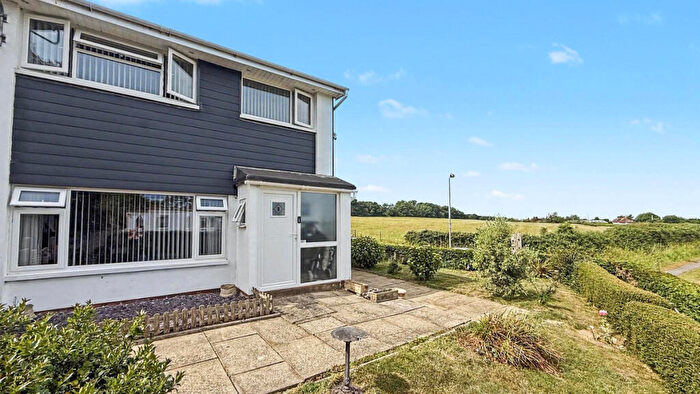
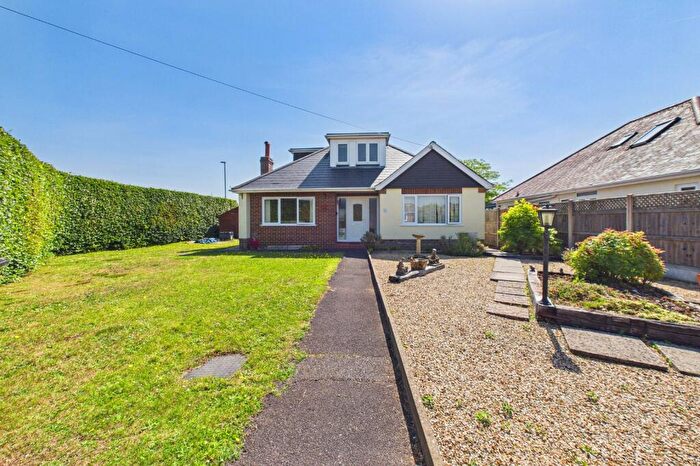
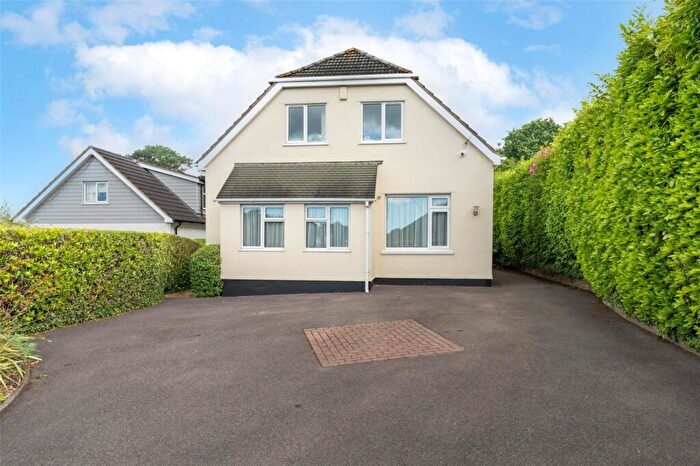
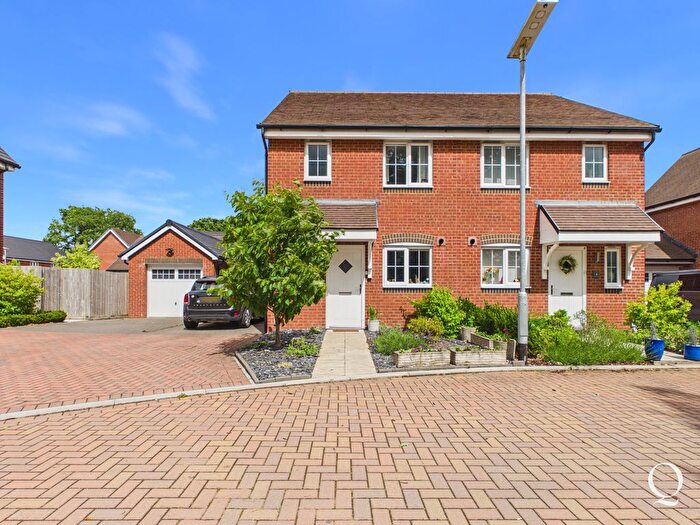
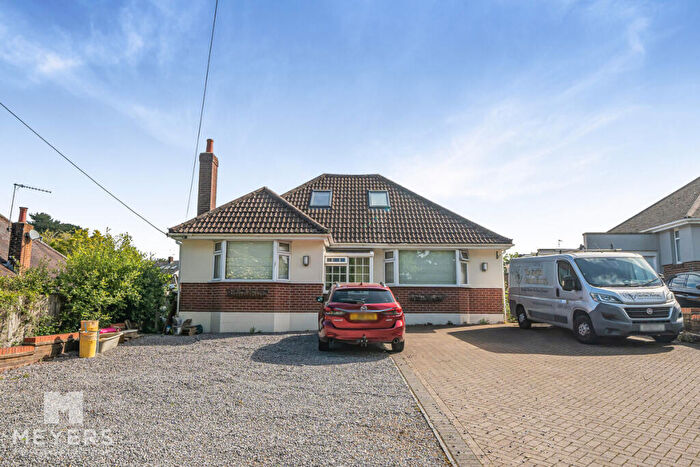
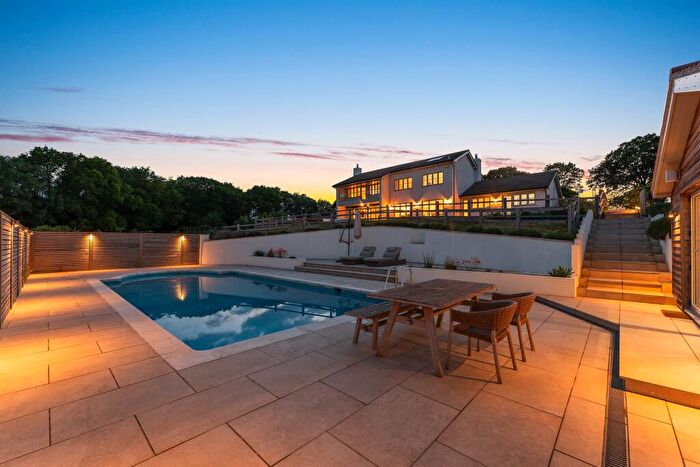
Properties for sale in Corfe Mullen North
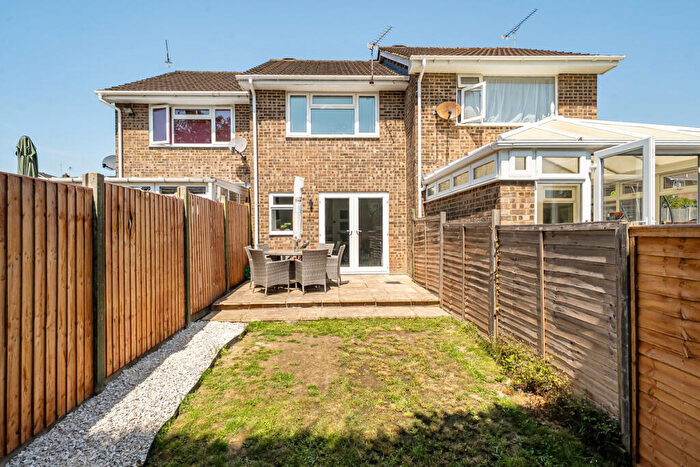
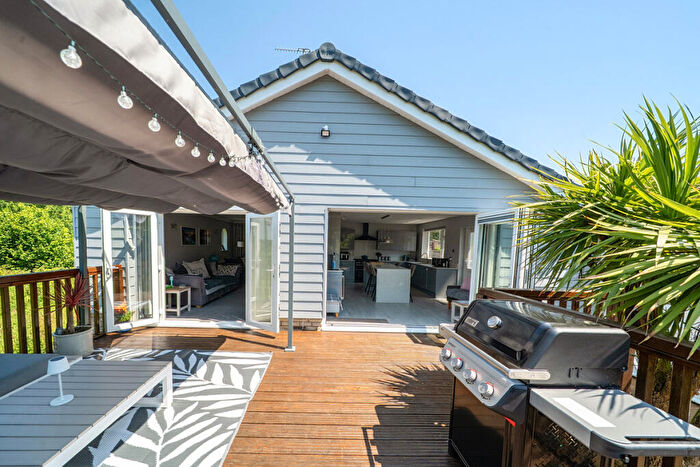
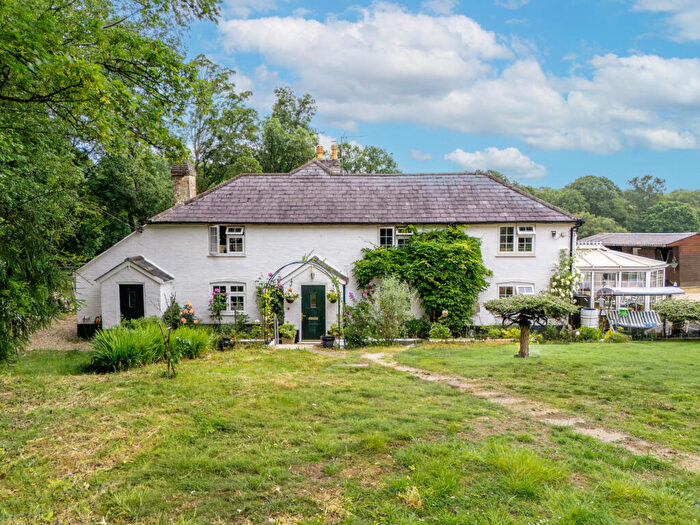
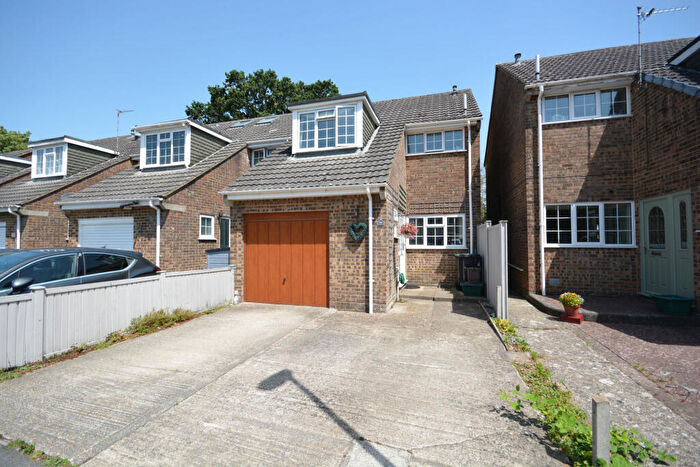
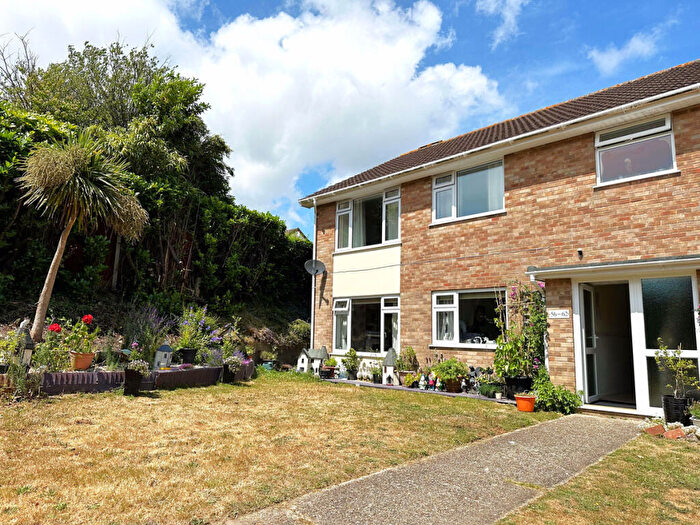
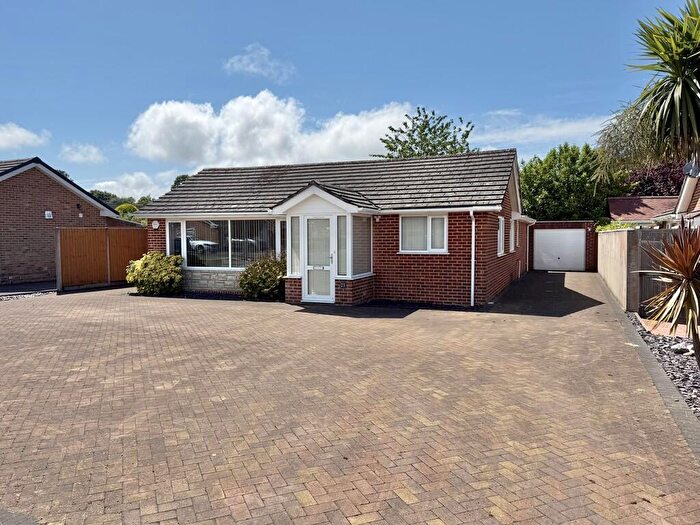
![]()
If you are looking to sell your house, let it out, or receive a property valuation, an expert can help you.
Click the button below to get started.

Roads and Postcodes in Corfe Mullen North
Navigate through our locations to find the location of your next house in Corfe Mullen North, Wimborne for sale or to rent.
| Streets | Postcodes |
|---|---|
| Badbury View Road | BH21 3HU |
| Blandford Road | BH21 3HE BH21 3HG BH21 3HH BH21 3HJ BH21 3HQ |
| Brickyard Lane | BH21 3RJ |
| Broadmoor Road | BH21 3RA BH21 3RB |
| Brog Street | BH21 3HB |
| Candys Close | BH21 3EL |
| Candys Lane | BH21 3EF |
| Cogdean Close | BH21 3XA |
| Cogdean Walk | BH21 3XB |
| Cogdean Way | BH21 3XD |
| Corfe Halt Close | BH21 3EH |
| Diana Way | BH21 3XE |
| Dorchester Road | BH21 3HA |
| Field Way | BH21 3XH |
| Georges Mews | BH21 3UF |
| Hadrian Way | BH21 3XF |
| Happy Bottom | BH21 3DP |
| Haywards Lane | BH21 3HP BH21 3HR |
| Higher Merley Lane | BH21 3EG |
| Jupiter Way | BH21 3XG |
| Knoll Lane | BH21 3RF BH21 3RG |
| Lambs Green Lane | BH21 3DN |
| Meadow Farm Lane | BH21 3HT |
| Mill Street | BH21 3RH BH21 3RQ |
| Newtown Lane | BH21 3EY |
| Old Rectory Close | BH21 3EP |
| Orchard Close | BH21 3TW |
| Orchard Lane | BH21 3SU |
| Pardys Hill | BH21 3HW |
| Pine Road | BH21 3DW |
| Rectory Avenue | BH21 3EZ |
| Ridgeway | BH21 3HS |
| Roman Heights | BH21 3XQ |
| Rushall Lane | BH21 3RT |
| Sleight Lane | BH21 3HL |
| Stour View Gardens | BH21 3SZ BH21 3TL BH21 3TN |
| Towers Way | BH21 3UA BH21 3UB |
| Victoria Cottages | BH21 3HN |
| Violet Farm Close | BH21 3DR |
| Wareham Road | BH21 3LE |
| Wayground Road | BH21 3ED |
| Wimborne Road | BH21 3DS BH21 3DU BH21 3DX BH21 3DY BH21 3EA BH21 3EB |
Property price trends in Corfe Mullen North
According to the latest Land Registry data, the average home in Corfe Mullen North sold for £755,000 in 2026. That figure comes from 1,263 sales logged over the past 31 years.
Prices have continued to climb over the last three years. Compared with 2023, when the typical sale came in around £495,393, that's a rise of roughly 52.4%.
Looking back five years, average prices are up about 53.6% since 2021, a gain of around £263,383 in cash terms.
Zoom out to the past decade for the fuller picture. Back in 2016, homes here averaged £367,367, so the typical sold price has climbed about 105.5% since then, roughly 7.5% a year. Stretch the view to fifteen years and that annual pace holds at about 7.5%.
Frequently asked questions about Corfe Mullen North
What is the average price for a property for sale in Corfe Mullen North?
The average price for a property for sale in Corfe Mullen North is £514,861. This amount is 15% higher than the average price in Wimborne. There are 1,622 property listings for sale in Corfe Mullen North.
What streets have the most expensive properties for sale in Corfe Mullen North?
The streets with the most expensive properties for sale in Corfe Mullen North are Blandford Road at an average of £826,750, Knoll Lane at an average of £777,500 and Wayground Road at an average of £772,000.
What streets have the most affordable properties for sale in Corfe Mullen North?
The streets with the most affordable properties for sale in Corfe Mullen North are Diana Way at an average of £285,000, Candys Close at an average of £321,000 and Towers Way at an average of £328,462.
Which train stations are available in or near Corfe Mullen North?
Some of the train stations available in or near Corfe Mullen North are Hamworthy, Poole and Parkstone.
Property Price Paid in Corfe Mullen North by Year
The average sold property price by year was:
| Year | Average Sold Price | Price Change |
Sold Properties
|
|---|---|---|---|
| 2026 | £755,000 | 32% |
1 Property |
| 2025 | £515,997 | -1% |
20 Properties |
| 2024 | £521,888 | 5% |
18 Properties |
| 2023 | £495,393 | -10% |
20 Properties |
| 2022 | £544,923 | 10% |
23 Properties |
| 2021 | £491,617 | 7% |
49 Properties |
| 2020 | £455,593 | 15% |
43 Properties |
| 2019 | £387,976 | 7% |
43 Properties |
| 2018 | £362,453 | -19% |
32 Properties |
| 2017 | £433,011 | 15% |
38 Properties |
Property Price per Property Type in Corfe Mullen North
Here you can find historic sold price data in order to help with your property search.
The average Property Paid Price for specific property types in the last three years are:
| Property Type | Average Sold Price | Sold Properties |
|---|---|---|
| Semi Detached House | £368,040.00 | 13 Semi Detached Houses |
| Detached House | £578,058.00 | 42 Detached Houses |
| Terraced House | £328,462.00 | 4 Terraced Houses |
