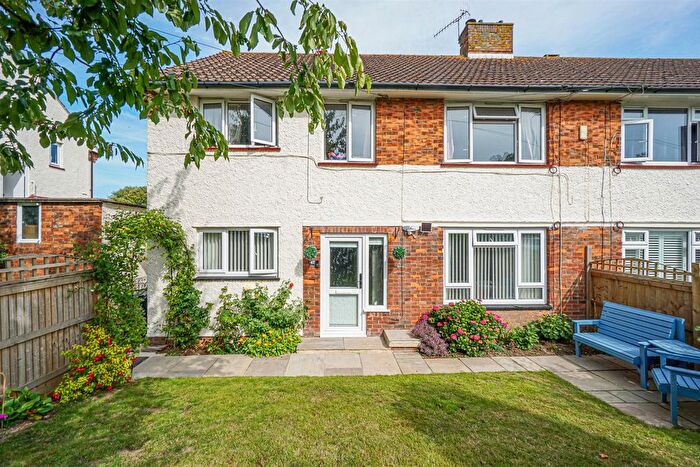
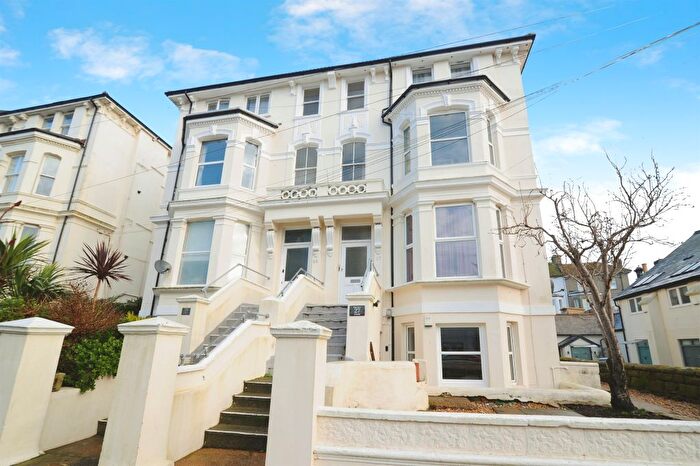
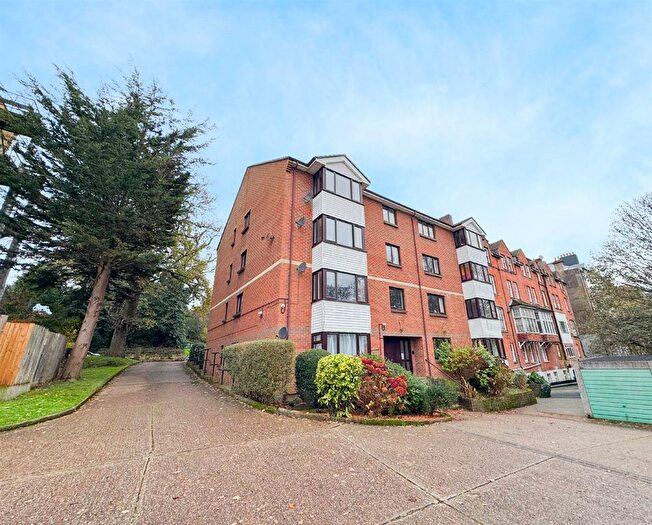
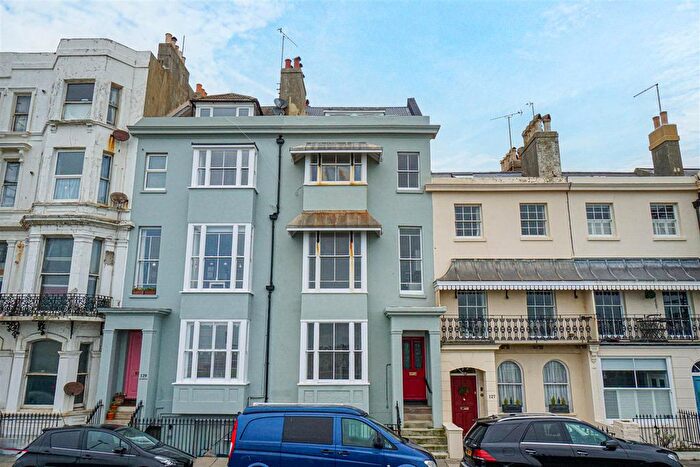
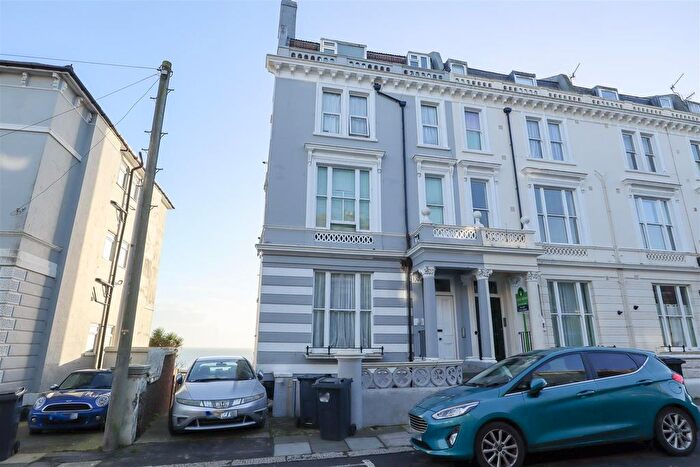
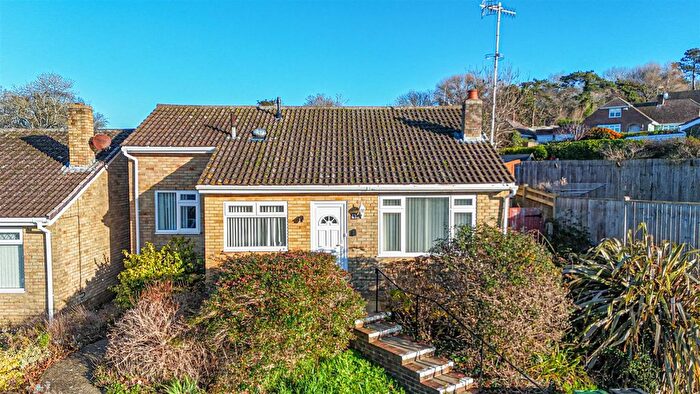
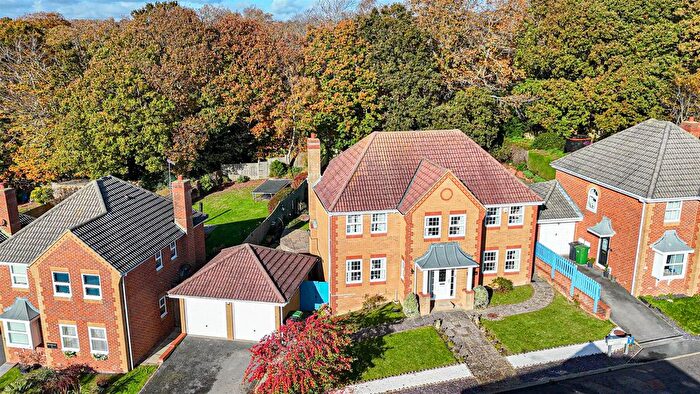
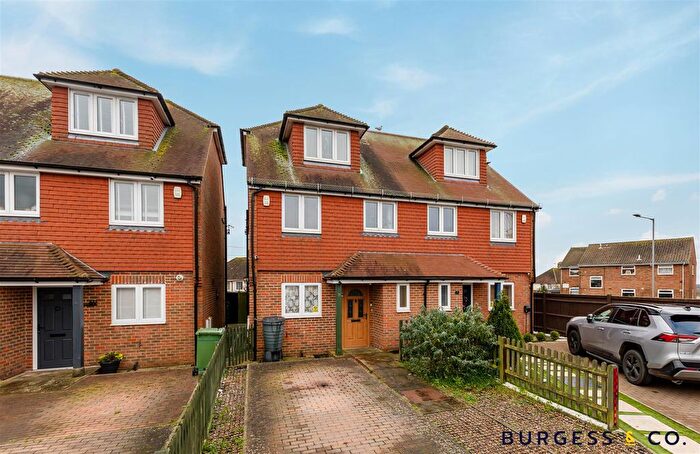
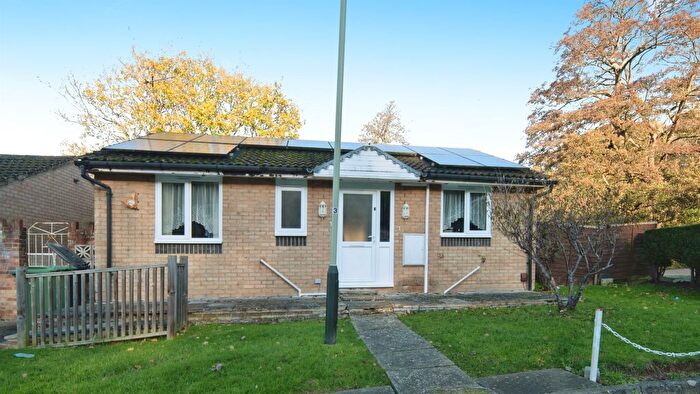
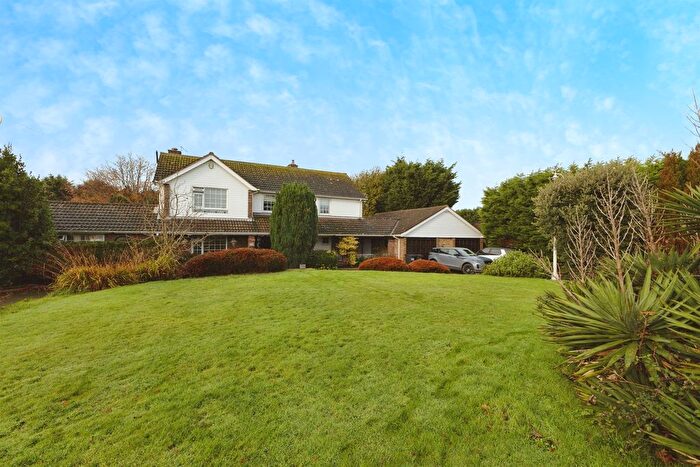
Houses for sale & to rent in West St Leonards, St Leonards-on-sea
House Prices in West St Leonards
Properties in West St Leonards have an average house price of £317,362.00 and had 306 Property Transactions within the last 3 years¹.
West St Leonards is an area in St Leonards-on-sea, East Sussex with 2,180 households², where the most expensive property was sold for £785,000.00.
Properties for sale in West St Leonards
Roads and Postcodes in West St Leonards
Navigate through our locations to find the location of your next house in West St Leonards, St Leonards-on-sea for sale or to rent.
| Streets | Postcodes |
|---|---|
| Abbey Drive | TN38 8BD |
| Albourne Close | TN38 0GT |
| Amsterdam Way | TN38 8DZ |
| Arnbury Mews | TN38 8AQ |
| Arnside Road | TN38 8AB |
| Asten Close | TN38 8DJ |
| Bexhill Road | TN38 8AH TN38 8AJ TN38 8AL TN38 8AR TN38 8AS TN38 8AT TN38 8AU TN38 8AX TN38 8AY TN38 8BG TN38 8BH TN38 8BL TN38 0AH TN38 0AN TN38 0AJ TN38 0YX TN38 8BN TN38 8FA |
| Bexleigh Avenue | TN38 8BA TN38 8BB |
| Blackwell Close | TN38 0BF |
| Bridgeway | TN38 8AP |
| Bulrush Place | TN38 9TR |
| Bulverhythe Road | TN38 8AA TN38 8AD TN38 8AE TN38 8AF |
| Bunting Close | TN38 8DG |
| Cinque Ports Way | TN38 0FD |
| Cliftonville Road | TN38 8AG |
| Conqueror Road | TN38 8DD |
| Darwell Close | TN38 9TN |
| Edinburgh Road | TN38 8DA TN38 8DB TN38 8HH |
| Fen Court | TN38 9TT |
| Fernside Avenue | TN38 0UU |
| Field Way | TN38 8DL TN38 8DS TN38 8DU |
| Filsham Road | TN38 0AX TN38 0AU |
| Georgian Walk | TN38 0GU |
| Gillsmans Park | TN38 0SW TN38 0SN |
| Grosvenor Crescent | TN38 0AA TN38 0BX |
| Grosvenor Gardens | TN38 0AE TN38 0AG |
| Harley Shute Road | TN38 8BP TN38 8BU TN38 8BY TN38 8DH TN38 9JH TN38 9JJ TN38 8BX TN38 8BZ |
| Harley Way | TN38 8BT |
| Hastings Road | TN40 2JU |
| Haven Road | TN38 8BJ |
| Heron Close | TN38 8DX |
| Hythe Avenue | TN38 8BE |
| Keats Close | TN38 0PP |
| Keymer Close | TN38 0YZ |
| Kite Close | TN38 8DR |
| Lovat Mead | TN38 8EH TN38 8EJ |
| Magpie Close | TN38 8DY |
| Meadowsweet Close | TN38 9TJ |
| Moorhen Close | TN38 8DQ |
| Newts Way | TN38 9TH |
| Railway Cottages | TN38 0AW |
| Reedswood Road | TN38 8DN TN38 8DP TN38 8DW |
| Rushmere Rise | TN38 9TS |
| Seaside Road | TN38 0AL TN38 0AQ |
| Springside Walk | TN38 0QF |
| St Saviours Road | TN38 0AP TN38 0AR TN38 0AS TN38 0YY |
| St Vincents Road | TN38 0AB |
| The Sedges | TN38 9TU |
| The Spaldings | TN38 9TP |
| Warren Close | TN38 8DT |
| Water Mint Close | TN38 9SZ |
| West Hill Road | TN38 0AY TN38 0AZ |
| William Road | TN38 8DE TN38 8DF |
| Wishingtree Lane | TN38 9JX |
Transport near West St Leonards
-
West St Leonards Station
-
St.Leonards Warrior Square Station
-
Hastings Station
-
Bexhill Station
-
Crowhurst Station
-
Ore Station
- FAQ
- Price Paid By Year
- Property Type Price
Frequently asked questions about West St Leonards
What is the average price for a property for sale in West St Leonards?
The average price for a property for sale in West St Leonards is £317,362. This amount is 8% higher than the average price in St Leonards-on-sea. There are 2,461 property listings for sale in West St Leonards.
What streets have the most expensive properties for sale in West St Leonards?
The streets with the most expensive properties for sale in West St Leonards are Gillsmans Park at an average of £565,200, Rushmere Rise at an average of £513,333 and Harley Shute Road at an average of £448,208.
What streets have the most affordable properties for sale in West St Leonards?
The streets with the most affordable properties for sale in West St Leonards are Lovat Mead at an average of £147,250, Harley Way at an average of £165,833 and Arnside Road at an average of £179,000.
Which train stations are available in or near West St Leonards?
Some of the train stations available in or near West St Leonards are West St Leonards, St.Leonards Warrior Square and Hastings.
Property Price Paid in West St Leonards by Year
The average sold property price by year was:
| Year | Average Sold Price | Price Change |
Sold Properties
|
|---|---|---|---|
| 2025 | £296,754 | 4% |
56 Properties |
| 2024 | £286,144 | -14% |
71 Properties |
| 2023 | £326,927 | -5% |
79 Properties |
| 2022 | £343,511 | 12% |
100 Properties |
| 2021 | £303,669 | 17% |
98 Properties |
| 2020 | £253,204 | 6% |
87 Properties |
| 2019 | £237,949 | -5% |
86 Properties |
| 2018 | £249,360 | 14% |
110 Properties |
| 2017 | £215,191 | -2% |
104 Properties |
| 2016 | £220,045 | 12% |
90 Properties |
| 2015 | £193,535 | 9% |
146 Properties |
| 2014 | £175,194 | 4% |
104 Properties |
| 2013 | £167,972 | -7% |
97 Properties |
| 2012 | £179,397 | 10% |
65 Properties |
| 2011 | £160,597 | -4% |
62 Properties |
| 2010 | £166,867 | -0,1% |
54 Properties |
| 2009 | £166,996 | -1% |
74 Properties |
| 2008 | £168,145 | -4% |
72 Properties |
| 2007 | £174,059 | 6% |
131 Properties |
| 2006 | £163,783 | 6% |
141 Properties |
| 2005 | £154,698 | 7% |
126 Properties |
| 2004 | £144,017 | 3% |
155 Properties |
| 2003 | £139,937 | 19% |
153 Properties |
| 2002 | £113,640 | 17% |
225 Properties |
| 2001 | £94,857 | 18% |
188 Properties |
| 2000 | £78,180 | 16% |
178 Properties |
| 1999 | £65,397 | 17% |
181 Properties |
| 1998 | £54,073 | -8% |
121 Properties |
| 1997 | £58,321 | 15% |
121 Properties |
| 1996 | £49,524 | 8% |
113 Properties |
| 1995 | £45,588 | - |
95 Properties |
Property Price per Property Type in West St Leonards
Here you can find historic sold price data in order to help with your property search.
The average Property Paid Price for specific property types in the last three years are:
| Property Type | Average Sold Price | Sold Properties |
|---|---|---|
| Semi Detached House | £306,269.00 | 105 Semi Detached Houses |
| Detached House | £480,806.00 | 71 Detached Houses |
| Terraced House | £264,943.00 | 73 Terraced Houses |
| Flat | £201,342.00 | 57 Flats |

