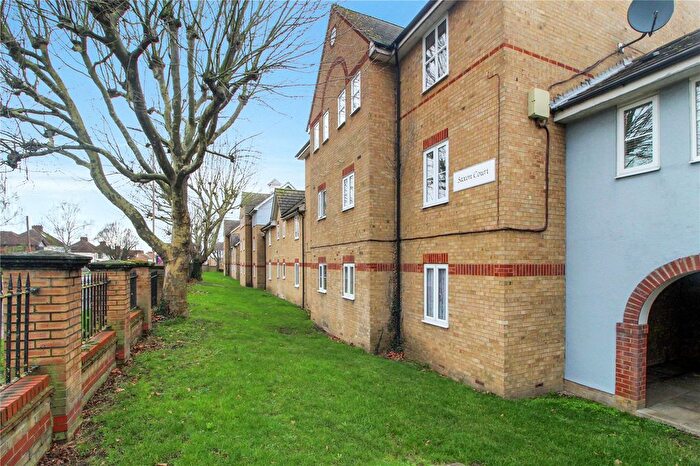
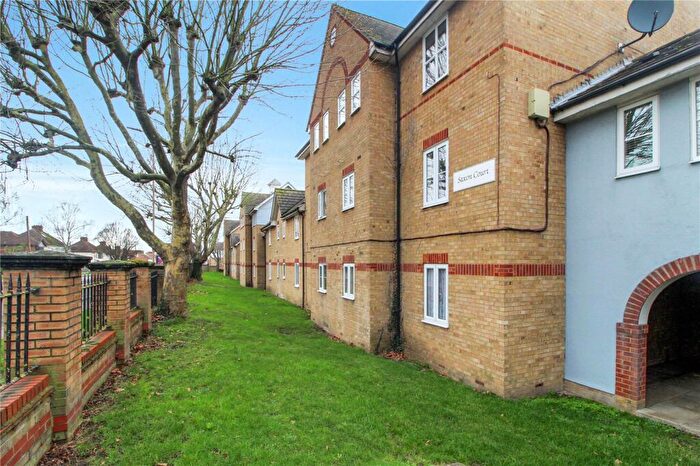
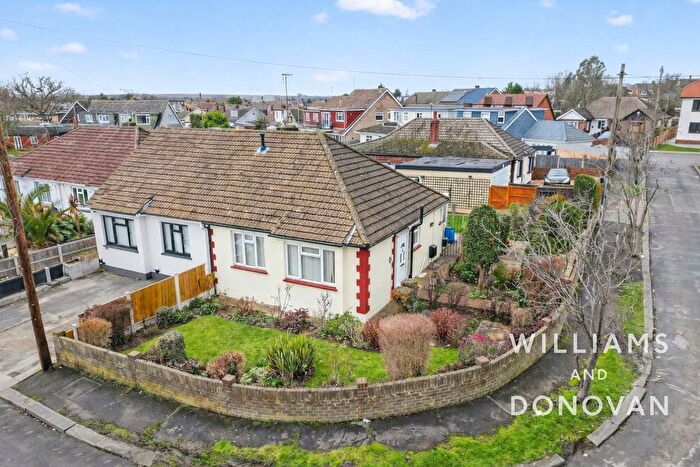
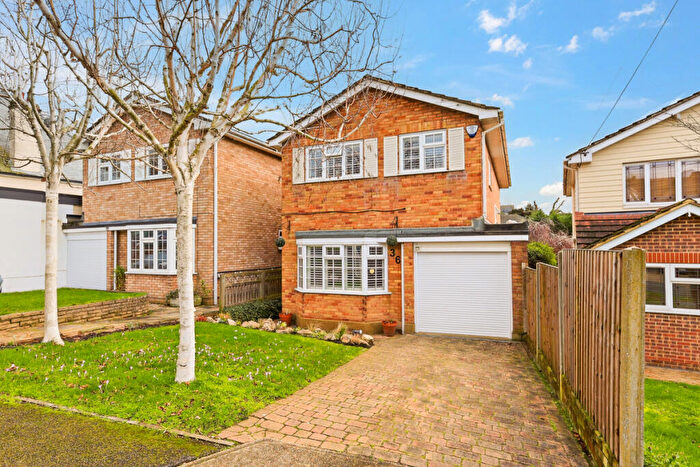
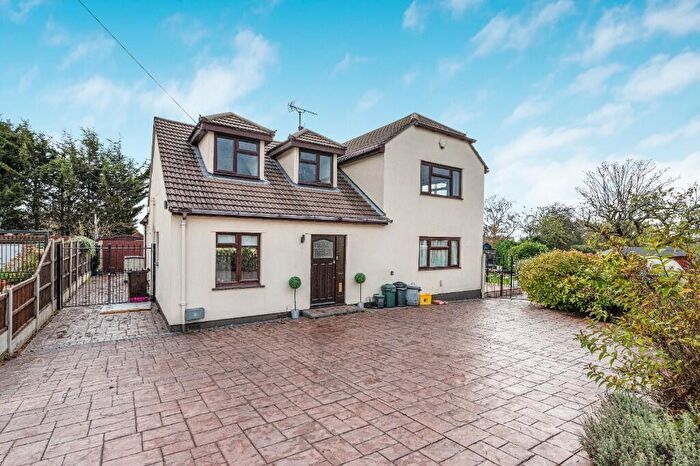
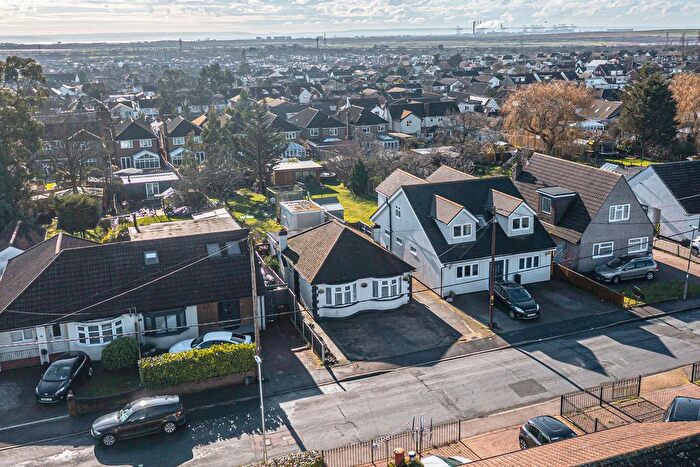
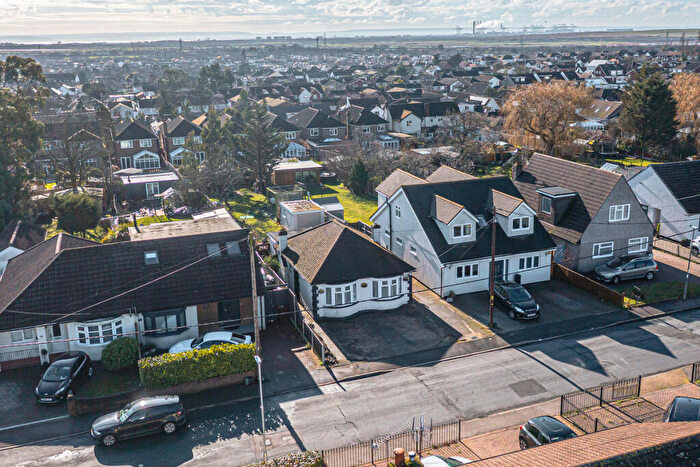
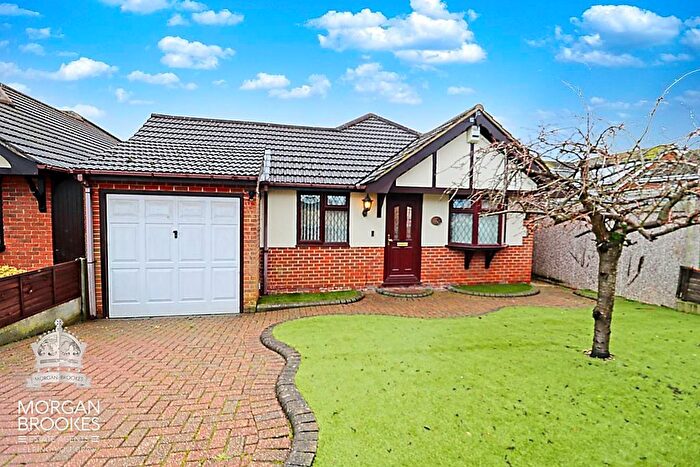
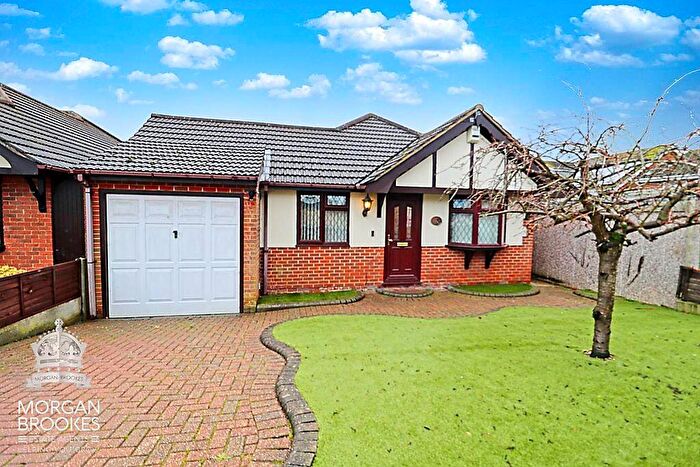
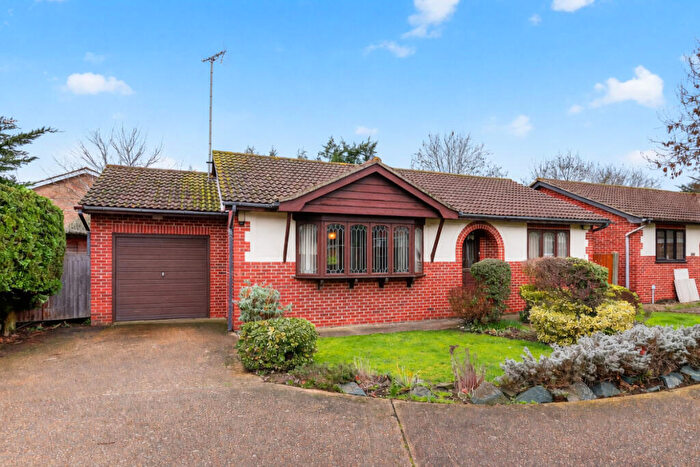
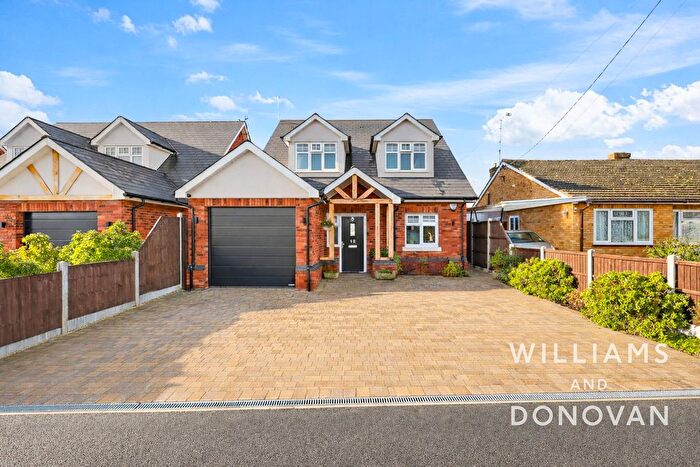
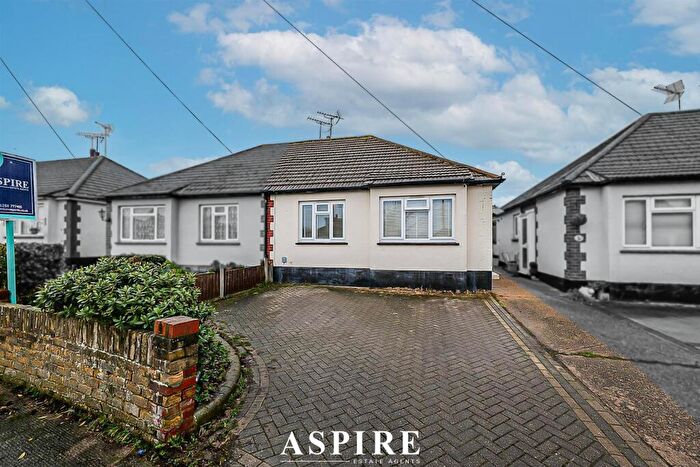
Houses for sale & to rent in St Marys, Benfleet
House Prices in St Marys
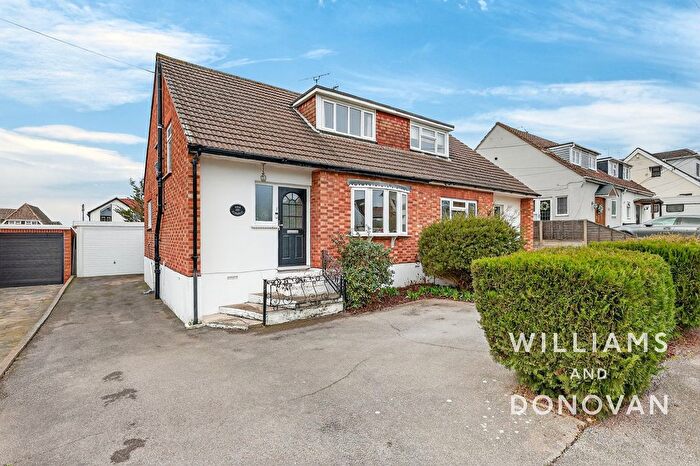
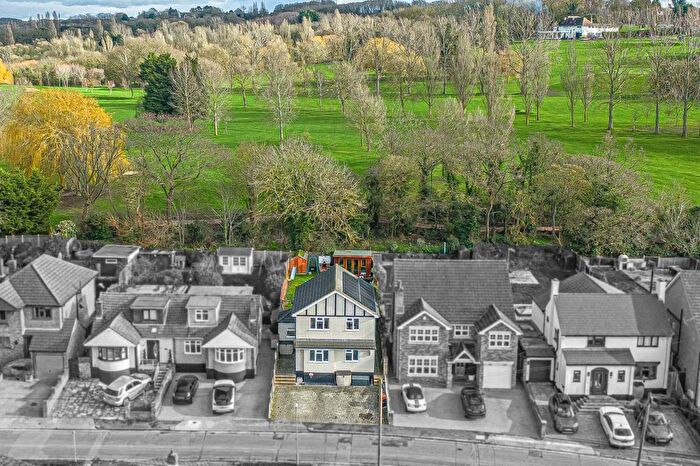
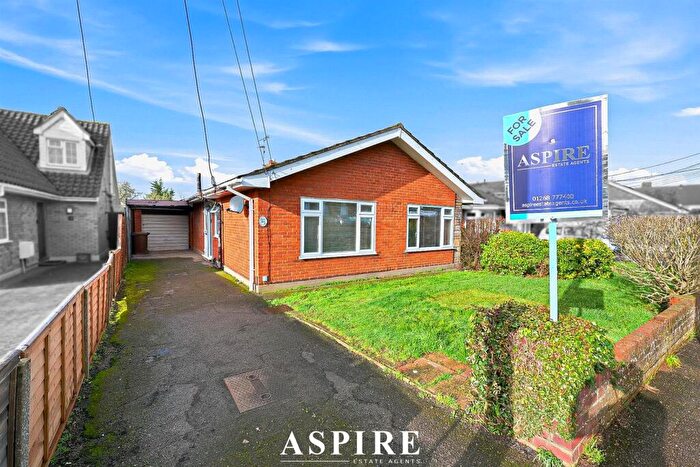
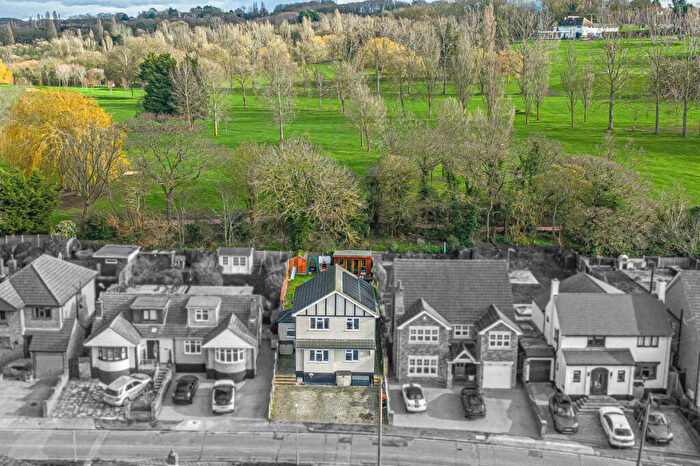
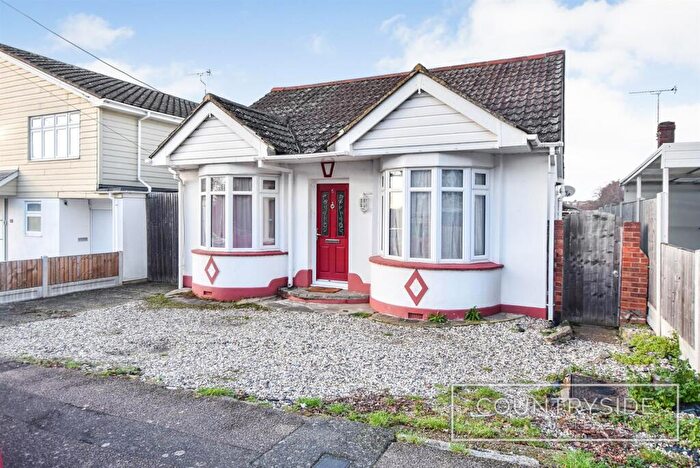
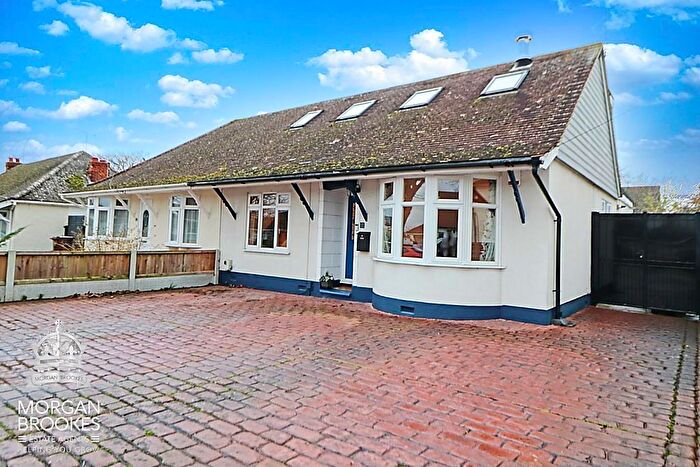
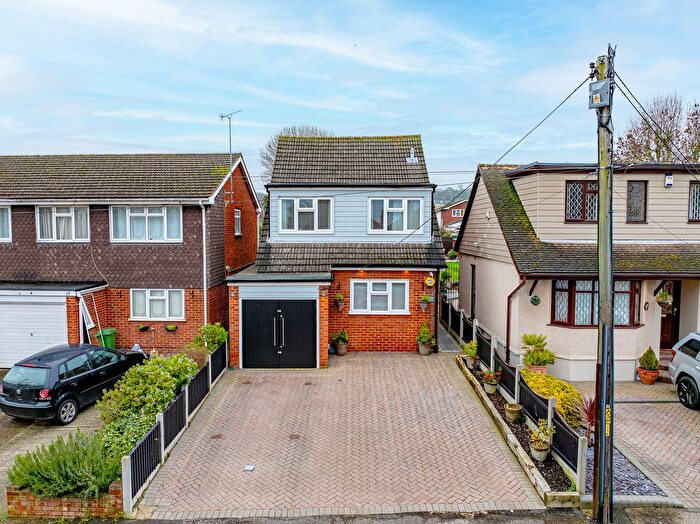
Properties in St Marys have an average house price of £398,003.62 and had 244 Property Transactions within the last 3 years¹.
St Marys is an area in Benfleet, Essex with 2,569 households², where the most expensive property was sold for £860,000.00.
Properties for sale in St Marys
Roads and Postcodes in St Marys
Navigate through our locations to find the location of your next house in St Marys, Benfleet for sale or to rent.
| Streets | Postcodes |
|---|---|
| Appleton Road | SS7 5DA SS7 5DB SS7 5DE |
| Benfleet Park Road | SS7 5HG SS7 5HJ |
| Boyce View Drive | SS7 5EA SS7 5EB |
| Brook Road | SS7 5JA SS7 5JB SS7 5JF SS7 5JG |
| Clarence Road | SS7 1DE |
| Con Way | SS7 1EF |
| Constitution Hill | SS7 1EB SS7 1ED |
| Cumberland Avenue | SS7 1DX SS7 1DY SS7 5NU SS7 5NY SS7 5PA SS7 5PB |
| Curlew Drive | SS7 5ET |
| Danesfield | SS7 5EE SS7 5EF |
| Dove Drive | SS7 5EW |
| Downesway | SS7 1EE |
| Elm View Road | SS7 5AR SS7 5AS |
| Fleet Road | SS7 5JE SS7 5JL SS7 5JN |
| Green Road | SS7 5JT |
| Greenways | SS7 5EG SS7 5EQ |
| Hall Farm Close | SS7 5JP |
| Hall Farm Road | SS7 5JD SS7 5JR SS7 5JS SS7 5JW SS7 5WS |
| Halle Mews | SS7 5FJ |
| High Beeches | SS7 5BG |
| High Road | SS7 5AD SS7 5AE SS7 5AF SS7 5AG SS7 5AQ SS7 5HA SS7 5HB SS7 5HL SS7 5HN SS7 5HP SS7 5HW SS7 5HX SS7 5HY SS7 5HZ SS7 5LH SS7 5LN SS7 5HD SS7 5HU |
| Holly Mews | SS7 5BZ |
| Hope Road | SS7 5JH SS7 5JJ SS7 5JQ |
| Jotmans Lane | SS7 5AX SS7 5BH SS7 5BJ SS7 5BL |
| Kents Hill Road | SS7 5PL SS7 5PN SS7 5PP |
| Kingfisher Drive | SS7 5ES |
| Limetree Avenue | SS7 5AA SS7 5AB |
| Linnet Drive | SS7 5ER |
| Loten Road | SS7 5DD SS7 5DP |
| Meggison Way | SS7 5AU |
| Melcombe Road | SS7 5NB |
| Merrivale | SS7 5HH SS7 5HQ |
| Oakfield Close | SS7 5NT |
| Oakfield Road | SS7 1DT SS7 1DU SS7 5NN SS7 5NP SS7 5NS SS7 5NW |
| Peregrine Drive | SS7 5EJ |
| Perry Road | SS7 5DJ SS7 5DL |
| Philmead Road | SS7 5DN SS7 5DW |
| Raven Drive | SS7 5EL |
| Richmond Avenue | SS7 5HE SS7 5HF |
| Sanderlings | SS7 5HS |
| Saxon Way | SS7 5ED |
| Shorefield | SS7 5BQ |
| South View Road | SS7 5NA |
| St Marys Close | SS7 5LJ |
| Swallow Drive | SS7 5EN |
| Thundersley Park Road | SS7 1EG |
| Tyrrell Road | SS7 5DH SS7 5DQ |
| Uplands Close | SS7 5BE |
| Uplands Road | SS7 5AY SS7 5BB SS7 5BD |
| Watlington Road | SS7 5DR SS7 5DS SS7 5DT |
| Wavertree Road | SS7 5AN SS7 5AP SS7 5AW |
| Wincoat Close | SS7 5AJ |
| Wincoat Drive | SS7 5AH |
| Woodham Park Drive | SS7 5EH SS7 5EP |
| Woodham Road | SS7 5DF SS7 5DG |
Transport near St Marys
-
Benfleet Station
-
Pitsea Station
-
Rayleigh Station
-
Leigh-On-Sea Station
-
Basildon Station
-
Wickford Station
-
Battlesbridge Station
- FAQ
- Price Paid By Year
- Property Type Price
Frequently asked questions about St Marys
What is the average price for a property for sale in St Marys?
The average price for a property for sale in St Marys is £398,004. This amount is 4% lower than the average price in Benfleet. There are 1,305 property listings for sale in St Marys.
What streets have the most expensive properties for sale in St Marys?
The streets with the most expensive properties for sale in St Marys are Green Road at an average of £625,000, Wavertree Road at an average of £585,000 and Fleet Road at an average of £556,625.
What streets have the most affordable properties for sale in St Marys?
The streets with the most affordable properties for sale in St Marys are Saxon Way at an average of £295,000, Downesway at an average of £296,500 and Merrivale at an average of £304,375.
Which train stations are available in or near St Marys?
Some of the train stations available in or near St Marys are Benfleet, Pitsea and Rayleigh.
Property Price Paid in St Marys by Year
The average sold property price by year was:
| Year | Average Sold Price | Price Change |
Sold Properties
|
|---|---|---|---|
| 2025 | £411,084 | 2% |
75 Properties |
| 2024 | £402,000 | 6% |
98 Properties |
| 2023 | £378,669 | 1% |
71 Properties |
| 2022 | £373,028 | 1% |
96 Properties |
| 2021 | £367,874 | 5% |
164 Properties |
| 2020 | £350,214 | 3% |
98 Properties |
| 2019 | £340,332 | 2% |
105 Properties |
| 2018 | £332,163 | - |
84 Properties |
| 2017 | £332,276 | 7% |
106 Properties |
| 2016 | £307,600 | 11% |
116 Properties |
| 2015 | £274,472 | 17% |
122 Properties |
| 2014 | £226,761 | -0,2% |
113 Properties |
| 2013 | £227,141 | 7% |
115 Properties |
| 2012 | £212,297 | 3% |
74 Properties |
| 2011 | £205,373 | -3% |
68 Properties |
| 2010 | £212,467 | 6% |
87 Properties |
| 2009 | £199,868 | -3% |
74 Properties |
| 2008 | £204,869 | -9% |
81 Properties |
| 2007 | £223,730 | 17% |
161 Properties |
| 2006 | £186,669 | -3% |
131 Properties |
| 2005 | £192,822 | 8% |
121 Properties |
| 2004 | £177,927 | 8% |
124 Properties |
| 2003 | £164,560 | 17% |
147 Properties |
| 2002 | £137,375 | 21% |
153 Properties |
| 2001 | £108,751 | 13% |
135 Properties |
| 2000 | £94,817 | 14% |
133 Properties |
| 1999 | £81,892 | 8% |
141 Properties |
| 1998 | £75,321 | 8% |
124 Properties |
| 1997 | £69,009 | 12% |
124 Properties |
| 1996 | £60,708 | -6% |
137 Properties |
| 1995 | £64,156 | - |
108 Properties |
Property Price per Property Type in St Marys
Here you can find historic sold price data in order to help with your property search.
The average Property Paid Price for specific property types in the last three years are:
| Property Type | Average Sold Price | Sold Properties |
|---|---|---|
| Semi Detached House | £391,248.00 | 141 Semi Detached Houses |
| Detached House | £502,048.00 | 59 Detached Houses |
| Terraced House | £348,888.00 | 18 Terraced Houses |
| Flat | £232,538.00 | 26 Flats |

