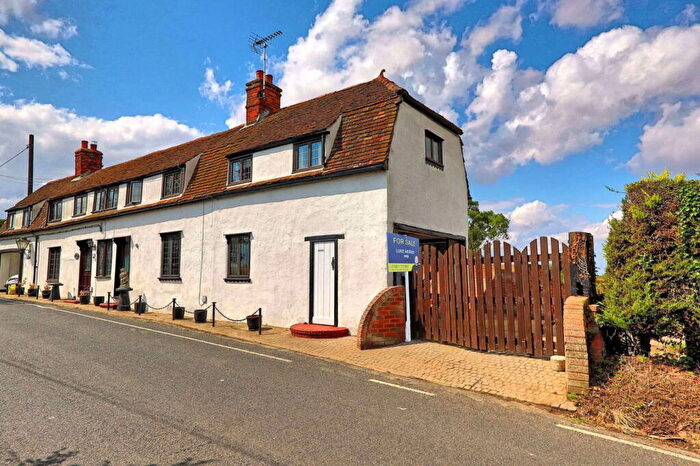
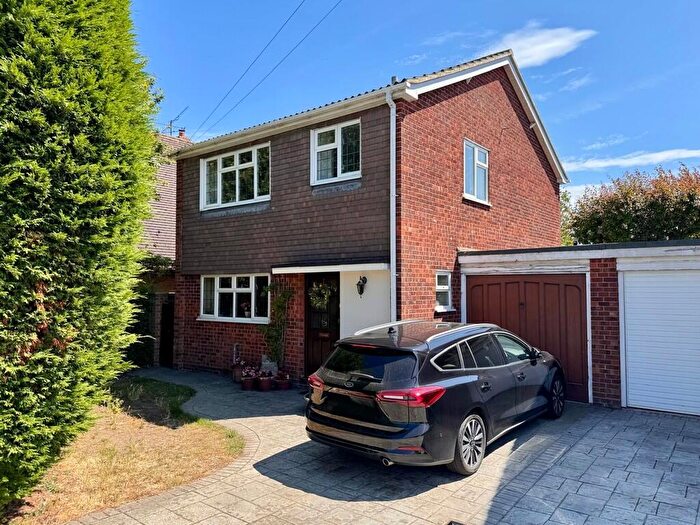
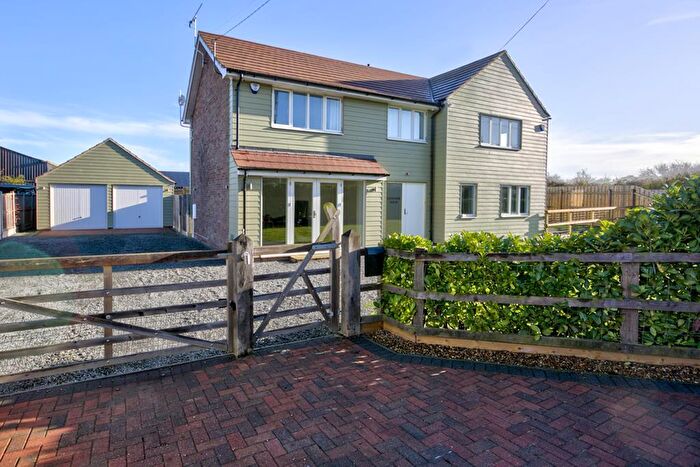
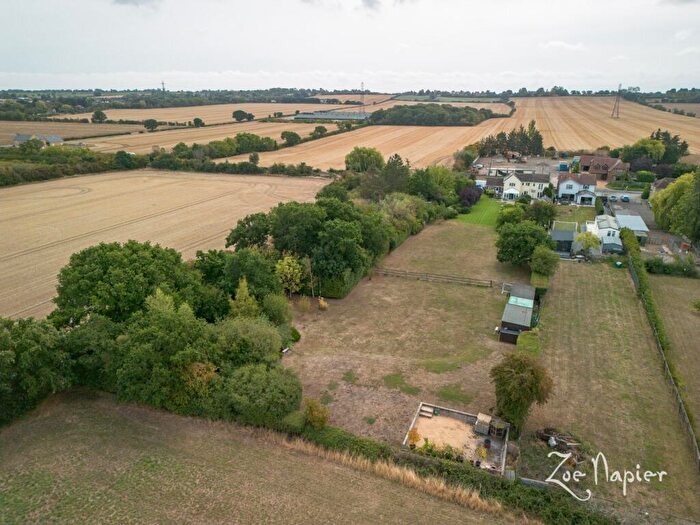
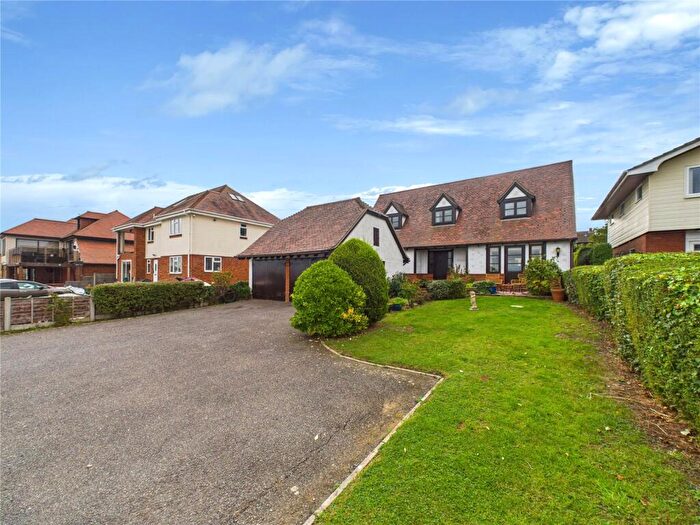
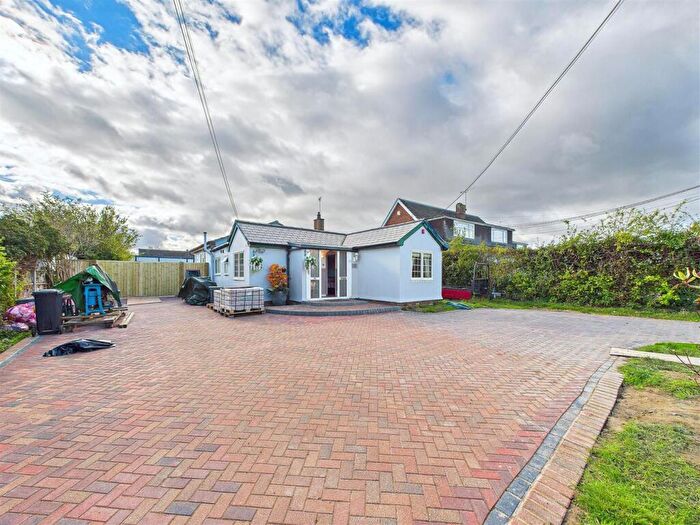
Houses for sale & to rent in Althorne, Chelmsford
House Prices in Althorne
Properties in Althorne have an average house price of £442,739.00 and had 191 Property Transactions within the last 3 years¹.
Althorne is an area in Chelmsford, Essex with 1,575 households², where the most expensive property was sold for £1,335,000.00.
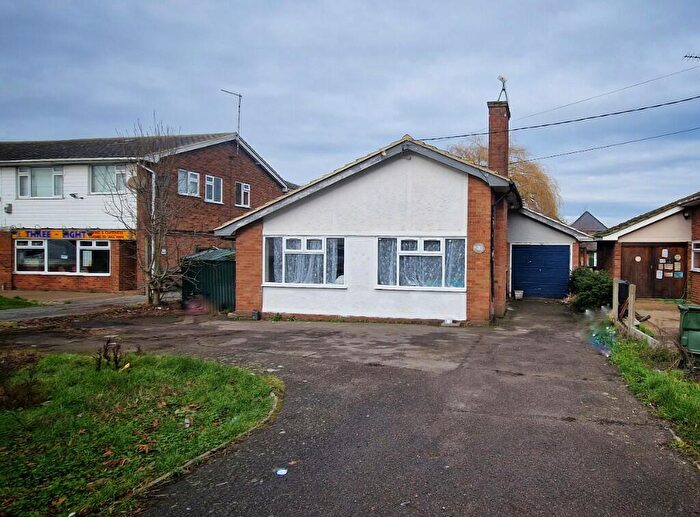
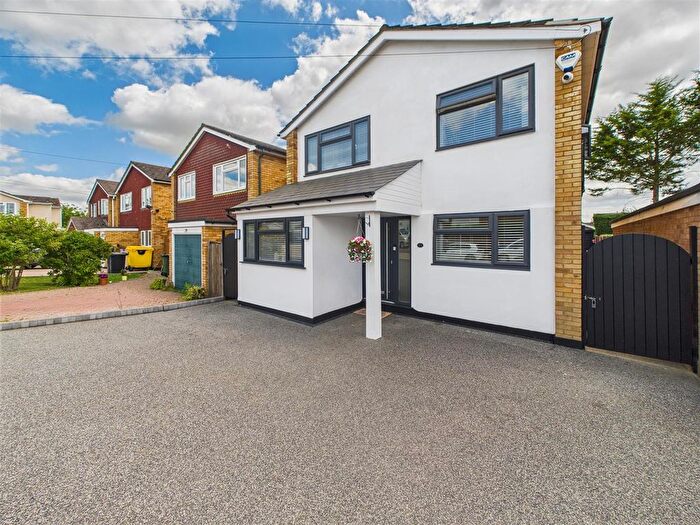
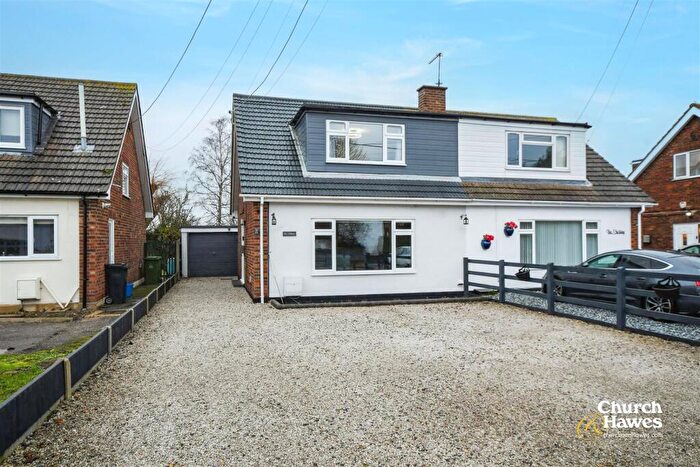
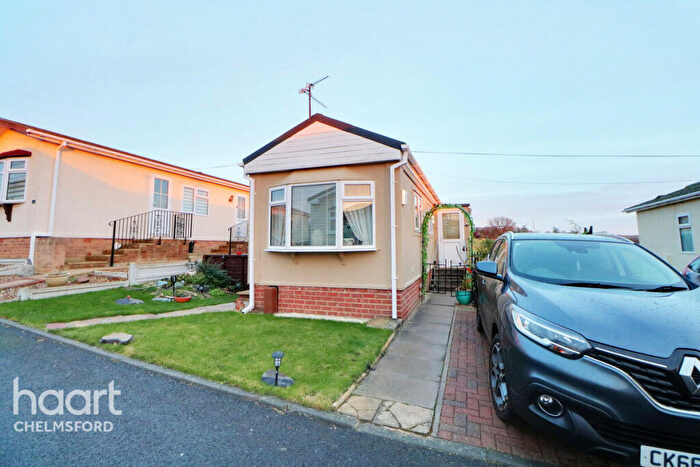
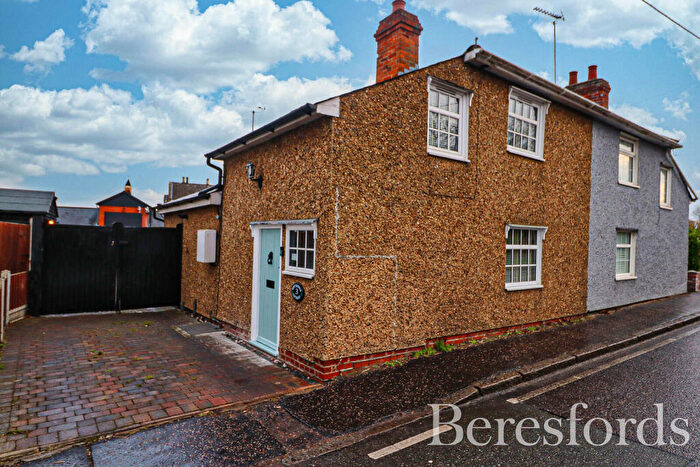
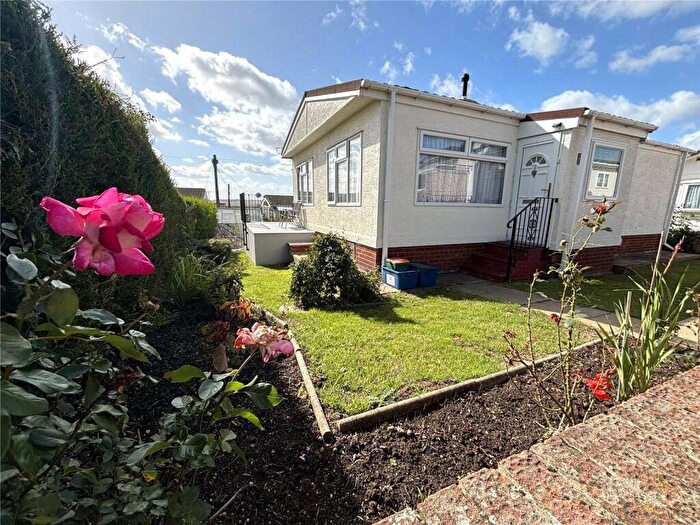
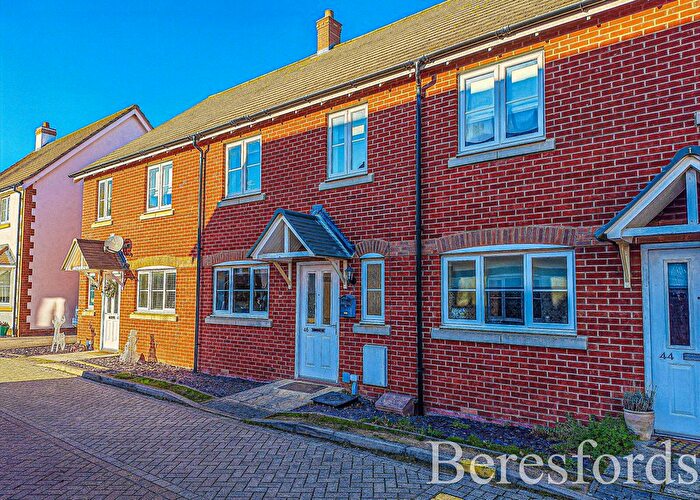
Properties for sale in Althorne
Roads and Postcodes in Althorne
Navigate through our locations to find the location of your next house in Althorne, Chelmsford for sale or to rent.
| Streets | Postcodes |
|---|---|
| Austral Way | CM3 6UP |
| Bakersfield | CM3 6GT |
| Beech Drive | CM3 6XT |
| Birch Row | CM3 6GQ |
| Bridgemans Green | CM3 6LJ |
| Bridgemarsh Lane | CM3 6DH CM3 6DQ |
| Buchanan Way | CM3 6HL CM3 6HH |
| Burnham Road | CM3 6BT CM3 6BU CM3 6BX CM3 6DL CM3 6DP CM3 6DS CM3 6DT CM3 6EU CM3 6EX CM3 6EY CM3 6EZ CM3 6HA CM3 6BL CM3 6DR CM3 6JH |
| Butterfield Chase | CM3 6LE |
| Central Avenue | CM3 6DE |
| Chestnut Farm Drive | CM3 6DA |
| Cold Norton Road | CM3 6LQ |
| Crouch Vale Court | CM3 6FN |
| Dairy Farm Road | CM3 6ED |
| East Avenue | CM3 6DD |
| Elder Road | CM3 6XD |
| Elm Way | CM3 6GP |
| Esplanade | CM3 6AL CM3 6AW |
| Fambridge Road | CM3 6BZ CM3 6DB |
| Garden Close | CM3 6BP |
| George Cardnell Way | CM3 6AT |
| Granary Close | CM3 6HJ |
| Green Lane | CM3 6BH CM3 6BJ CM3 6BQ |
| Heritage Way | CM3 6LL |
| Highfield Rise | CM3 6DN |
| Imperial Avenue | CM3 6AH CM3 6AJ CM3 6AQ CM3 6TT |
| Katonia Avenue | CM3 6AD |
| Kirk Mews | CM3 6GL |
| Lawling Cottages | CM3 6JZ |
| Lawlinge Road | CM3 6JY |
| Lower Burnham Road | CM3 6HE CM3 6HG CM3 6HF |
| Ludgrove | CM3 6JU |
| Maldon Road | CM3 6LG |
| Marine Parade | CM3 6AP |
| Mayland Quay | CM3 6GJ |
| Meadow Way | CM3 6LH |
| North Drive | CM3 6AG |
| Oakwood Court | CM3 6DW |
| Promenade | CM3 6AR |
| Ramsey Chase | CM3 6JT |
| Rectory Lane | CM3 6HB CM3 6HD |
| River View Terrace | CM3 6UT |
| Snoreham Gardens | CM3 6UN |
| Southminster Road | CM3 6YH CM3 6EN |
| Springwood Close | CM3 6YJ |
| St Michaels Close | CM3 6UW |
| Station Road | CM3 6DG |
| Steeple Road | CM3 6JX CM3 6LB CM3 6LD CM3 6LA |
| Summerdale | CM3 6BS |
| Summerhill | CM3 6BY |
| Sunningdale Road | CM3 6HW |
| The Courtyard | CM3 6GF |
| The Drive | CM3 6AB |
| The Endway | CM3 6DU |
| The Street | CM3 6JP CM3 6JR CM3 6JS |
| West Avenue | CM3 6AE CM3 6AF CM3 6DF |
| Willow Close | CM3 6XS |
| Woodlands | CM3 6DJ |
| CM3 6GS CM3 6XR CM3 6XU CM3 6YF CM3 6YZ |
Transport near Althorne
- FAQ
- Price Paid By Year
- Property Type Price
Frequently asked questions about Althorne
What is the average price for a property for sale in Althorne?
The average price for a property for sale in Althorne is £442,739. This amount is 3% higher than the average price in Chelmsford. There are 464 property listings for sale in Althorne.
What streets have the most expensive properties for sale in Althorne?
The streets with the most expensive properties for sale in Althorne are Lower Burnham Road at an average of £1,335,000, Esplanade at an average of £713,571 and The Endway at an average of £681,250.
What streets have the most affordable properties for sale in Althorne?
The streets with the most affordable properties for sale in Althorne are Snoreham Gardens at an average of £246,400, Buchanan Way at an average of £267,666 and Kirk Mews at an average of £279,582.
Which train stations are available in or near Althorne?
Some of the train stations available in or near Althorne are Althorne, North Fambridge and Burnham-On-Crouch.
Property Price Paid in Althorne by Year
The average sold property price by year was:
| Year | Average Sold Price | Price Change |
Sold Properties
|
|---|---|---|---|
| 2025 | £448,697 | 10% |
38 Properties |
| 2024 | £404,962 | -10% |
53 Properties |
| 2023 | £445,877 | -6% |
43 Properties |
| 2022 | £471,526 | 9% |
57 Properties |
| 2021 | £430,719 | 1% |
72 Properties |
| 2020 | £424,503 | 12% |
62 Properties |
| 2019 | £372,427 | 1% |
91 Properties |
| 2018 | £367,312 | -12% |
68 Properties |
| 2017 | £410,292 | 9% |
46 Properties |
| 2016 | £373,111 | 24% |
79 Properties |
| 2015 | £283,000 | 1% |
78 Properties |
| 2014 | £280,145 | 10% |
72 Properties |
| 2013 | £251,339 | 12% |
42 Properties |
| 2012 | £222,121 | -21% |
39 Properties |
| 2011 | £269,682 | 11% |
52 Properties |
| 2010 | £240,737 | -7% |
46 Properties |
| 2009 | £258,099 | 10% |
51 Properties |
| 2008 | £232,813 | -23% |
39 Properties |
| 2007 | £286,328 | 13% |
85 Properties |
| 2006 | £248,310 | 10% |
83 Properties |
| 2005 | £222,338 | 4% |
93 Properties |
| 2004 | £214,308 | -5% |
68 Properties |
| 2003 | £224,336 | 29% |
66 Properties |
| 2002 | £159,110 | 8% |
81 Properties |
| 2001 | £145,608 | 3% |
83 Properties |
| 2000 | £140,793 | 25% |
62 Properties |
| 1999 | £105,826 | 8% |
93 Properties |
| 1998 | £97,043 | 2% |
75 Properties |
| 1997 | £94,849 | 21% |
102 Properties |
| 1996 | £74,853 | -3% |
86 Properties |
| 1995 | £76,881 | - |
59 Properties |
Property Price per Property Type in Althorne
Here you can find historic sold price data in order to help with your property search.
The average Property Paid Price for specific property types in the last three years are:
| Property Type | Average Sold Price | Sold Properties |
|---|---|---|
| Semi Detached House | £371,525.00 | 58 Semi Detached Houses |
| Detached House | £525,890.00 | 107 Detached Houses |
| Terraced House | £276,636.00 | 22 Terraced Houses |
| Flat | £164,625.00 | 4 Flats |

