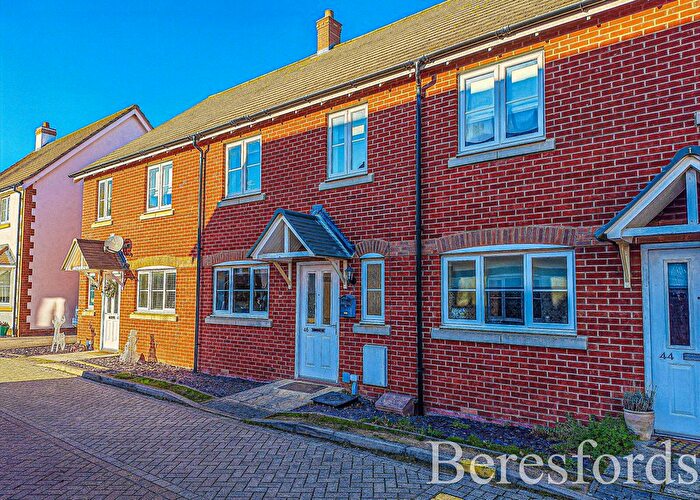
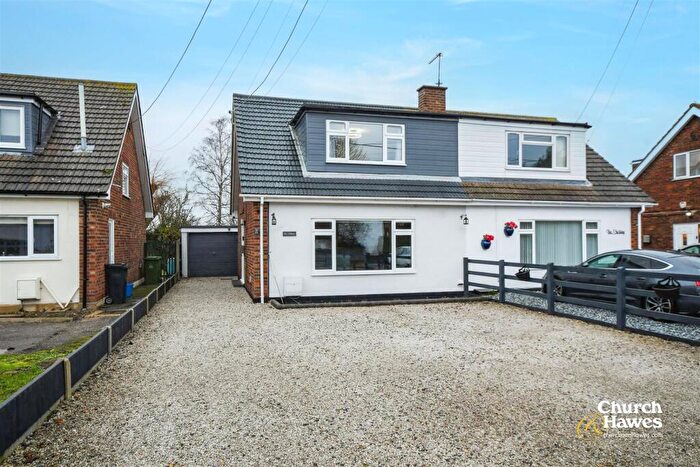
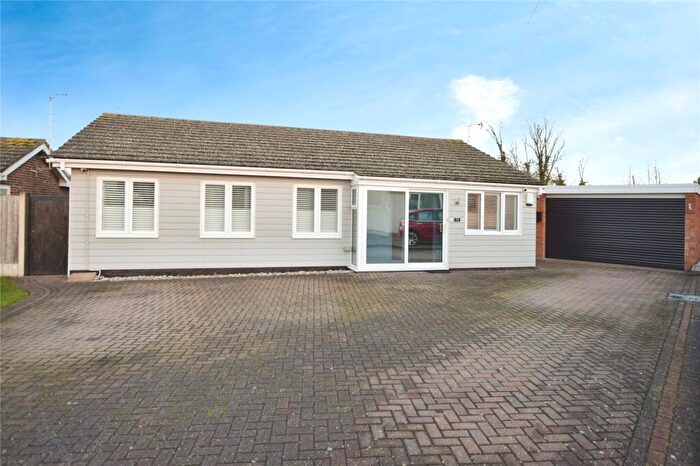
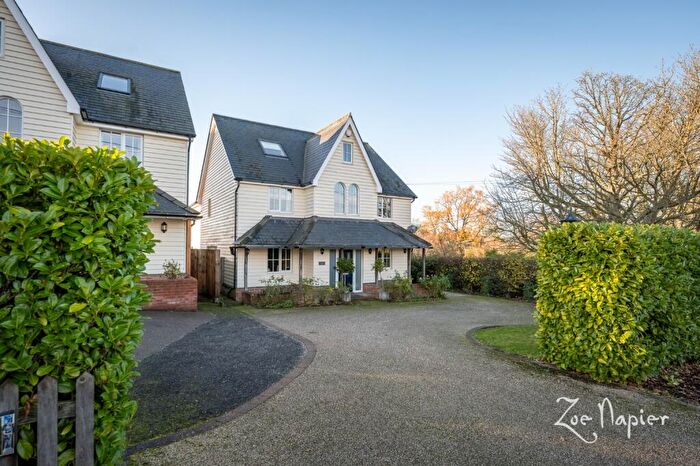
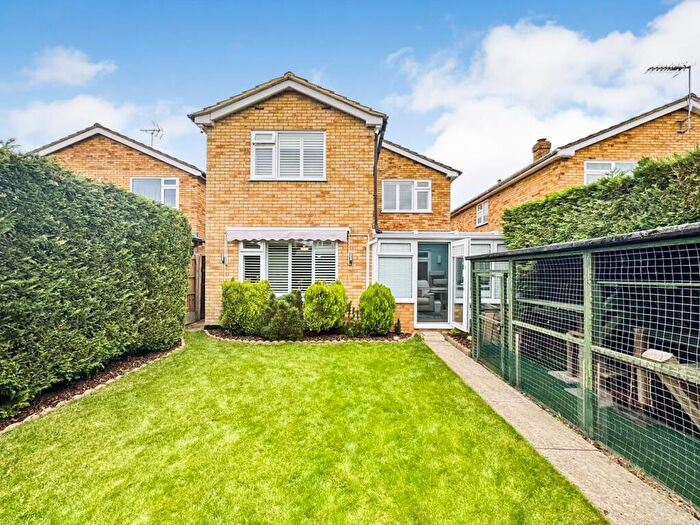
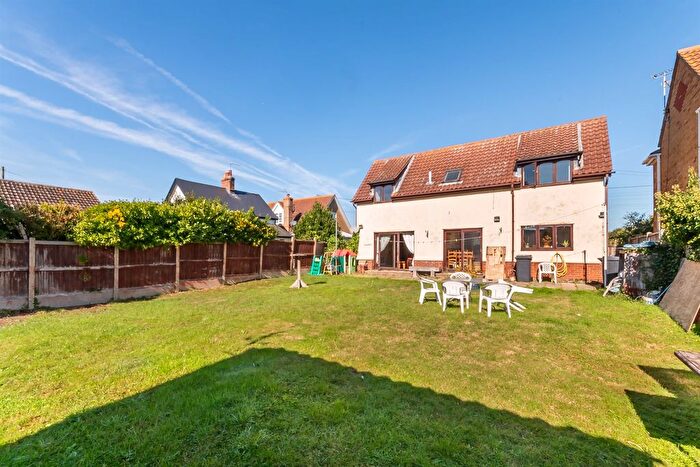
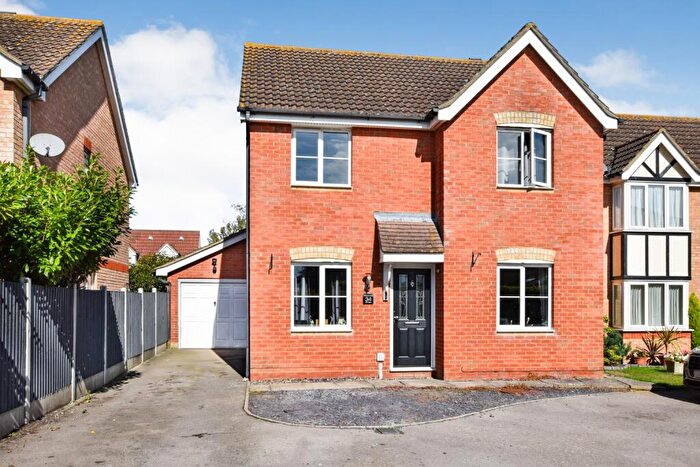
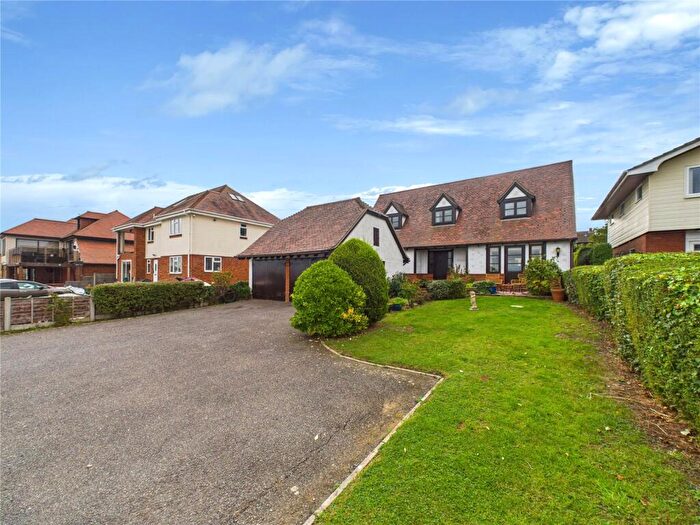
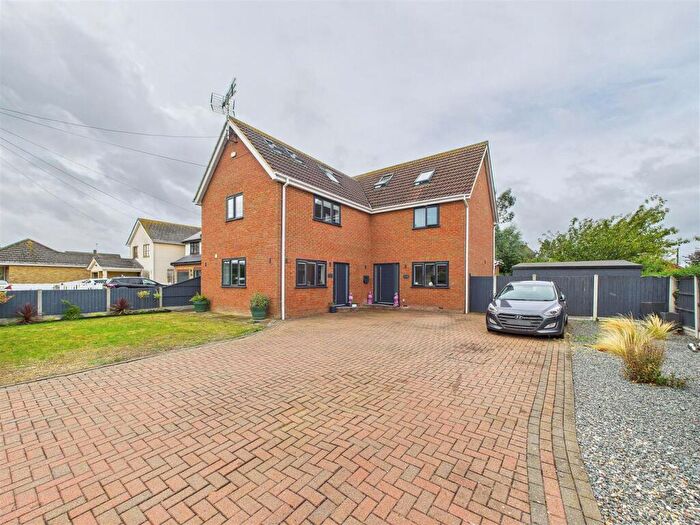
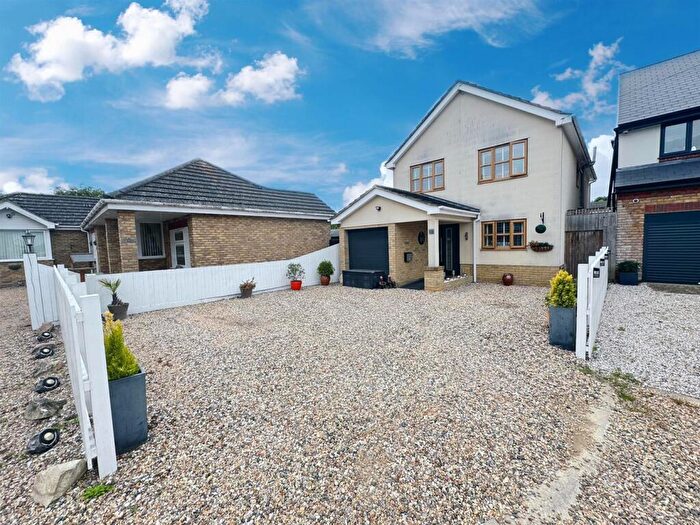
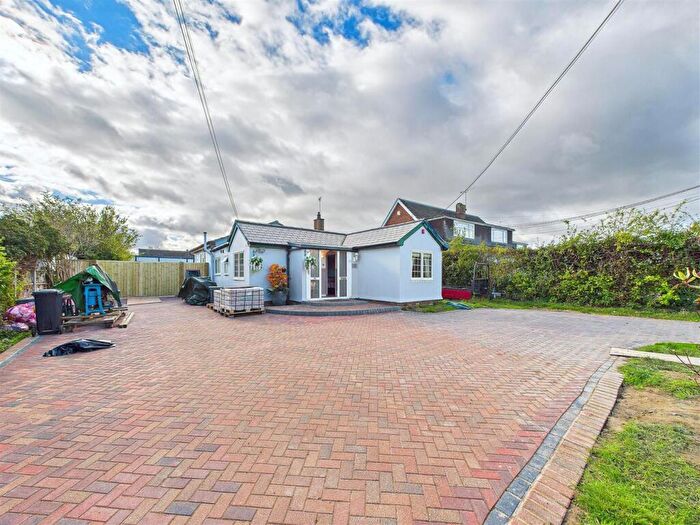
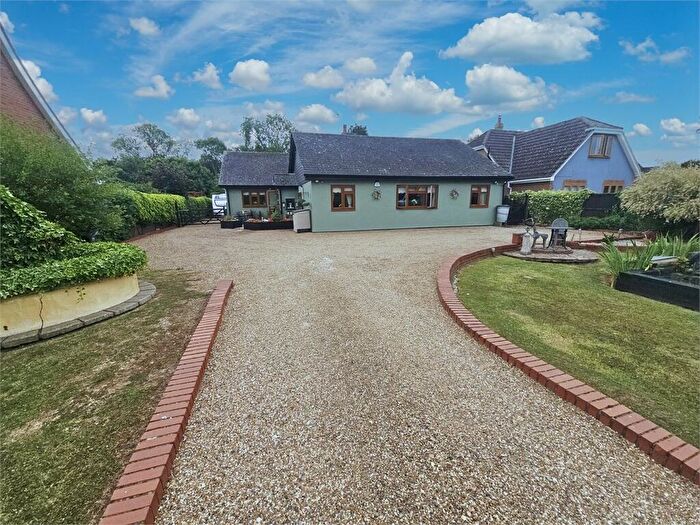
Houses for sale & to rent in Mayland, Chelmsford
House Prices in Mayland
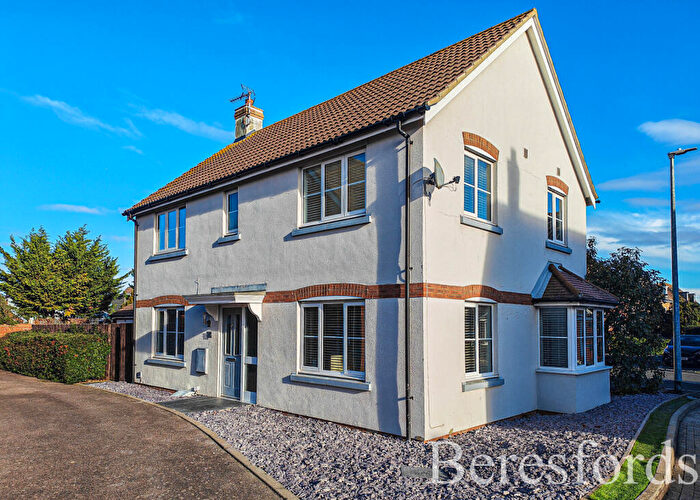
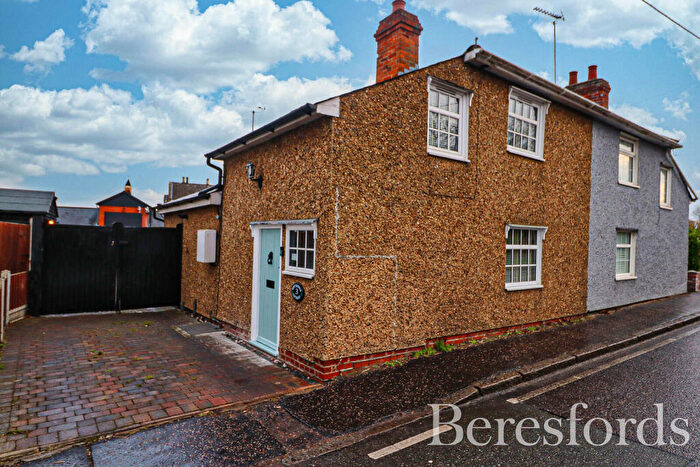
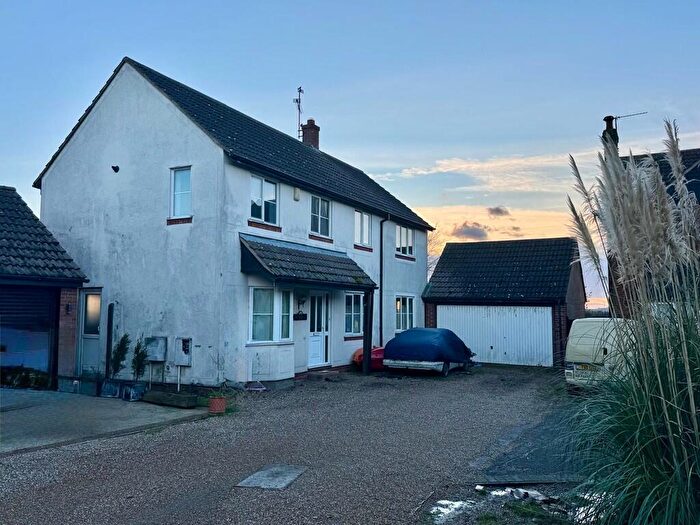
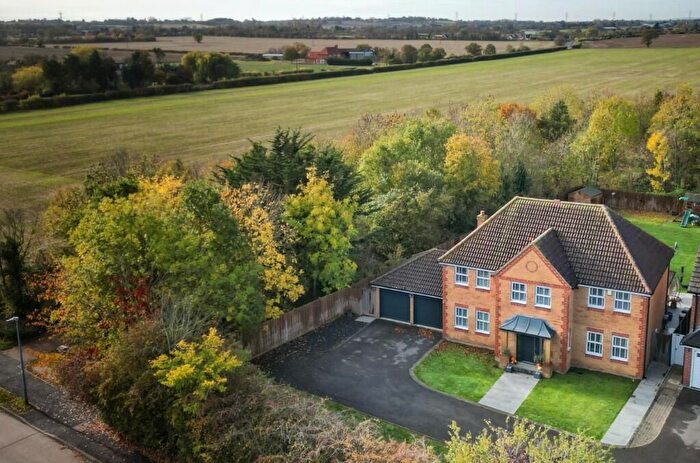
Properties in Mayland have an average house price of £428,247.00 and had 116 Property Transactions within the last 3 years¹.
Mayland is an area in Chelmsford, Essex with 951 households², where the most expensive property was sold for £1,200,000.00.
Properties for sale in Mayland
Roads and Postcodes in Mayland
Navigate through our locations to find the location of your next house in Mayland, Chelmsford for sale or to rent.
| Streets | Postcodes |
|---|---|
| Balmoral Road | CM3 6TE |
| Bartlett Close | CM3 6TA |
| Blenheim Gardens | CM3 6TH |
| Bramley Way | CM3 6ER CM3 6ES CM3 6ET |
| Curlew Avenue | CM3 6TX |
| Derby Close | CM3 6TB |
| Drake Avenue | CM3 6TY |
| Fels Way | CM3 6AN |
| Foxfield Chase | CM3 6GB |
| Grange Avenue | CM3 6BG |
| Grebe Close | CM3 6TZ |
| Heron Way | CM3 6TP |
| Highlands Farm Cottages | CM3 6EF |
| Hillcrest | CM3 6AZ |
| Industrial Estate | CM3 6AX |
| Mallards | CM3 6TN |
| Mayland Close | CM3 6SS |
| Mayland Green | CM3 6BD CM3 6BN |
| Mayland Hill | CM3 6EA |
| Mayland Hill Cottages | CM3 6DZ |
| Mill Road | CM3 6EQ |
| Nipsells Chase | CM3 6EH CM3 6EJ |
| Orchard Drive | CM3 6EP |
| Princes Avenue | CM3 6BA |
| Sea View Parade | CM3 6EL |
| Smiths Avenue | CM3 6AS |
| Southminster Road | CM3 6EB CM3 6EE |
| St Johns Court | CM3 6GH |
| Steeple Road | CM3 6BB CM3 6BE CM3 6EG |
| Teal Avenue | CM3 6SX CM3 6TU |
| Tern Close | CM3 6TW |
| The Drive | CM3 6AA |
| The Endway | CM3 6DY |
| Thrumble Close | CM3 6FG |
| Tudor Place | CM3 6TJ |
| Wembley Avenue | CM3 6AY |
| Woodland Park Chase | CM3 6FJ |
| Worcester Close | CM3 6TD |
Transport near Mayland
- FAQ
- Price Paid By Year
- Property Type Price
Frequently asked questions about Mayland
What is the average price for a property for sale in Mayland?
The average price for a property for sale in Mayland is £428,247. This amount is 0.03% higher than the average price in Chelmsford. There are 708 property listings for sale in Mayland.
What streets have the most expensive properties for sale in Mayland?
The streets with the most expensive properties for sale in Mayland are Mayland Close at an average of £751,875, Southminster Road at an average of £710,000 and Steeple Road at an average of £691,625.
What streets have the most affordable properties for sale in Mayland?
The streets with the most affordable properties for sale in Mayland are Mallards at an average of £149,000, Teal Avenue at an average of £250,000 and Hillcrest at an average of £344,750.
Which train stations are available in or near Mayland?
Some of the train stations available in or near Mayland are Althorne, Southminster and Burnham-On-Crouch.
Property Price Paid in Mayland by Year
The average sold property price by year was:
| Year | Average Sold Price | Price Change |
Sold Properties
|
|---|---|---|---|
| 2025 | £462,229 | -1% |
24 Properties |
| 2024 | £466,129 | 19% |
31 Properties |
| 2023 | £379,659 | -7% |
22 Properties |
| 2022 | £404,634 | -2% |
39 Properties |
| 2021 | £413,935 | 17% |
49 Properties |
| 2020 | £344,011 | 1% |
43 Properties |
| 2019 | £340,857 | 13% |
28 Properties |
| 2018 | £296,000 | -3% |
26 Properties |
| 2017 | £303,987 | -0,2% |
47 Properties |
| 2016 | £304,503 | 13% |
52 Properties |
| 2015 | £264,283 | 4% |
53 Properties |
| 2014 | £252,853 | 4% |
55 Properties |
| 2013 | £241,558 | 1% |
36 Properties |
| 2012 | £239,178 | 5% |
41 Properties |
| 2011 | £226,344 | 4% |
36 Properties |
| 2010 | £216,542 | -4% |
35 Properties |
| 2009 | £225,100 | -6% |
35 Properties |
| 2008 | £238,595 | 4% |
26 Properties |
| 2007 | £229,205 | 9% |
70 Properties |
| 2006 | £207,912 | 9% |
81 Properties |
| 2005 | £189,116 | -16% |
63 Properties |
| 2004 | £219,349 | 11% |
59 Properties |
| 2003 | £195,479 | 27% |
71 Properties |
| 2002 | £142,874 | 17% |
67 Properties |
| 2001 | £119,177 | -2% |
72 Properties |
| 2000 | £122,064 | 24% |
76 Properties |
| 1999 | £93,233 | 10% |
113 Properties |
| 1998 | £83,537 | 8% |
54 Properties |
| 1997 | £76,959 | -3% |
62 Properties |
| 1996 | £79,212 | 17% |
52 Properties |
| 1995 | £65,696 | - |
40 Properties |
Property Price per Property Type in Mayland
Here you can find historic sold price data in order to help with your property search.
The average Property Paid Price for specific property types in the last three years are:
| Property Type | Average Sold Price | Sold Properties |
|---|---|---|
| Semi Detached House | £358,150.00 | 30 Semi Detached Houses |
| Detached House | £491,792.00 | 76 Detached Houses |
| Terraced House | £200,000.00 | 1 Terraced House |
| Flat | £150,666.00 | 9 Flats |

