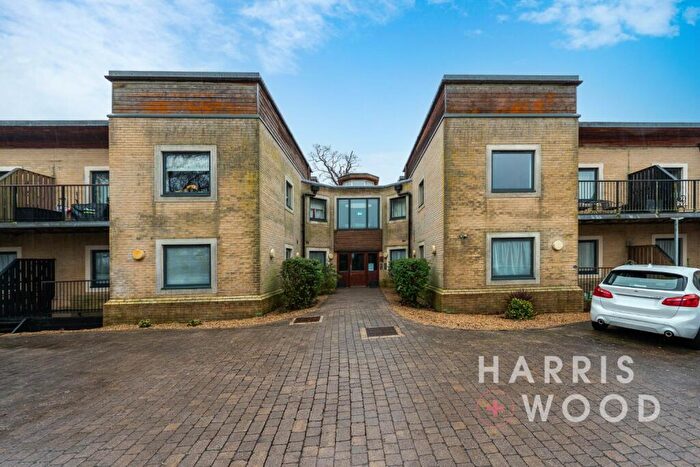
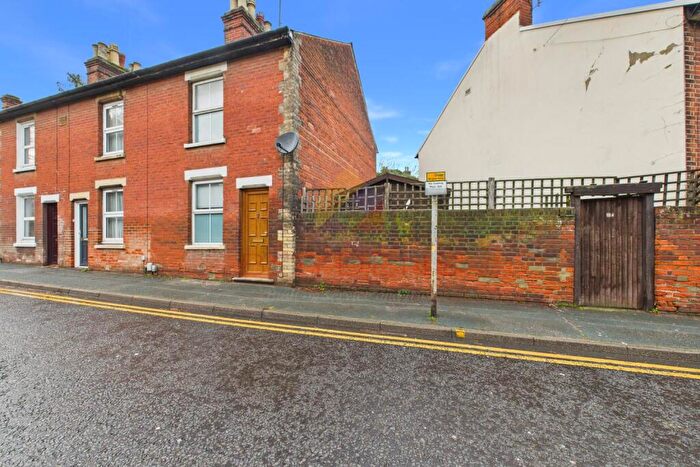
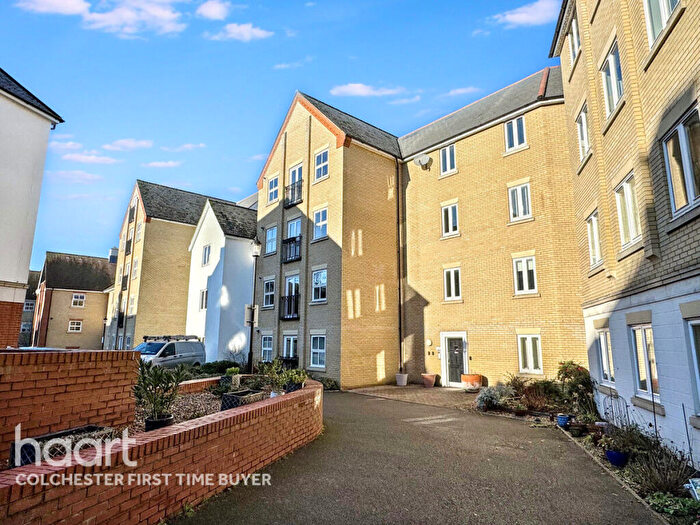
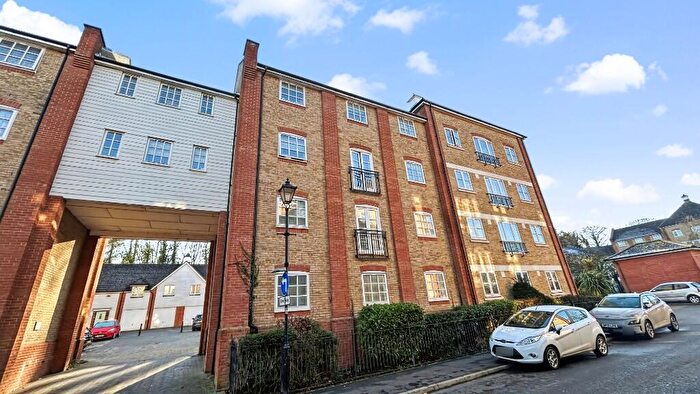
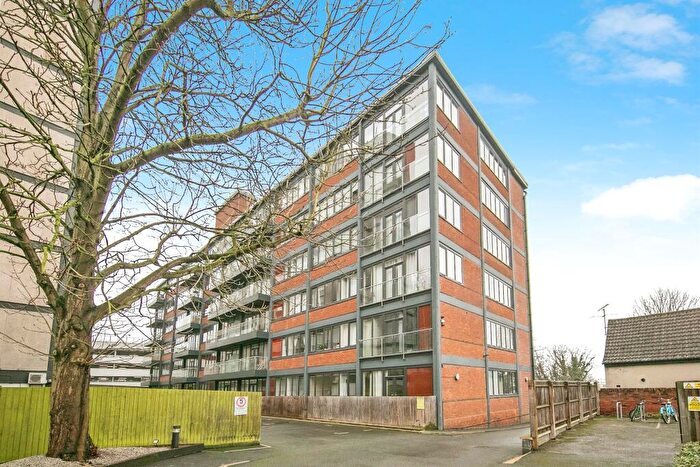
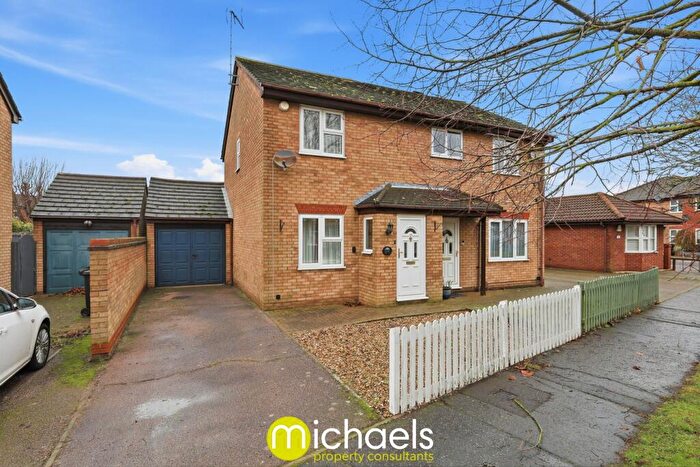
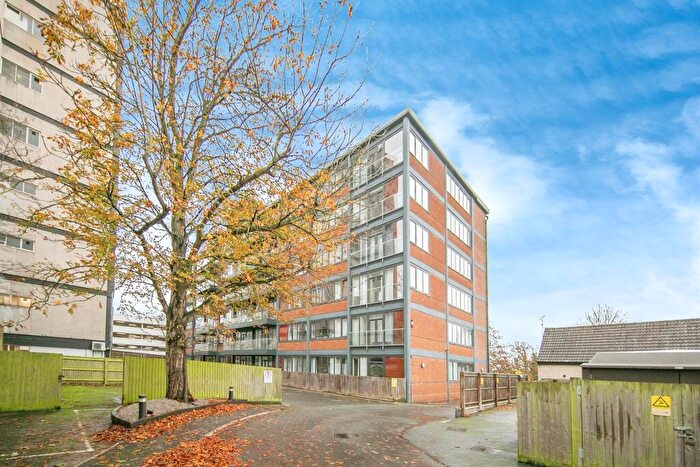
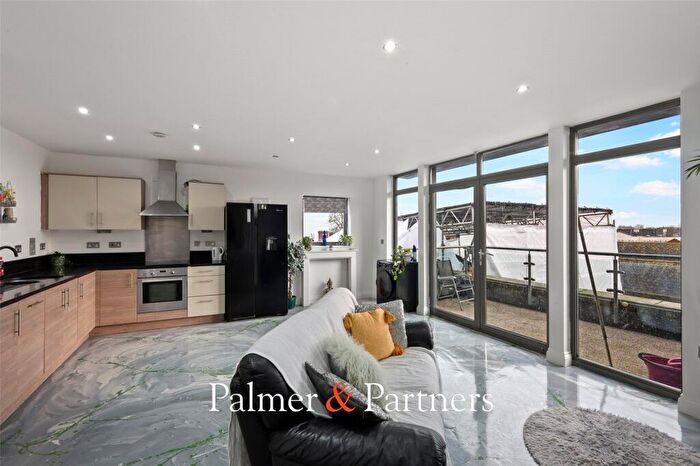
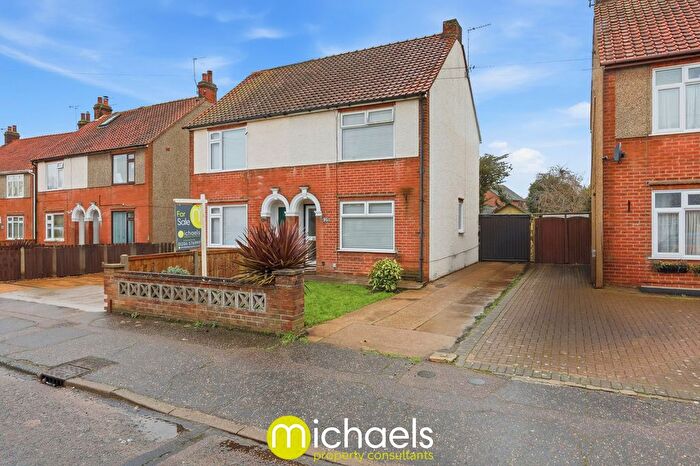
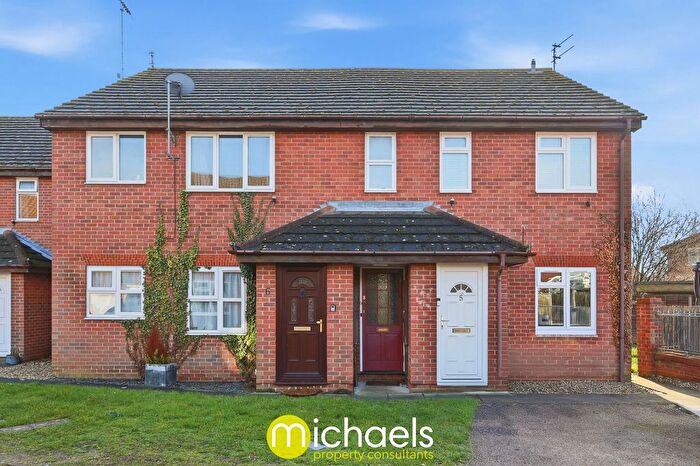
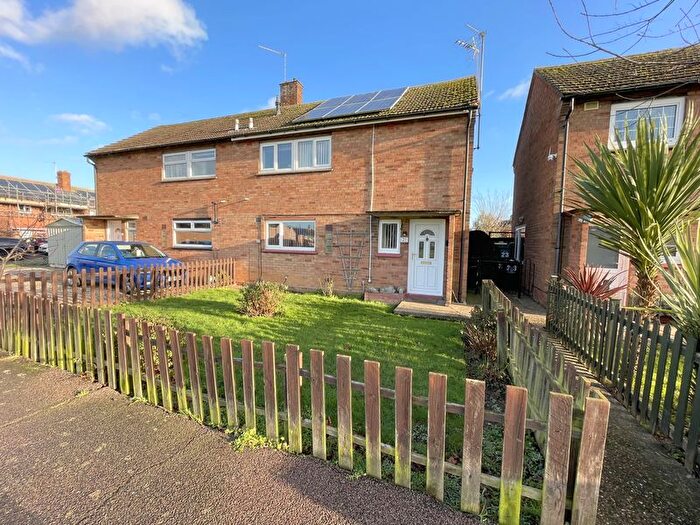
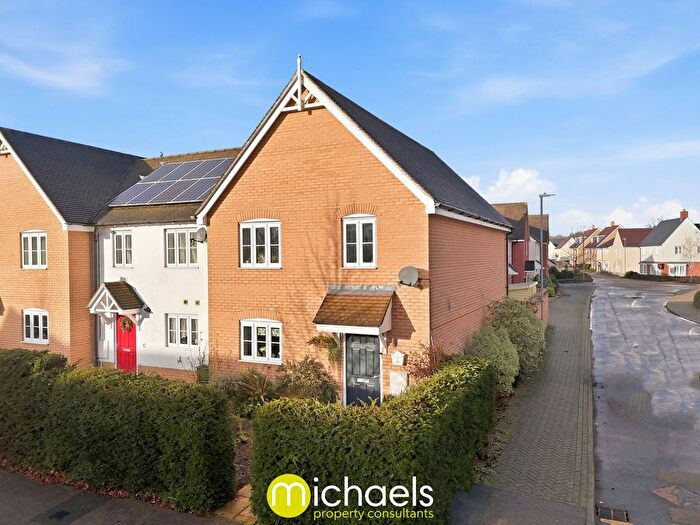
Houses for sale & to rent in Berechurch, Colchester
House Prices in Berechurch
Properties in Berechurch have an average house price of £275,160.00 and had 546 Property Transactions within the last 3 years¹.
Berechurch is an area in Colchester, Essex with 3,622 households², where the most expensive property was sold for £655,000.00.
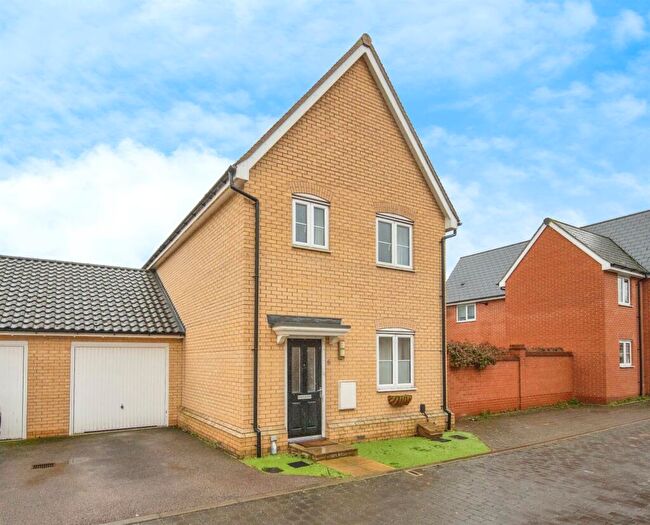
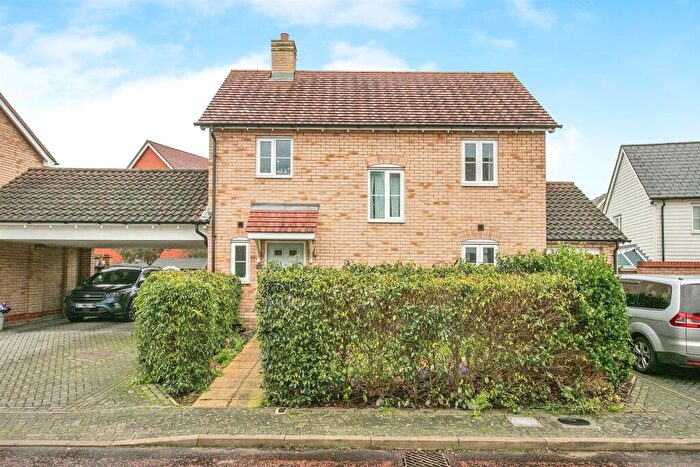
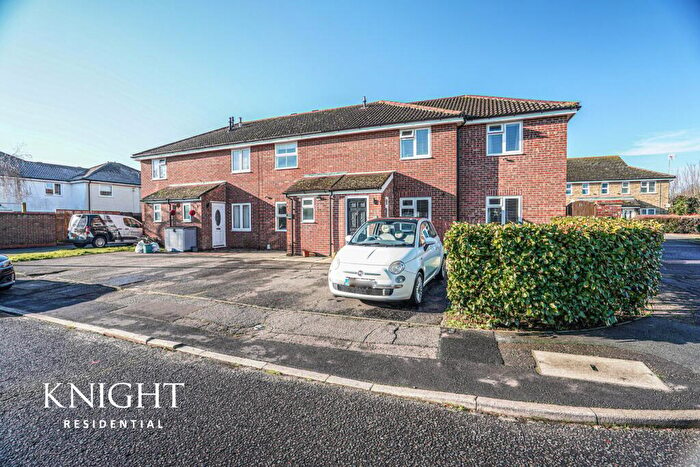
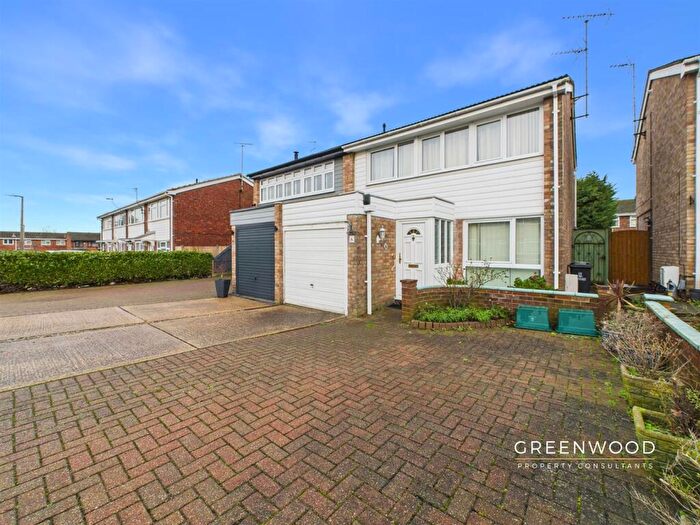
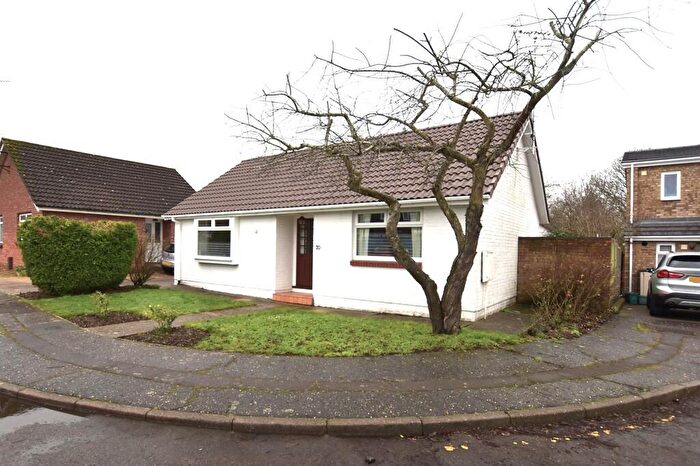
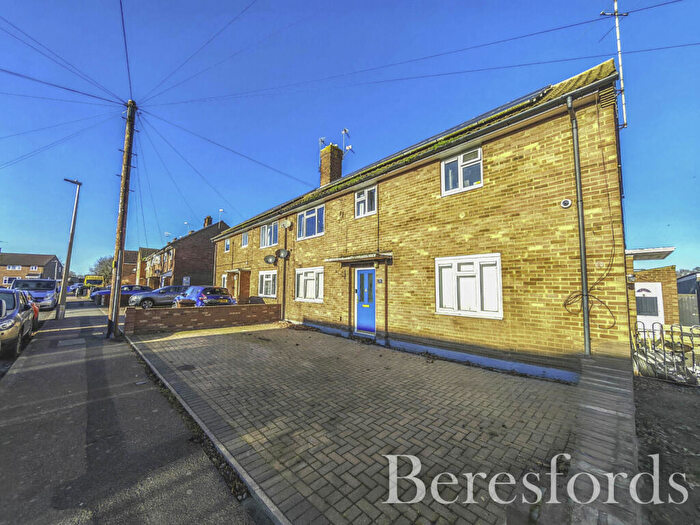
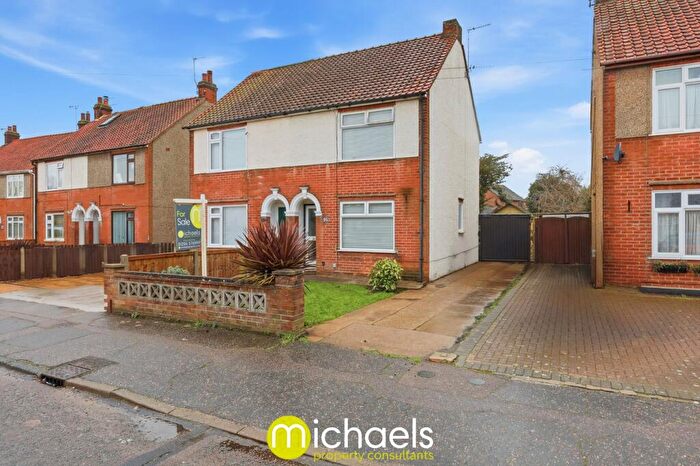
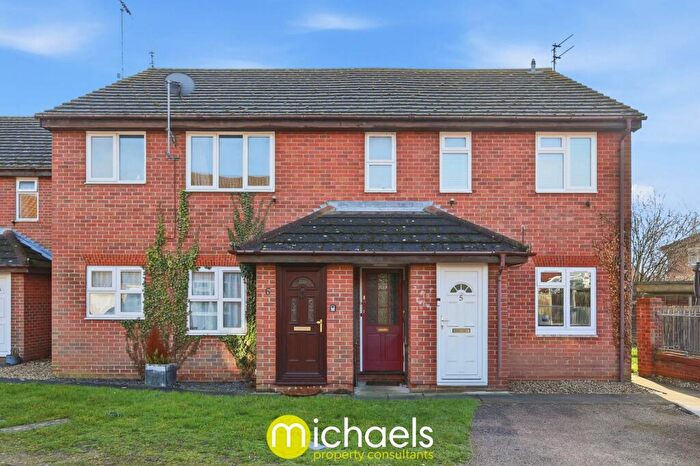
Properties for sale in Berechurch
Roads and Postcodes in Berechurch
Navigate through our locations to find the location of your next house in Berechurch, Colchester for sale or to rent.
| Streets | Postcodes |
|---|---|
| Adelaide Drive | CO2 8UB CO2 8UT CO2 8UX |
| Aggregate Walk | CO2 9FB |
| Agnes Silverside Close | CO2 8WN |
| Armidale Walk | CO2 8XS |
| Ash Grove | CO2 0AH |
| Bardfield Road | CO2 8LW CO2 8LL |
| Beeleigh Close | CO2 8LZ |
| Berechurch Hall Road | CO2 8RD CO2 8RE CO2 8RF CO2 9NN CO2 9NW CO2 0DB CO2 9NU |
| Berechurch Road | CO2 7PZ CO2 7QB CO2 7QD CO2 7QE CO2 7QF CO2 7QQ CO2 7QA CO2 7QU CO2 9RQ |
| Berefield Way | CO2 8PQ |
| Bevan Close | CO2 8YT |
| Blackheath | CO2 0AA CO2 0AB CO2 0AD CO2 0AE CO2 0AJ |
| Blenheim Drive | CO2 0AR |
| Bourne Court | CO2 7RJ |
| Brisbane Way | CO2 8UG CO2 8XH |
| Britannia Mews | CO2 7TJ |
| Buckley Place | CO2 8PL |
| Builder Gardens | CO2 9FT |
| Buxton Road | CO2 8QU |
| Cairns Road | CO2 8UZ |
| Chancery Grove | CO2 0BQ |
| Chariot Drive | CO2 7QJ |
| Chestnut Avenue | CO2 0AL |
| Cinder Street | CO2 9GQ |
| Circus Square | CO2 7TG |
| Coronation Avenue | CO2 8PB CO2 8PD |
| Crosstree Walk | CO2 8QF |
| Daniel Cole Road | CO2 7PA |
| Darwin Close | CO2 8US |
| Dudley Close | CO2 7SH |
| Felstead Close | CO2 0BA |
| Finchingfield Way | CO2 0AT CO2 0AU CO2 0AY CO2 0AZ |
| Firlie Walk | CO2 8QN |
| Foundation Way | CO2 9FY |
| Fowler Road | CO2 9FF |
| Fremantle Road | CO2 8UL |
| Friday Wood Green | CO2 8XE CO2 8XF CO2 8XG |
| Gosfield Road | CO2 0AS |
| Gryps Close | CO2 9NJ |
| Gurdon Road | CO2 7PB CO2 7PP CO2 7PY |
| Harrison Road | CO2 7PR |
| Helen Ewing Place | CO2 8WS |
| Henry Everett Grove | CO2 9FX |
| Hetherington Close | CO2 0AN |
| Hillston Close | CO2 8XP |
| Hobart Gardens | CO2 8YN |
| Holm Oak | CO2 8QA |
| Holt Drive | CO2 0BG |
| Hooper Avenue | CO2 9FE |
| Inworth Walk | CO2 8LP |
| James Gore Drive | CO2 8WZ |
| James Parnell Drive | CO2 8WR |
| John Castle Way | CO2 7TU |
| John Hammond Close | CO2 8WT |
| John Lawrence Walk | CO2 8WP |
| John Mace Road | CO2 8WW CO2 8WX |
| King George Road | CO2 7PE CO2 7PG CO2 7PQ CO2 7PF |
| Launceston Close | CO2 8UR |
| Lethe Grove | CO2 8RG CO2 8RH CO2 8RQ |
| Lord Holland Road | CO2 7PS |
| Lungley Rise | CO2 9FJ |
| Mackay Court | CO2 8UU |
| Madeley Close | CO2 9FL |
| Maple Way | CO2 7PD |
| Mario Way | CO2 7QN |
| Maryborough Grove | CO2 8XJ |
| Mayberry Walk | CO2 8PS |
| Melbourne Chase | CO2 8UE |
| Memnon Court | CO2 7QW |
| Mersea Road | CO2 7QT CO2 7QZ CO2 7RH CO2 8PN CO2 8PP CO2 8PT CO2 8PW CO2 8QG CO2 8QX CO2 8QY CO2 8RA CO2 8RB CO2 8PU CO2 8QZ |
| Meyrick Crescent | CO2 7QP CO2 7QX CO2 7QY |
| Middlewick Close | CO2 8PH |
| Midland Close | CO2 7RS |
| Monkwick Avenue | CO2 8LN CO2 8LR CO2 8NA CO2 8NB CO2 8ND CO2 8NE CO2 8NF CO2 8NJ CO2 8NL CO2 8NR |
| Moy Road | CO2 8NZ |
| Nancy Smith Close | CO2 7QL |
| Nightingale Court | CO2 8FJ |
| Onslow Crescent | CO2 8UN CO2 8UW |
| Parnell Close | CO2 8PF |
| Pebmarsh Close | CO2 0BE |
| Perth Close | CO2 8UH |
| Pier Close | CO2 9FW |
| Pownall Crescent | CO2 7RD CO2 7RE CO2 7RF CO2 7RG |
| Prince Charles Road | CO2 8NS |
| Prince Philip Road | CO2 8NT CO2 8NU CO2 8NX CO2 8PA |
| Queen Elizabeth Way | CO2 8LT CO2 8LU CO2 8LX CO2 8PE CO2 8QH CO2 8QL CO2 8QP CO2 8QR CO2 8QS CO2 8QW |
| Queen Mary Avenue | CO2 7PH CO2 7PJ CO2 7PL CO2 7PN CO2 7PW |
| Queensland Drive | CO2 8UA CO2 8UD CO2 8UF CO2 8UQ |
| Richard Day Walk | CO2 8XQ |
| Richard Nichols Close | CO2 8YW |
| Ridgewell Way | CO2 8NG |
| Rockhampton Walk | CO2 8UJ |
| Rose Allen Avenue | CO2 8WL |
| Rose Court | CO2 0AW |
| Sage Road | CO2 8NP |
| Sandringham Drive | CO2 7PX |
| School Road | CO2 8NN |
| Secundus Drive | CO2 7TF |
| Sheering Walk | CO2 8NH |
| Silverthorne Close | CO2 8QB |
| Snowberry Grove | CO2 8QD |
| Spencer Road | CO2 9FG |
| Sydney Street | CO2 8UP |
| Talcott Road | CO2 8QJ |
| Tamworth Chase | CO2 8XR |
| Terling Close | CO2 8LS |
| Thaxted Walk | CO2 0AX |
| The Parade | CO2 8LY |
| The Willows | CO2 8PX CO2 8PY CO2 8PZ CO2 8QE CO2 8XU |
| Thomas Benold Walk | CO2 8WU |
| Travers Road | CO2 9FH |
| Trowel Place | CO2 9FZ |
| Valentinus Crescent | CO2 7QG |
| Wall Mews | CO2 9GP |
| West Donyland Court | CO2 0BR |
| Wethersfield Road | CO2 0BB CO2 0BD |
| William Harris Way | CO2 8WJ |
| Windsor Close | CO2 8QT |
| Wych Elm | CO2 8PR |
| Wyndham Close | CO2 8UY |
| CO2 0AP |
Transport near Berechurch
- FAQ
- Price Paid By Year
- Property Type Price
Frequently asked questions about Berechurch
What is the average price for a property for sale in Berechurch?
The average price for a property for sale in Berechurch is £275,160. This amount is 21% lower than the average price in Colchester. There are 4,074 property listings for sale in Berechurch.
What streets have the most expensive properties for sale in Berechurch?
The streets with the most expensive properties for sale in Berechurch are Blackheath at an average of £425,125, Pier Close at an average of £395,000 and West Donyland Court at an average of £387,500.
What streets have the most affordable properties for sale in Berechurch?
The streets with the most affordable properties for sale in Berechurch are Rose Court at an average of £142,333, Maple Way at an average of £145,500 and William Harris Way at an average of £167,777.
Which train stations are available in or near Berechurch?
Some of the train stations available in or near Berechurch are Colchester Town, Hythe and Wivenhoe.
Property Price Paid in Berechurch by Year
The average sold property price by year was:
| Year | Average Sold Price | Price Change |
Sold Properties
|
|---|---|---|---|
| 2025 | £288,525 | 8% |
99 Properties |
| 2024 | £264,364 | -5% |
129 Properties |
| 2023 | £276,563 | 1% |
154 Properties |
| 2022 | £274,265 | 10% |
164 Properties |
| 2021 | £246,751 | 3% |
186 Properties |
| 2020 | £238,547 | 5% |
163 Properties |
| 2019 | £226,551 | -3% |
177 Properties |
| 2018 | £234,201 | 1% |
211 Properties |
| 2017 | £230,900 | 12% |
199 Properties |
| 2016 | £203,882 | 7% |
218 Properties |
| 2015 | £189,667 | 7% |
216 Properties |
| 2014 | £177,205 | 8% |
293 Properties |
| 2013 | £163,155 | 2% |
187 Properties |
| 2012 | £160,548 | 7% |
136 Properties |
| 2011 | £150,033 | -5% |
150 Properties |
| 2010 | £157,985 | 6% |
103 Properties |
| 2009 | £148,974 | -2% |
121 Properties |
| 2008 | £151,767 | -16% |
131 Properties |
| 2007 | £175,877 | 10% |
327 Properties |
| 2006 | £158,910 | 13% |
340 Properties |
| 2005 | £138,981 | 4% |
192 Properties |
| 2004 | £133,642 | 14% |
179 Properties |
| 2003 | £115,428 | 12% |
175 Properties |
| 2002 | £101,307 | 26% |
167 Properties |
| 2001 | £75,222 | 12% |
197 Properties |
| 2000 | £66,054 | 12% |
153 Properties |
| 1999 | £58,040 | 10% |
171 Properties |
| 1998 | £52,343 | 8% |
142 Properties |
| 1997 | £48,025 | -1% |
171 Properties |
| 1996 | £48,423 | 6% |
109 Properties |
| 1995 | £45,676 | - |
91 Properties |
Property Price per Property Type in Berechurch
Here you can find historic sold price data in order to help with your property search.
The average Property Paid Price for specific property types in the last three years are:
| Property Type | Average Sold Price | Sold Properties |
|---|---|---|
| Flat | £172,299.00 | 95 Flats |
| Semi Detached House | £296,013.00 | 184 Semi Detached Houses |
| Detached House | £353,424.00 | 90 Detached Houses |
| Terraced House | £268,893.00 | 177 Terraced Houses |

