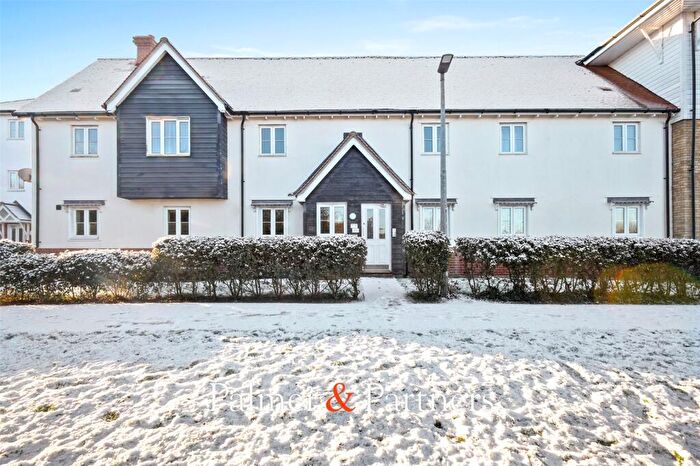
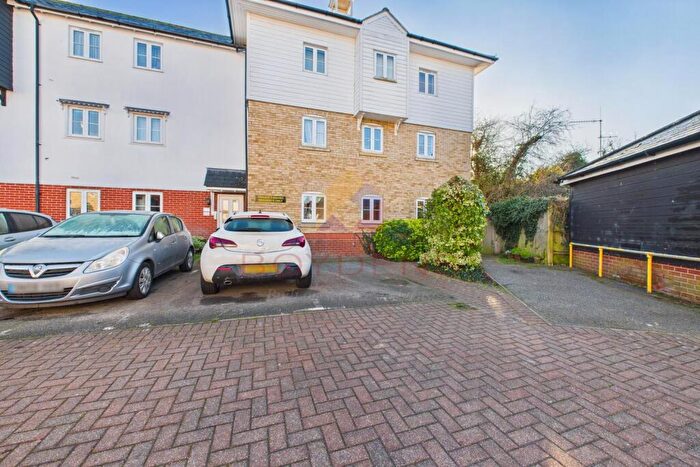
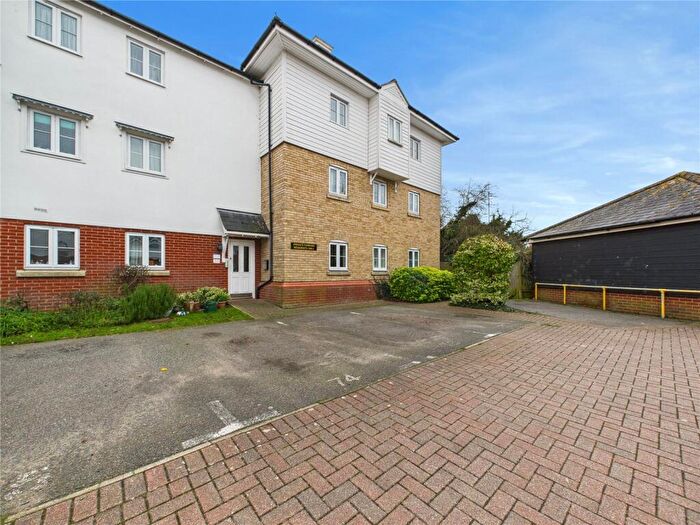
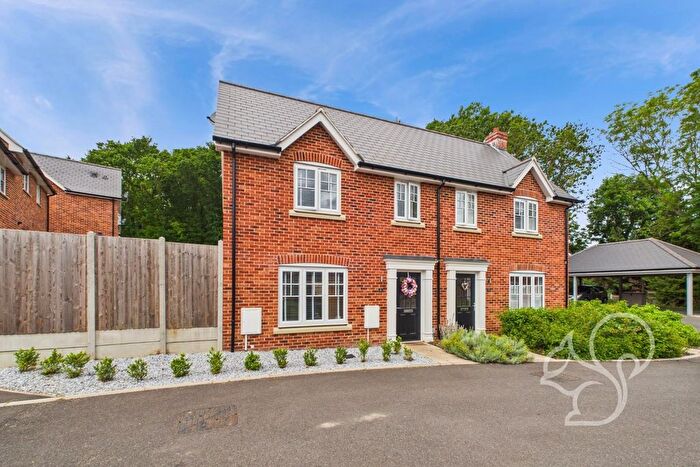
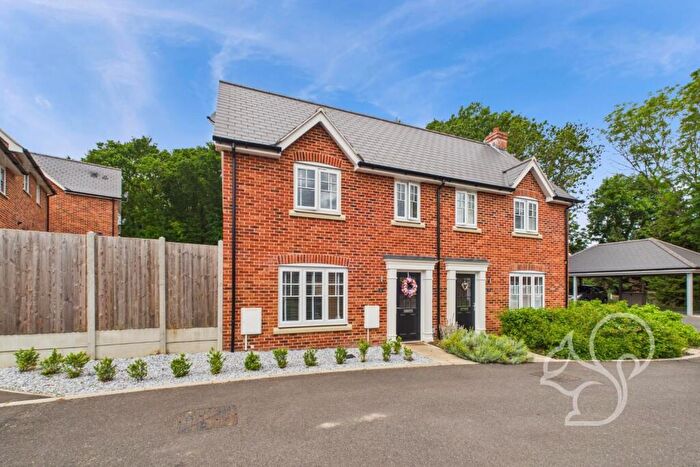
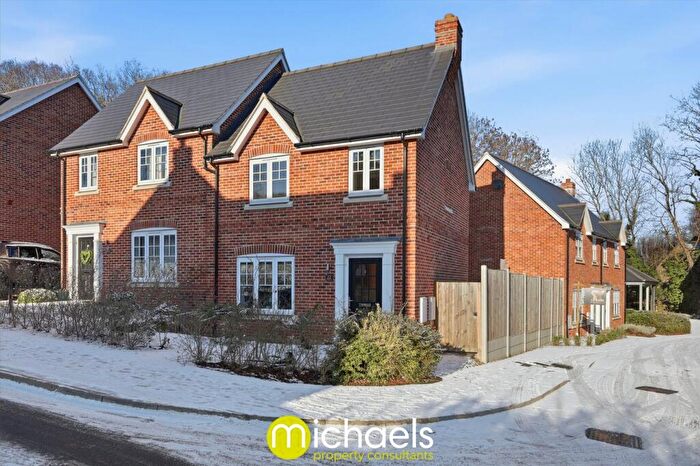
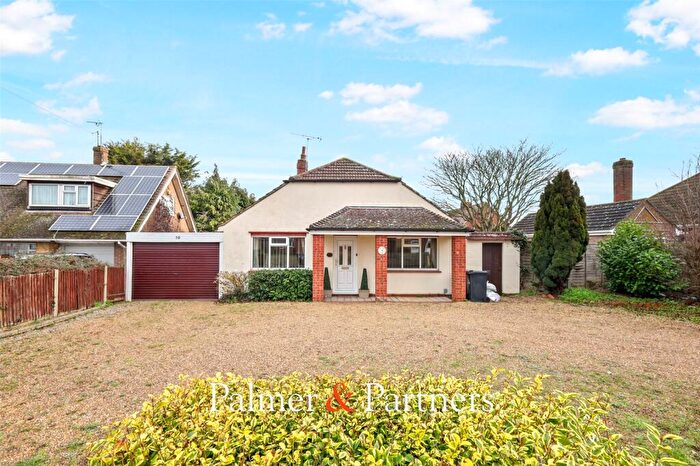
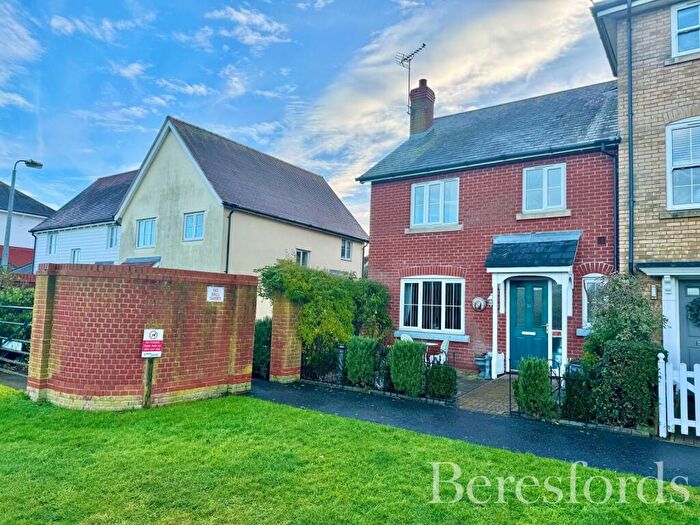
Houses for sale & to rent in East Donyland, Colchester
House Prices in East Donyland
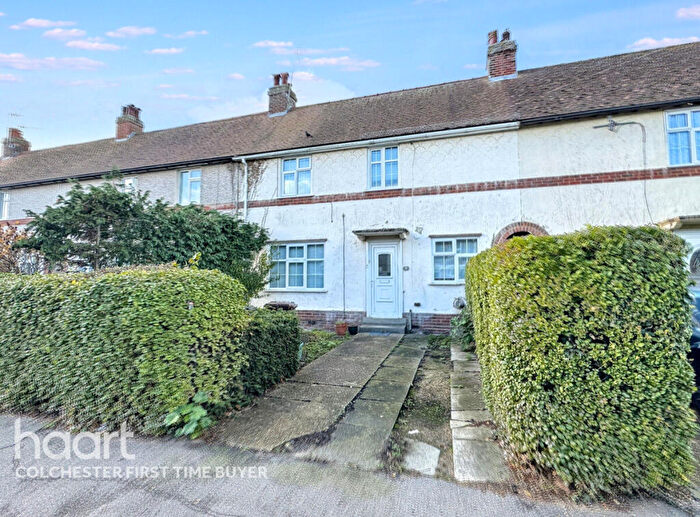
Properties in East Donyland have an average house price of £277,083.00 and had 114 Property Transactions within the last 3 years¹.
East Donyland is an area in Colchester, Essex with 1,156 households², where the most expensive property was sold for £521,500.00.
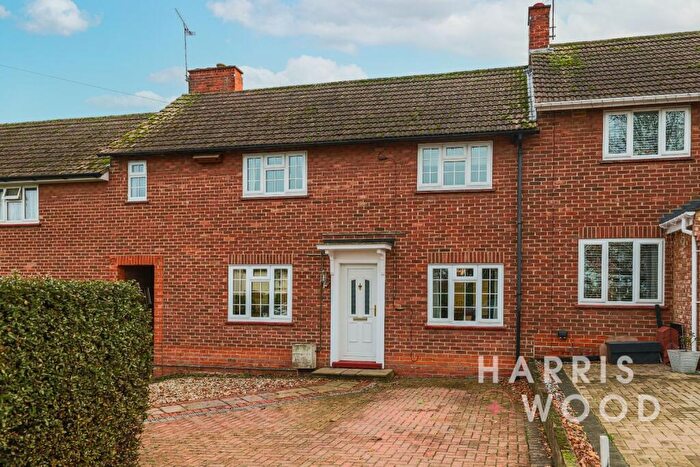
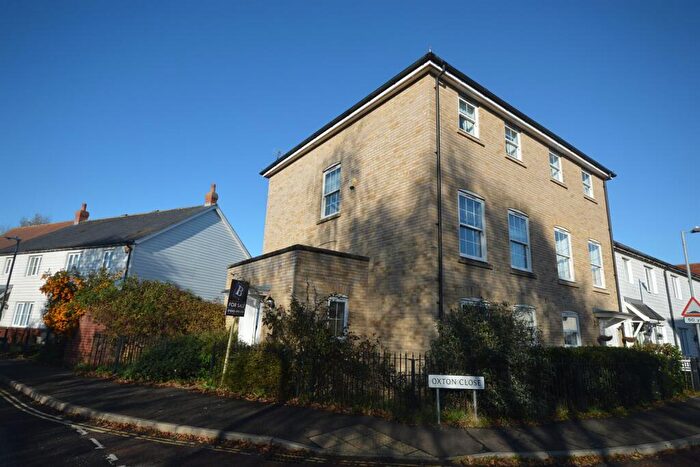
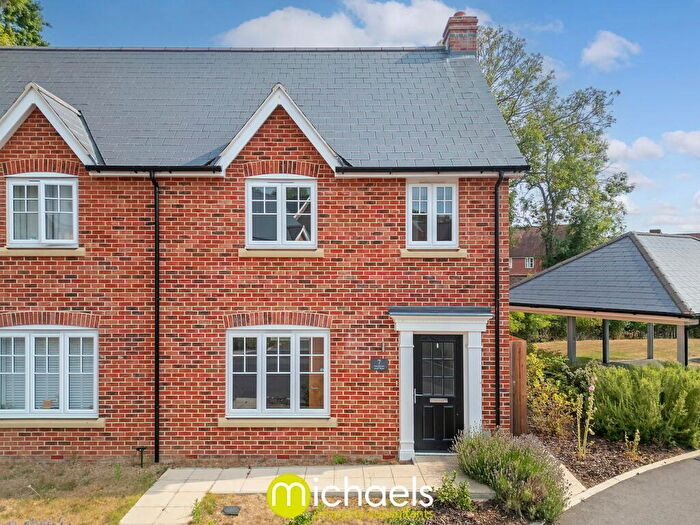
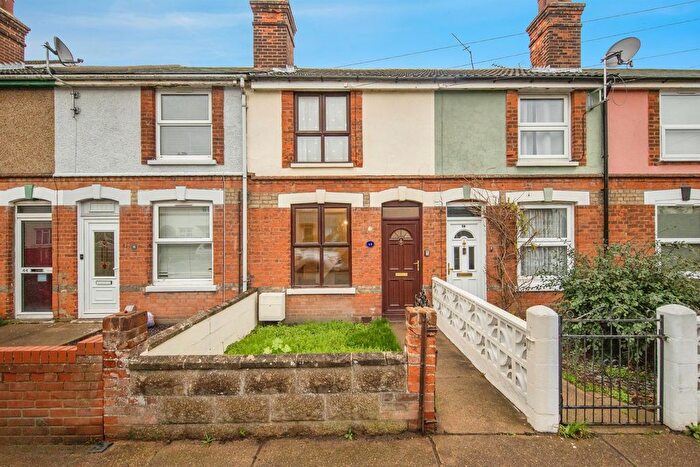
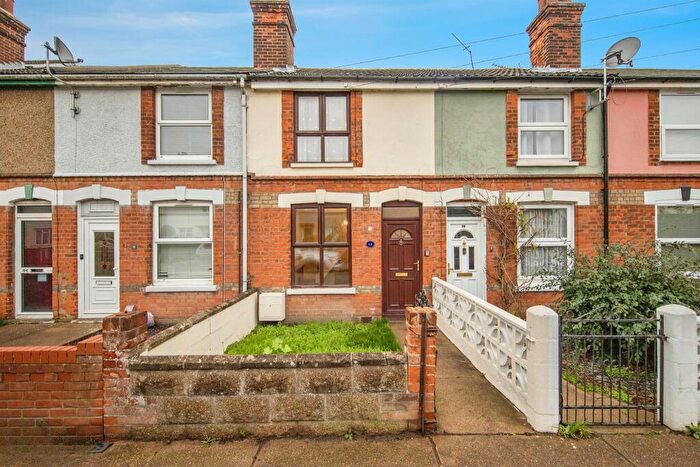
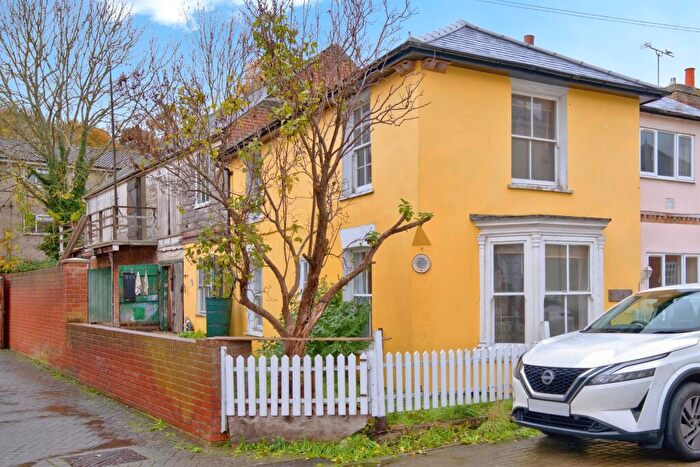
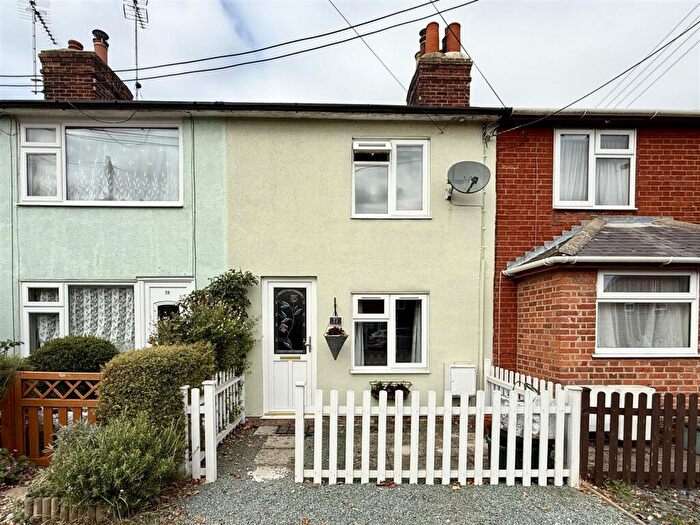
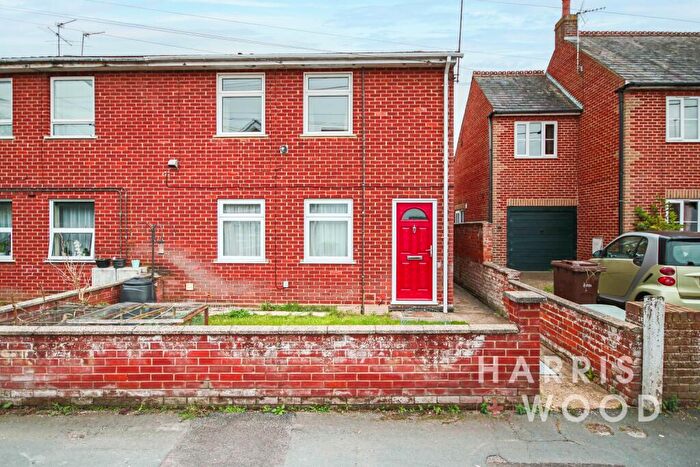
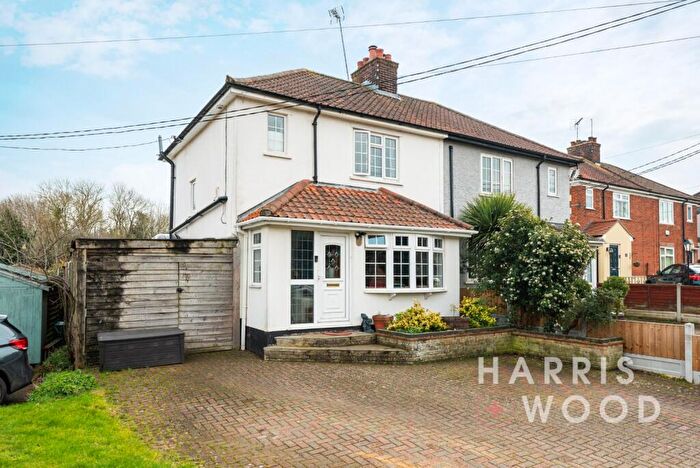
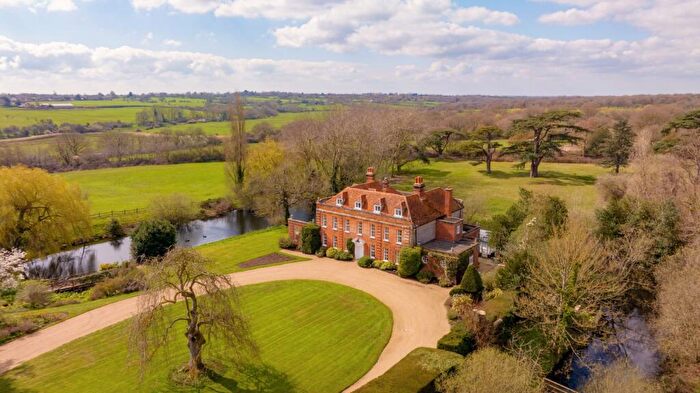
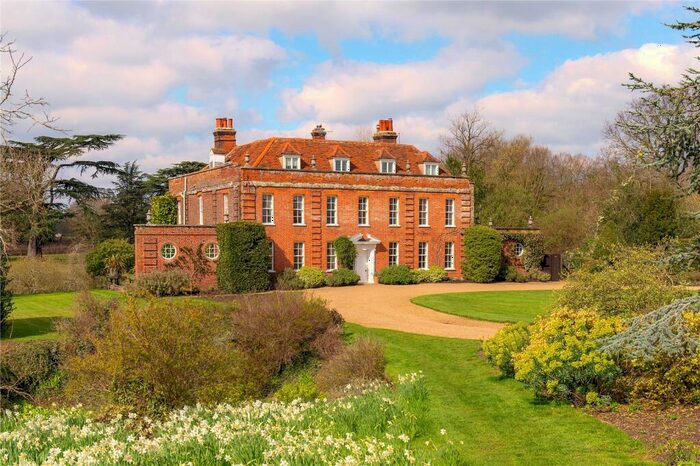
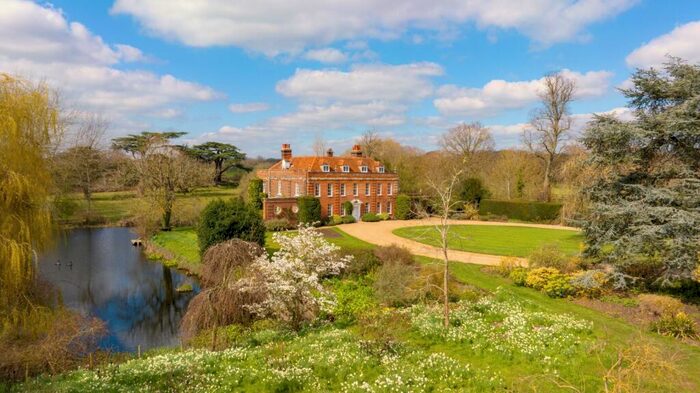
Properties for sale in East Donyland
Roads and Postcodes in East Donyland
Navigate through our locations to find the location of your next house in East Donyland, Colchester for sale or to rent.
| Streets | Postcodes |
|---|---|
| Albion Street | CO5 7ER |
| Ashurst Close | CO5 7HU |
| Berkeley Gardens | CO5 7BD |
| Boyles Court | CO2 0BJ |
| Chapel Street | CO5 7JS |
| Cherry Tree Lane | CO2 0BP |
| Church Hill | CO5 7EB CO5 7ED |
| Church Street | CO5 7EE CO5 7EX CO5 7EY |
| Colne Rise | CO5 7EH CO5 7EJ |
| Darkhouse Lane | CO5 7HJ |
| Donyland Way | CO5 7JA |
| Fingringhoe Road | CO5 7JH |
| Head Street | CO5 7HL CO5 7HN |
| Heath Road | CO5 7HZ |
| High Street | CO5 7EN CO5 7ES CO5 7ET CO5 7HG CO5 7HQ |
| Hillview Close | CO5 7HS CO5 7HT |
| Holt Drive | CO2 0BH CO2 0BL CO2 0BN CO2 0DG CO2 0DH CO2 0DJ CO2 0DP CO2 0DR |
| Iona Walk | CO5 7JD |
| Marasca End | CO2 0DL |
| Maraschino Crescent | CO2 0DN |
| Marsh Crescent | CO5 7JQ CO5 7JR |
| Mersea Road | CO2 0BU CO2 0BX CO2 0BY |
| Nathan Court | CO2 0BW |
| Oxton Close | CO5 7JJ CO5 7JN |
| Parkfield Street | CO5 7EL |
| Rectory Road | CO5 7HP CO5 7HR CO5 7HX CO5 7HY |
| Regent Street | CO5 7EA |
| Rowhedge Road | CO5 7JP |
| Sanderson Mews | CO5 7HF |
| Sexton Close | CO2 0DW |
| Stephen Cranfield Close | CO5 7EZ |
| Sunbeam Close | CO5 7DZ |
| Taylors Road | CO5 7EG |
| Thanet Walk | CO5 7EW |
| West Street | CO5 7HW |
Transport near East Donyland
- FAQ
- Price Paid By Year
- Property Type Price
Frequently asked questions about East Donyland
What is the average price for a property for sale in East Donyland?
The average price for a property for sale in East Donyland is £277,083. This amount is 20% lower than the average price in Colchester. There are 200 property listings for sale in East Donyland.
What streets have the most expensive properties for sale in East Donyland?
The streets with the most expensive properties for sale in East Donyland are Sanderson Mews at an average of £450,000, Mersea Road at an average of £425,000 and Thanet Walk at an average of £380,000.
What streets have the most affordable properties for sale in East Donyland?
The streets with the most affordable properties for sale in East Donyland are Stephen Cranfield Close at an average of £128,750, Head Street at an average of £166,500 and Iona Walk at an average of £179,666.
Which train stations are available in or near East Donyland?
Some of the train stations available in or near East Donyland are Wivenhoe, Hythe and Colchester Town.
Property Price Paid in East Donyland by Year
The average sold property price by year was:
| Year | Average Sold Price | Price Change |
Sold Properties
|
|---|---|---|---|
| 2025 | £281,770 | 5% |
24 Properties |
| 2024 | £268,260 | -2% |
25 Properties |
| 2023 | £273,051 | -4% |
29 Properties |
| 2022 | £283,333 | 3% |
36 Properties |
| 2021 | £274,368 | 3% |
70 Properties |
| 2020 | £264,989 | 11% |
37 Properties |
| 2019 | £236,975 | -12% |
41 Properties |
| 2018 | £266,471 | 16% |
53 Properties |
| 2017 | £224,519 | -3% |
51 Properties |
| 2016 | £230,438 | 2% |
74 Properties |
| 2015 | £226,419 | 18% |
59 Properties |
| 2014 | £185,693 | -8% |
53 Properties |
| 2013 | £200,362 | 22% |
51 Properties |
| 2012 | £156,183 | -16% |
30 Properties |
| 2011 | £181,072 | -12% |
40 Properties |
| 2010 | £202,931 | 16% |
38 Properties |
| 2009 | £170,029 | 6% |
49 Properties |
| 2008 | £160,273 | -26% |
31 Properties |
| 2007 | £202,078 | 17% |
57 Properties |
| 2006 | £168,401 | 6% |
102 Properties |
| 2005 | £158,521 | 3% |
66 Properties |
| 2004 | £153,564 | 6% |
80 Properties |
| 2003 | £144,739 | 24% |
105 Properties |
| 2002 | £109,763 | 5% |
121 Properties |
| 2001 | £104,651 | 22% |
95 Properties |
| 2000 | £81,310 | 5% |
50 Properties |
| 1999 | £77,227 | 19% |
69 Properties |
| 1998 | £62,363 | 18% |
57 Properties |
| 1997 | £51,267 | 4% |
41 Properties |
| 1996 | £49,459 | -10% |
49 Properties |
| 1995 | £54,426 | - |
37 Properties |
Property Price per Property Type in East Donyland
Here you can find historic sold price data in order to help with your property search.
The average Property Paid Price for specific property types in the last three years are:
| Property Type | Average Sold Price | Sold Properties |
|---|---|---|
| Semi Detached House | £315,484.00 | 31 Semi Detached Houses |
| Detached House | £359,882.00 | 17 Detached Houses |
| Terraced House | £270,104.00 | 43 Terraced Houses |
| Flat | £177,173.00 | 23 Flats |

