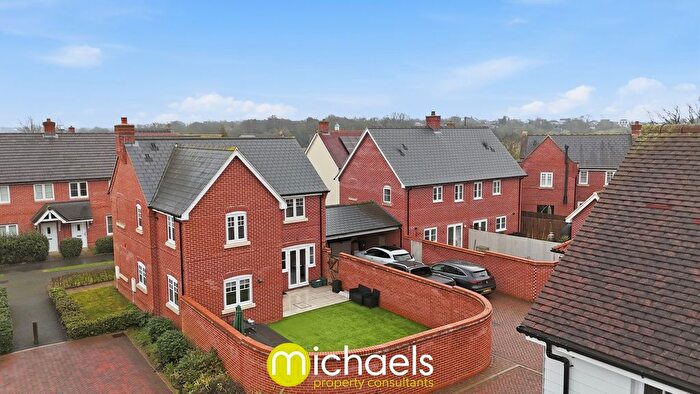
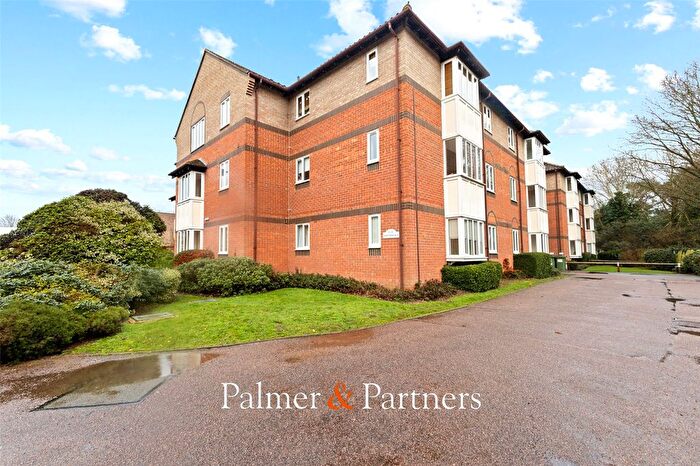
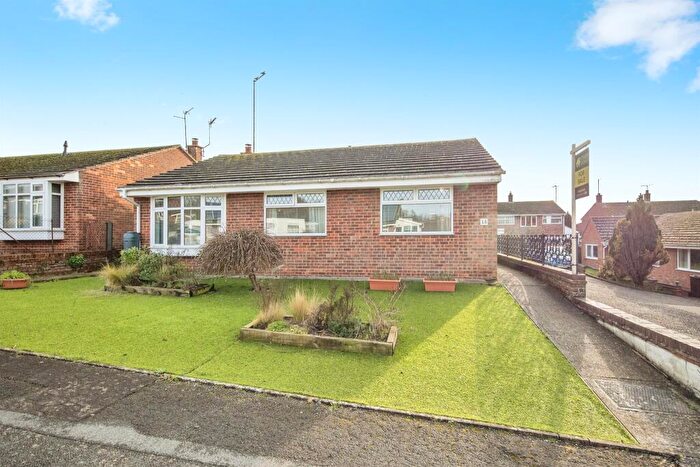
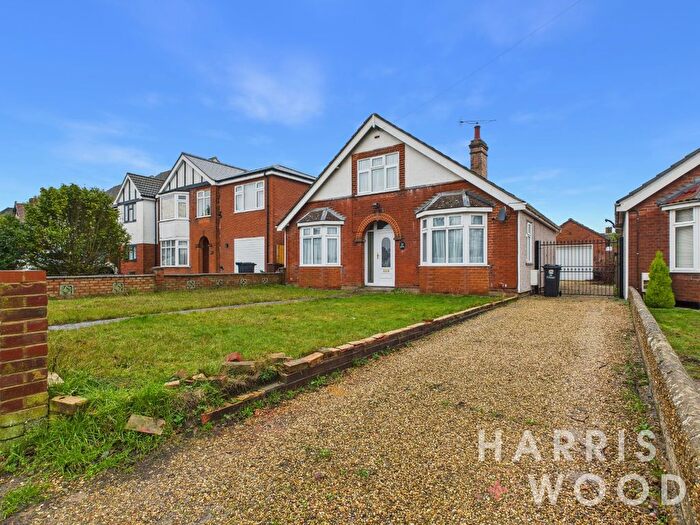
Houses for sale & to rent in Pyefleet, Colchester
House Prices in Pyefleet
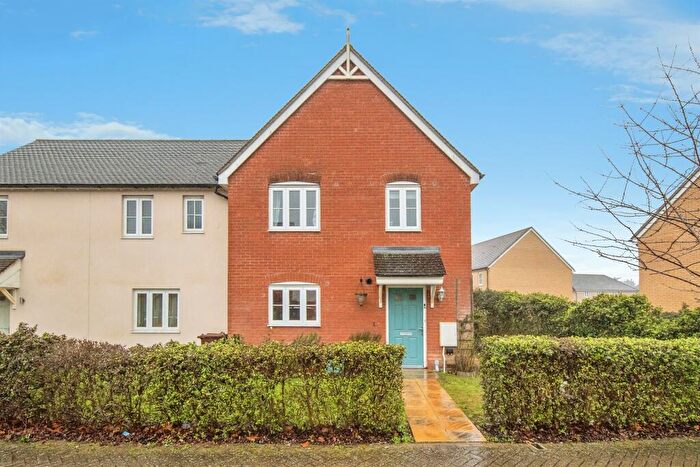
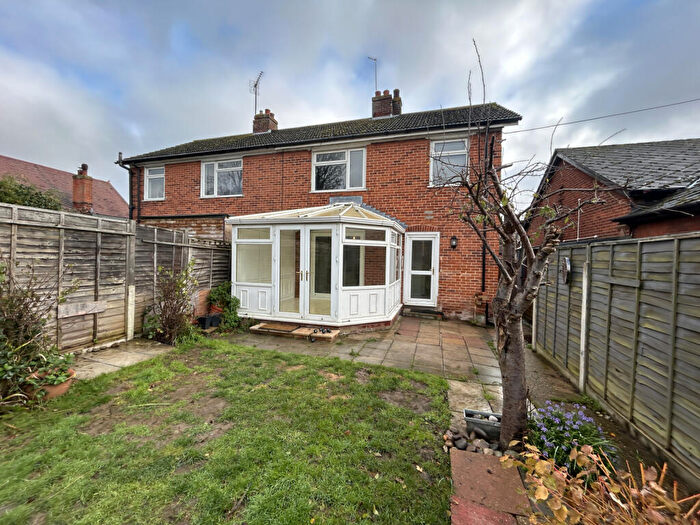
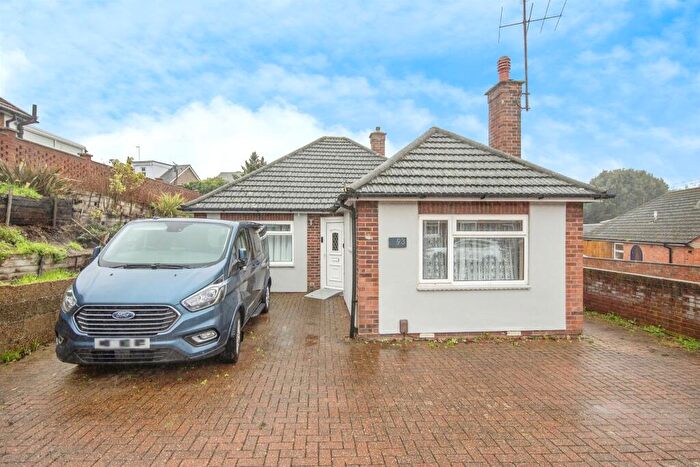
Properties in Pyefleet have an average house price of £529,547.00 and had 77 Property Transactions within the last 3 years¹.
Pyefleet is an area in Colchester, Essex with 1,004 households², where the most expensive property was sold for £1,455,000.00.
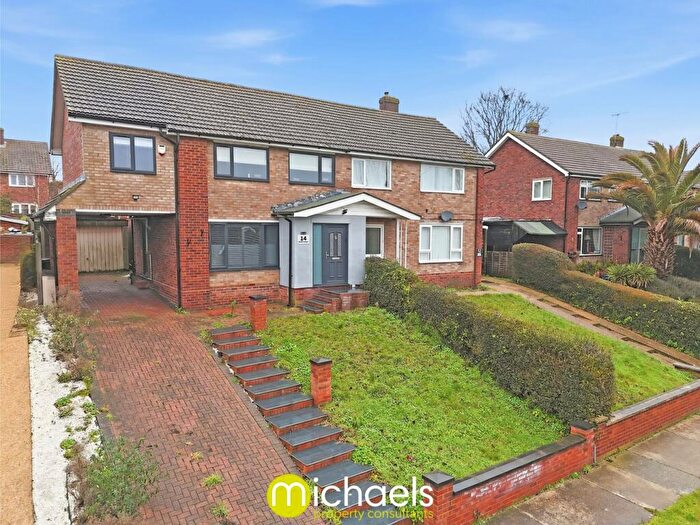
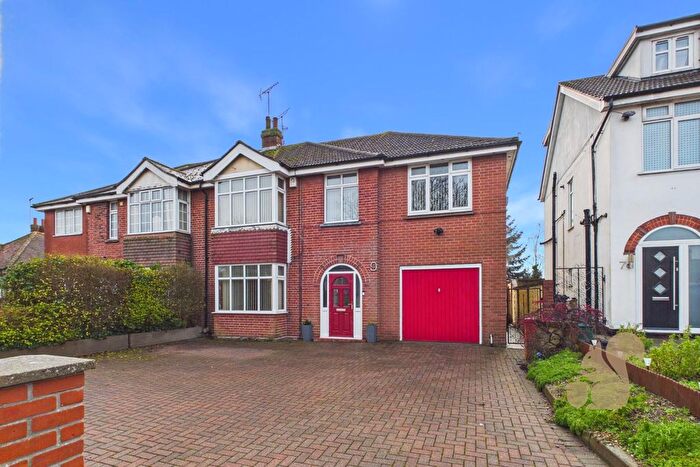
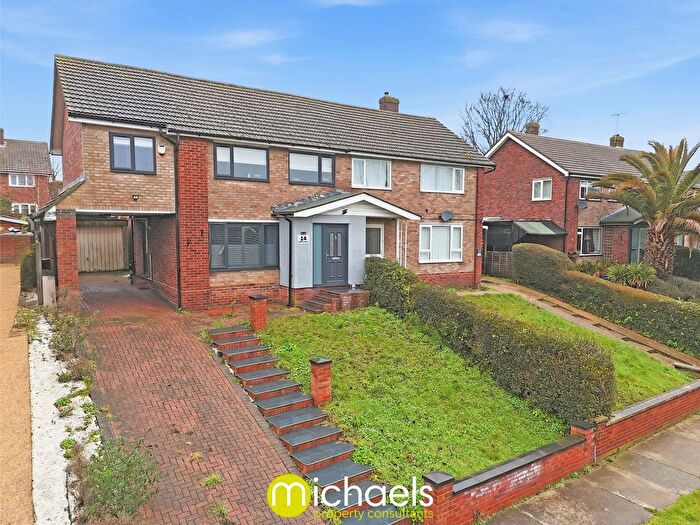
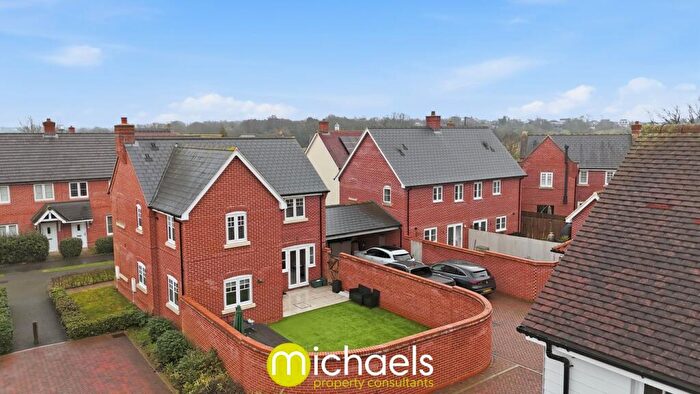
Properties for sale in Pyefleet
Roads and Postcodes in Pyefleet
Navigate through our locations to find the location of your next house in Pyefleet, Colchester for sale or to rent.
| Streets | Postcodes |
|---|---|
| Abberton Road | CO5 7AL CO5 7AN CO5 7AR CO5 7AS CO5 7AT CO5 7AW |
| Ballast Quay Road | CO5 7DB |
| Bracken Way | CO5 7PG |
| Brand Drive | CO5 7LY |
| Bromans Lane | CO5 8UE |
| Brook Hall Road | CO5 7DE CO5 7DG |
| Broom Way | CO5 7PQ |
| Chapel Road | CO5 7AU CO5 7BG CO5 7BH |
| Church Lane | CO5 8TJ |
| Church Road | CO5 7BJ CO5 7BL CO5 7BN CO5 7PS CO5 7PT |
| Colchester Road | CO5 7LN CO5 7QJ CO5 7QP |
| Dormy Houses | CO5 8UW |
| Dudley Road | CO5 7DS |
| East Road | CO5 8SZ CO5 8TA CO5 8TP CO5 8TQ CO5 8UJ CO5 8UN |
| Edward Marke Drive | CO5 7LP |
| Ferry Road | CO5 7BX CO5 7BY |
| Fingringhoe Road | CO5 7LA CO5 7LB |
| Frere Way | CO5 7BP |
| Froghall Close | CO5 7BS |
| Furneaux Lane | CO5 7BQ |
| Hall Cottages | CO5 8TG |
| Hall Lane | CO5 7NA |
| Haye Lane | CO5 7AD CO5 7AE |
| Hillside Cottages | CO5 8TE |
| Ivy Lane | CO5 8US |
| Kingfisher Cottages | CO5 7NX |
| Langenhoe Park | CO5 7JF |
| Layer Road | CO5 7NH CO5 7NL |
| Lodge Lane | CO5 7PZ |
| Lower Road | CO5 7PR CO5 7QR |
| Malting Road | CO5 7PU |
| Meadow Way | CO5 7PH |
| Meeting Lane | CO5 8TD |
| Mersea Road | CO5 7LE CO5 7LF CO5 7LH CO5 7LJ CO5 7LL CO5 7LQ CO5 7LW CO5 7NR CO5 7NS CO5 7NT CO5 7QE CO5 7QG |
| Mulberry Gardens | CO5 7AZ |
| Newpots Close | CO5 7PP |
| Peldon Crescent | CO5 7QF |
| Peldon Road | CO5 7PB CO5 7PD CO5 7PE CO5 7QA |
| Pertwee Way | CO5 7LR |
| Proctor Close | CO5 7LZ |
| Pyefleet Close | CO5 7BT |
| Pyefleet View | CO5 7LD |
| Rectory Lane | CO5 7NJ |
| Sawkins Close | CO5 7LU |
| Shop Lane | CO5 8TR |
| South Green Road | CO5 7DP CO5 7DR CO5 7DW |
| St Ives Road | CO5 7QD |
| The Paddocks | CO5 7PA |
| The Retreat | CO5 7NW |
| The Strood | CO5 7QL |
| Upper Haye Lane | CO5 7AB |
| Wigborough Road | CO5 7RA |
Transport near Pyefleet
- FAQ
- Price Paid By Year
- Property Type Price
Frequently asked questions about Pyefleet
What is the average price for a property for sale in Pyefleet?
The average price for a property for sale in Pyefleet is £529,547. This amount is 52% higher than the average price in Colchester. There are 7,215 property listings for sale in Pyefleet.
What streets have the most expensive properties for sale in Pyefleet?
The streets with the most expensive properties for sale in Pyefleet are South Green Road at an average of £1,041,666, Dormy Houses at an average of £680,000 and Ballast Quay Road at an average of £670,000.
What streets have the most affordable properties for sale in Pyefleet?
The streets with the most affordable properties for sale in Pyefleet are Meadow Way at an average of £282,500, Bracken Way at an average of £300,000 and Peldon Crescent at an average of £347,500.
Which train stations are available in or near Pyefleet?
Some of the train stations available in or near Pyefleet are Wivenhoe, Alresford and Hythe.
Property Price Paid in Pyefleet by Year
The average sold property price by year was:
| Year | Average Sold Price | Price Change |
Sold Properties
|
|---|---|---|---|
| 2025 | £554,258 | -5% |
31 Properties |
| 2024 | £583,152 | 24% |
23 Properties |
| 2023 | £442,636 | -14% |
23 Properties |
| 2022 | £506,396 | 3% |
42 Properties |
| 2021 | £492,779 | 13% |
49 Properties |
| 2020 | £427,963 | 3% |
30 Properties |
| 2019 | £416,886 | -3% |
22 Properties |
| 2018 | £427,448 | -2% |
29 Properties |
| 2017 | £435,882 | 10% |
34 Properties |
| 2016 | £392,804 | 5% |
41 Properties |
| 2015 | £374,840 | -1% |
47 Properties |
| 2014 | £378,988 | 0,3% |
42 Properties |
| 2013 | £377,961 | 21% |
31 Properties |
| 2012 | £300,181 | 4% |
44 Properties |
| 2011 | £287,231 | -8% |
27 Properties |
| 2010 | £309,298 | -4% |
29 Properties |
| 2009 | £320,259 | 11% |
49 Properties |
| 2008 | £283,532 | -9% |
31 Properties |
| 2007 | £309,043 | 2% |
69 Properties |
| 2006 | £303,305 | 8% |
45 Properties |
| 2005 | £277,685 | 1% |
34 Properties |
| 2004 | £275,776 | 8% |
55 Properties |
| 2003 | £253,326 | 7% |
47 Properties |
| 2002 | £234,630 | 24% |
31 Properties |
| 2001 | £177,555 | 24% |
55 Properties |
| 2000 | £134,819 | -11% |
43 Properties |
| 1999 | £149,102 | 25% |
45 Properties |
| 1998 | £111,971 | 13% |
55 Properties |
| 1997 | £97,656 | -11% |
54 Properties |
| 1996 | £108,091 | 18% |
41 Properties |
| 1995 | £89,175 | - |
50 Properties |
Property Price per Property Type in Pyefleet
Here you can find historic sold price data in order to help with your property search.
The average Property Paid Price for specific property types in the last three years are:
| Property Type | Average Sold Price | Sold Properties |
|---|---|---|
| Semi Detached House | £361,832.00 | 14 Semi Detached Houses |
| Detached House | £588,313.00 | 59 Detached Houses |
| Flat | £171,333.00 | 3 Flats |
| Terraced House | £485,000.00 | 1 Terraced House |

