
Houses for sale & to rent in Ongar, Essex
House Prices in Ongar
Properties in Ongar have an average house price of £574k and had 413 Property Transactions within the last 3 years.¹
Ongar is an area in Essex with 4,295 households², where the most expensive property was sold for £2.6M.
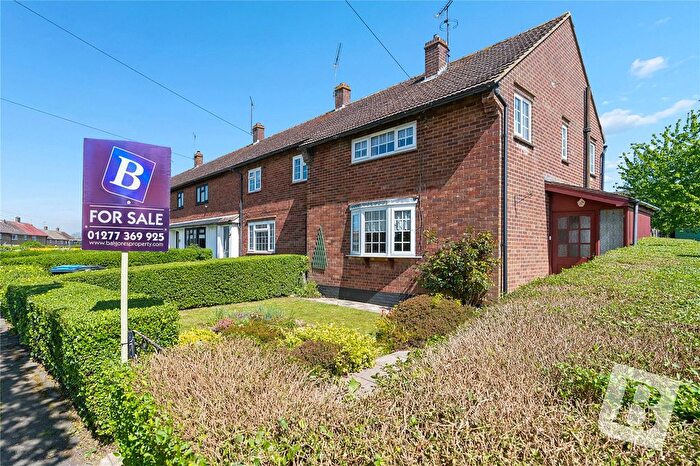
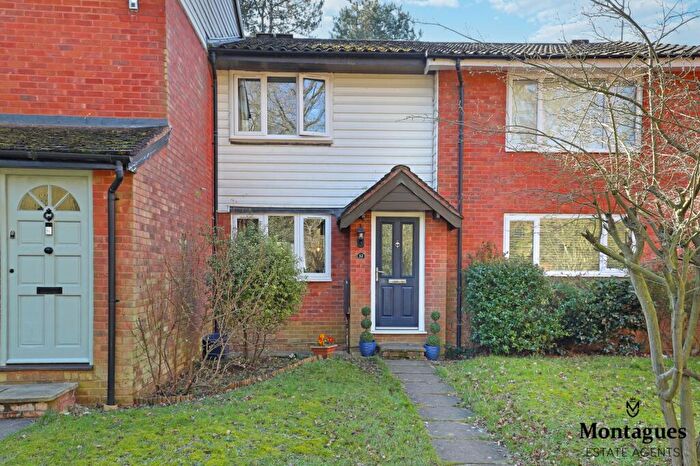
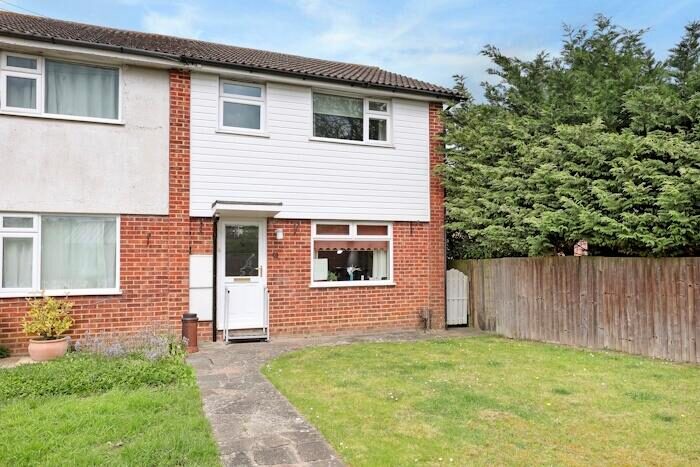
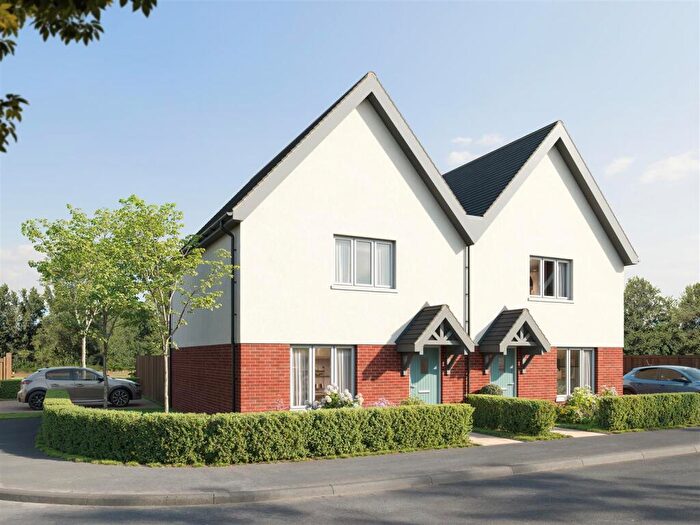
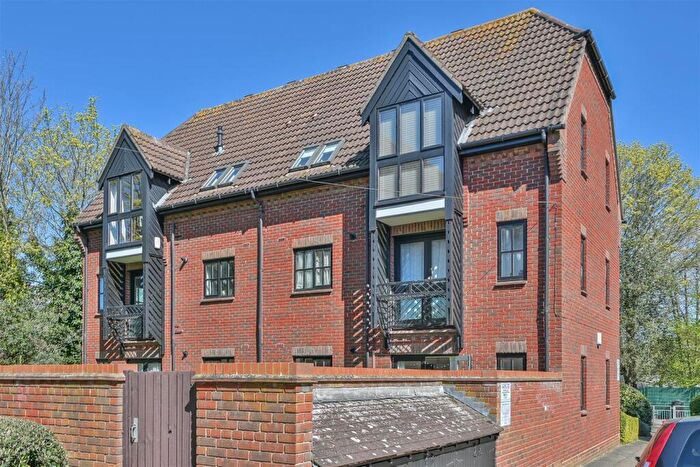
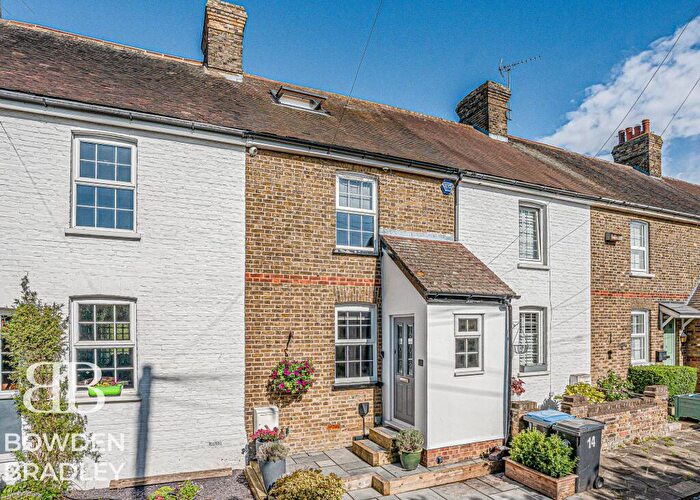
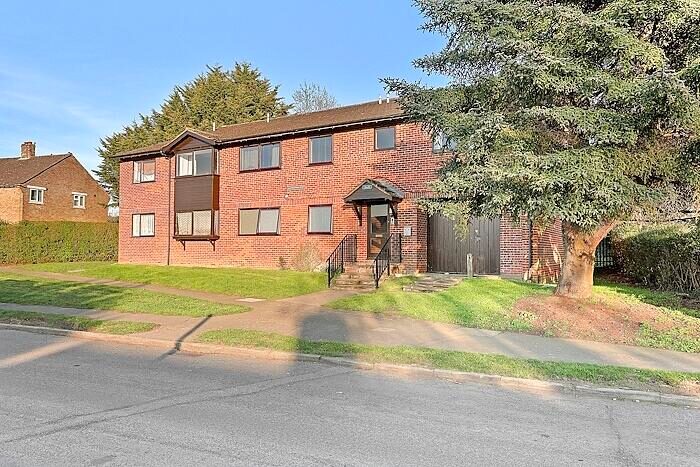
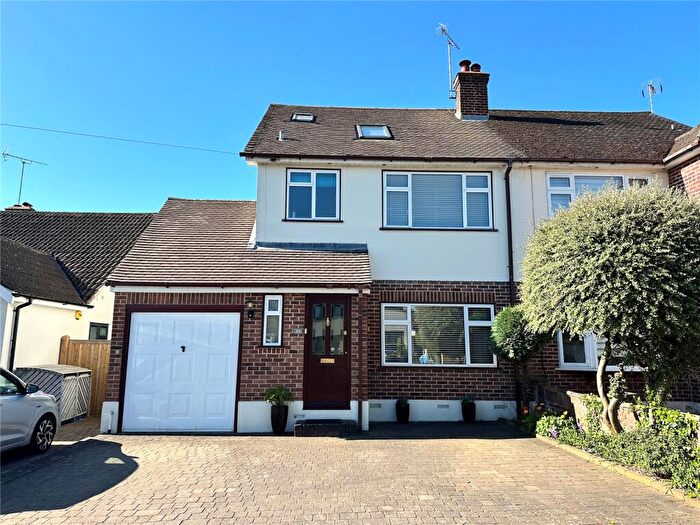
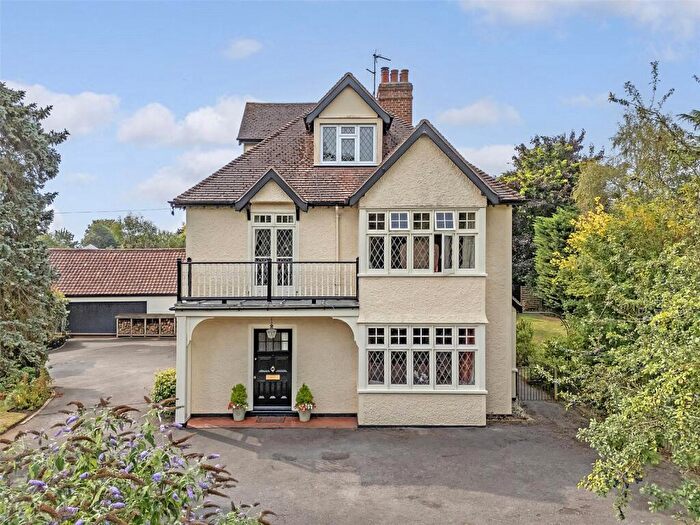
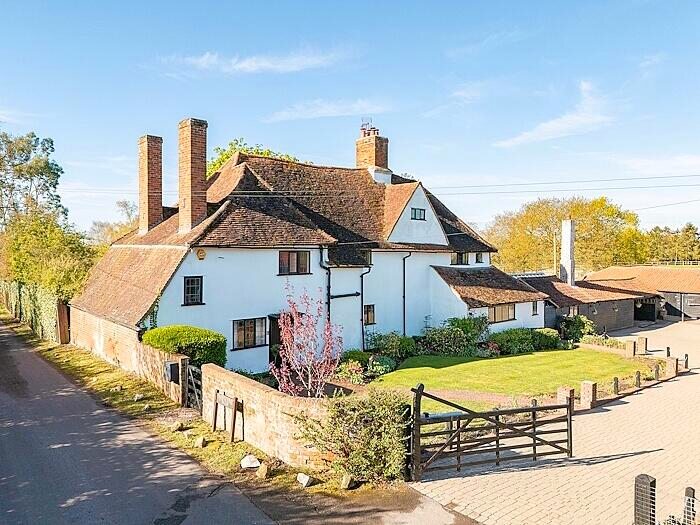
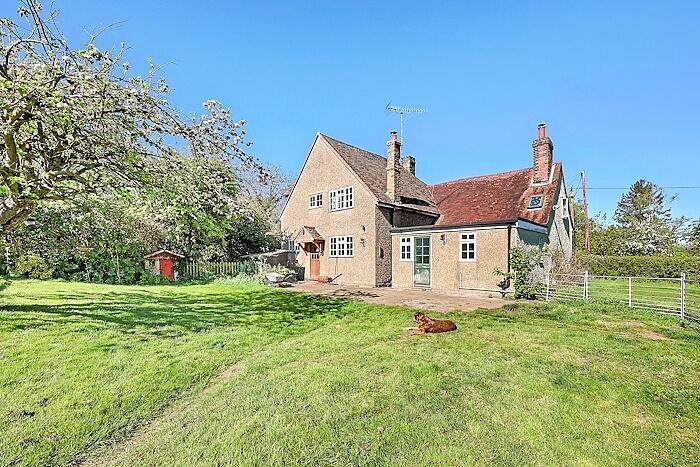
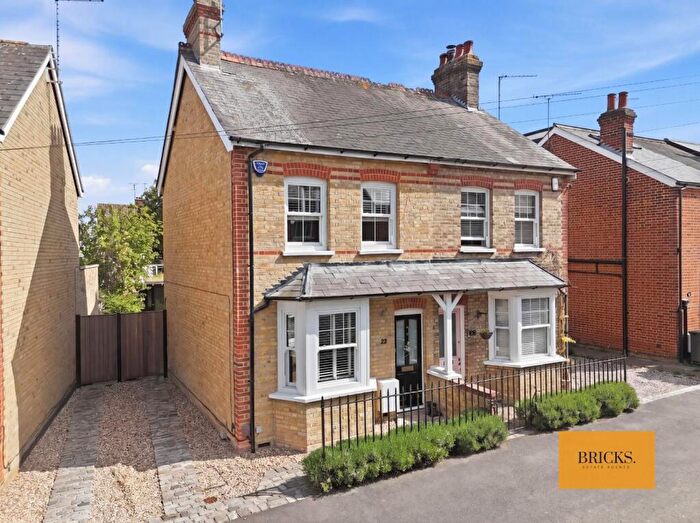
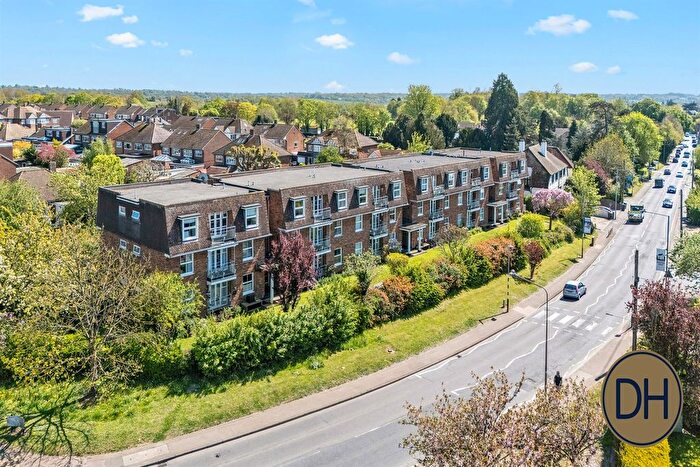
Properties for sale in Ongar
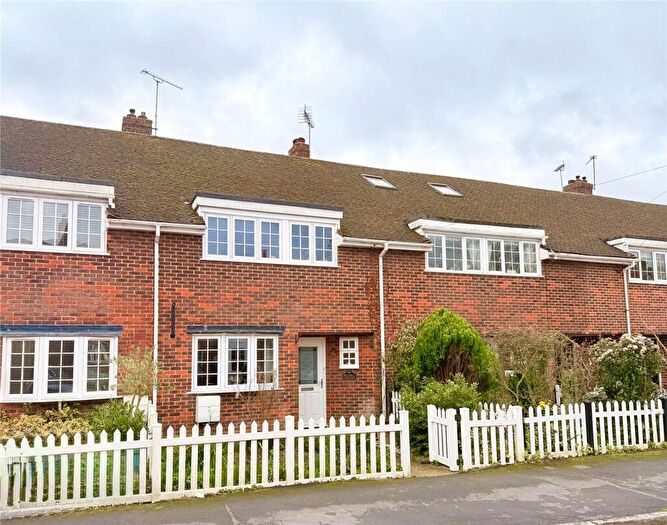


![]()
If you are looking to sell your house, let it out, or receive a property valuation, an expert can help you.
Click the button below to get started.


Neighbourhoods in Ongar
Navigate through our locations to find the location of your next house in Ongar, Essex for sale or to rent.
Transport in Ongar
Please see below transportation links in this area:
-
 Epping Station
 -
 Harlow Mill Station
 -
Ingatestone Station
-
Theydon Bois Station
-
 Shenfield Station
 -
Sawbridgeworth Station
-
Harlow Town Station
-
Brentwood Station
-
Debden Station
-
Harold Wood Station
- FAQ
- Price Paid By Year
- Property Type Price
Frequently asked questions about Ongar
What is the average price for a property for sale in Ongar?
The average price for a property for sale in Ongar is £574,282. This amount is 41% higher than the average price in Essex. There are 6,929 property listings for sale in Ongar.
What locations have the most expensive properties for sale in Ongar?
The locations with the most expensive properties for sale in Ongar are Moreton And Fyfield at an average of £881,373, Passingford at an average of £878,611 and High Ongar, Willingale And The Rodings at an average of £737,173.
What locations have the most affordable properties for sale in Ongar?
The locations with the most affordable properties for sale in Ongar are Shelley at an average of £428,156 and Chipping Ongar, Greensted And Marden Ash at an average of £508,181.
Which train stations are available in or near Ongar?
Some of the train stations available in or near Ongar are Harlow Mill, Ingatestone and Shenfield.
Which tube stations are available in or near Ongar?
Some of the tube stations available in or near Ongar are Epping, Theydon Bois and Debden.
Property Price Paid in Ongar by Year
The average sold property price by year was:
| Year | Average Sold Price | Price Change |
Sold Properties
|
|---|---|---|---|
| 2026 | £586,458 | 6% |
12 Properties |
| 2025 | £553,224 | -14% |
126 Properties |
| 2024 | £629,312 | 14% |
133 Properties |
| 2023 | £540,397 | -6% |
142 Properties |
| 2022 | £570,638 | 3% |
170 Properties |
| 2021 | £552,169 | -4% |
203 Properties |
| 2020 | £572,786 | 8% |
183 Properties |
| 2019 | £525,890 | 7% |
166 Properties |
| 2018 | £488,013 | 1% |
178 Properties |
| 2017 | £484,204 | 6% |
175 Properties |
| 2016 | £453,559 | 8% |
165 Properties |
| 2015 | £418,506 | 6% |
203 Properties |
| 2014 | £392,830 | 7% |
209 Properties |
| 2013 | £363,938 | 10% |
151 Properties |
| 2012 | £326,495 | -13% |
118 Properties |
| 2011 | £369,443 | 0,4% |
122 Properties |
| 2010 | £367,994 | 10% |
143 Properties |
| 2009 | £332,793 | -23% |
84 Properties |
| 2008 | £410,174 | 10% |
114 Properties |
| 2007 | £367,922 | 12% |
231 Properties |
| 2006 | £324,678 | 5% |
260 Properties |
| 2005 | £308,819 | -5% |
167 Properties |
| 2004 | £324,078 | 12% |
185 Properties |
| 2003 | £283,754 | 14% |
210 Properties |
| 2002 | £245,272 | 5% |
198 Properties |
| 2001 | £232,778 | 11% |
191 Properties |
| 2000 | £206,425 | 17% |
226 Properties |
| 1999 | £170,627 | 13% |
234 Properties |
| 1998 | £148,387 | 23% |
138 Properties |
| 1997 | £114,309 | 2% |
159 Properties |
| 1996 | £111,530 | 22% |
164 Properties |
| 1995 | £87,175 | - |
141 Properties |
Property Price per Property Type in Ongar
Here you can find historic sold price data in order to help with your property search.
The average Property Paid Price for specific property types in the last three years are:
| Property Type | Average Sold Price | Sold Properties |
|---|---|---|
| Semi Detached House | £498,626.00 | 161 Semi Detached Houses |
| Detached House | £901,112.00 | 125 Detached Houses |
| Terraced House | £450,376.00 | 64 Terraced Houses |
| Flat | £245,027.00 | 63 Flats |