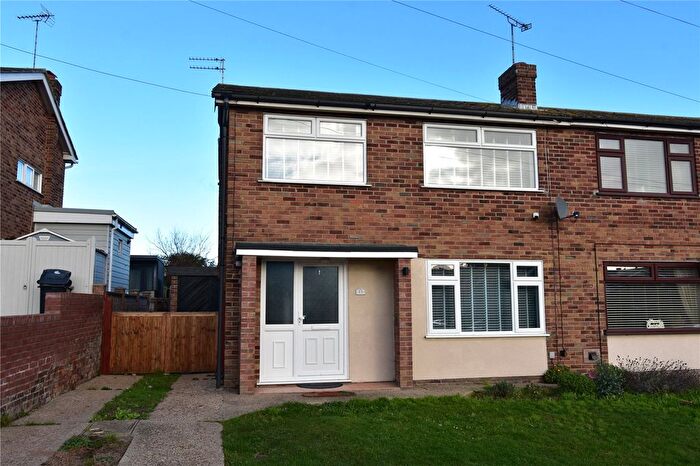
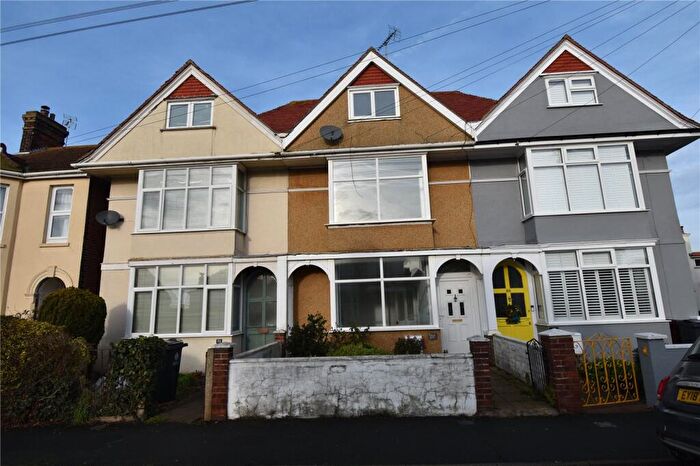
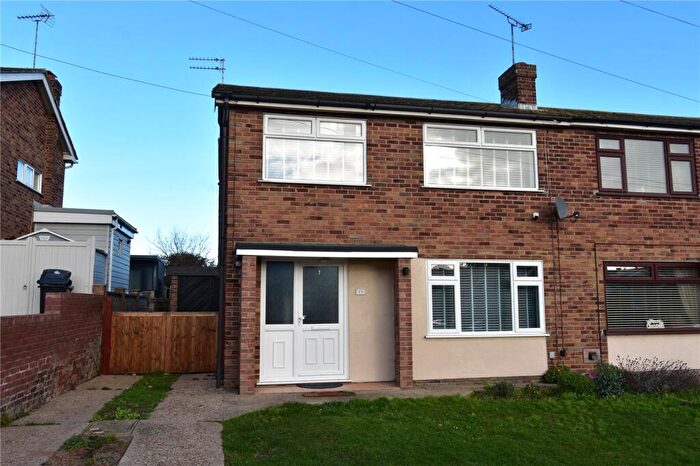
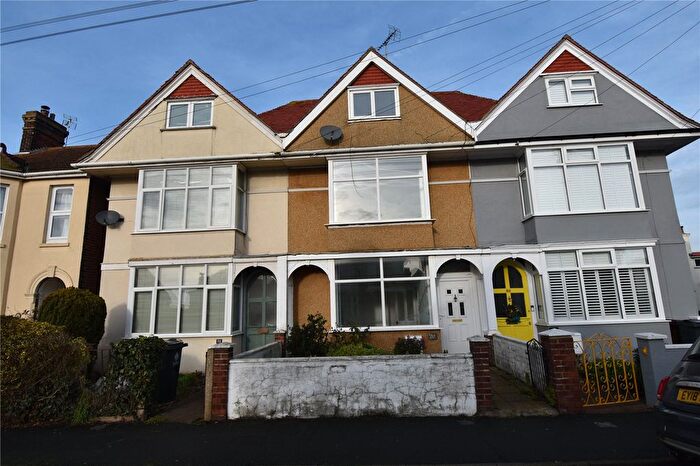
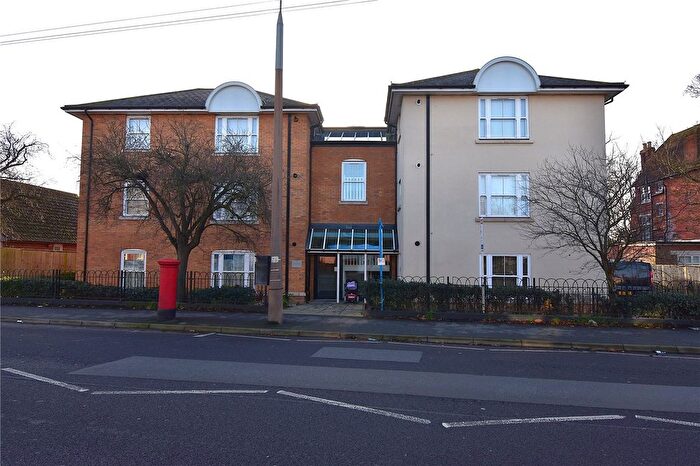
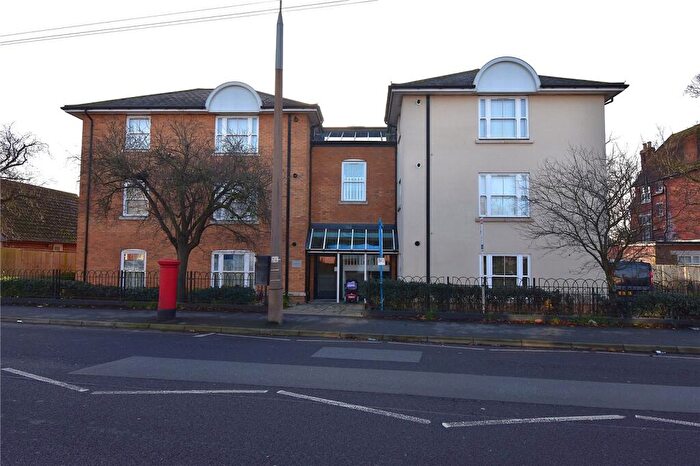
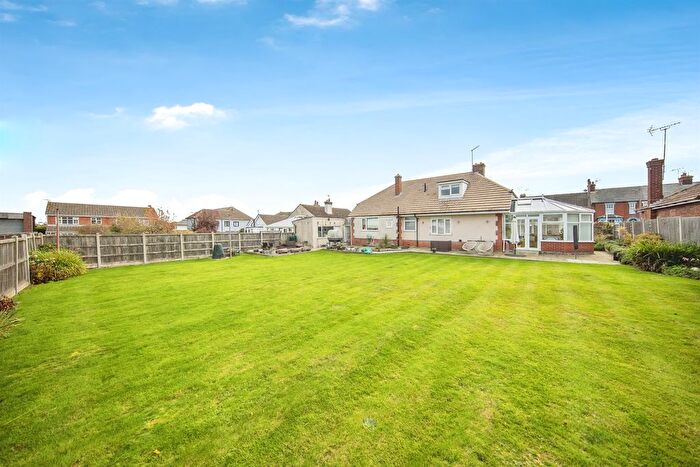
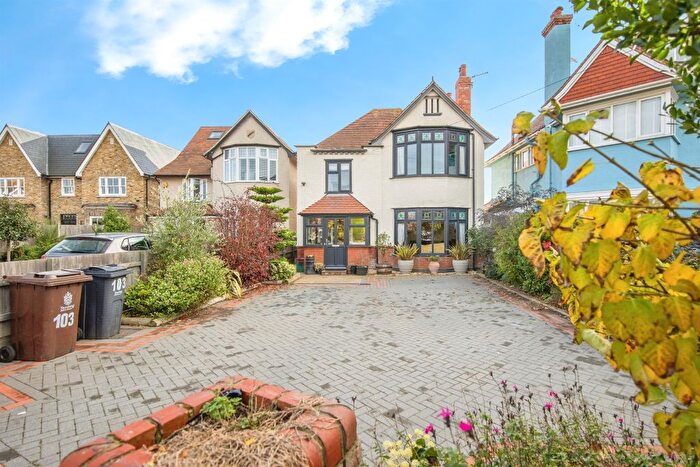
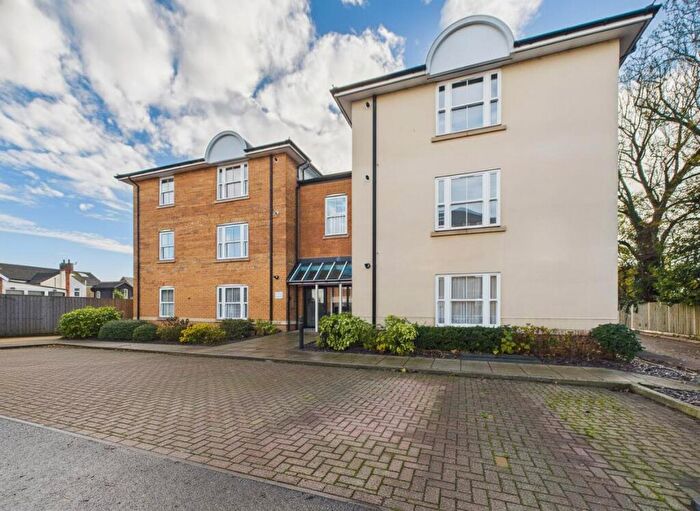
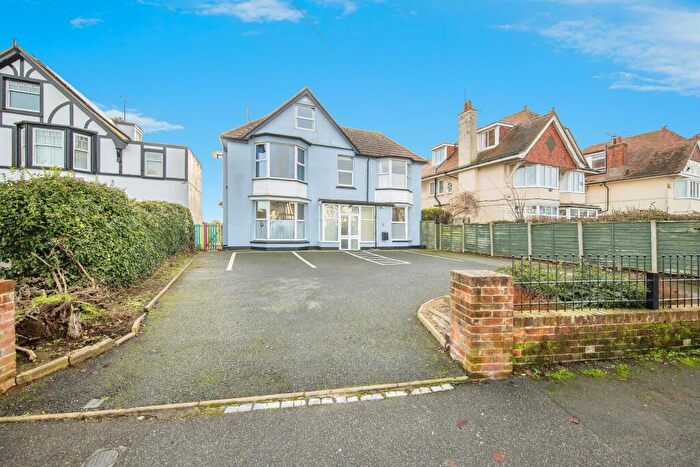
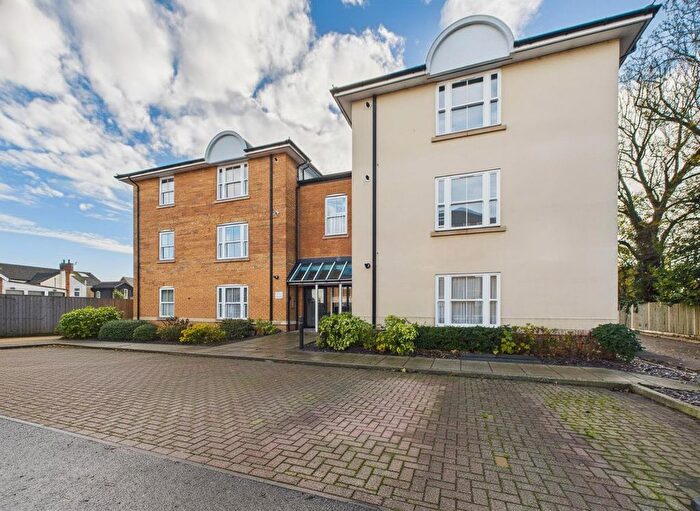
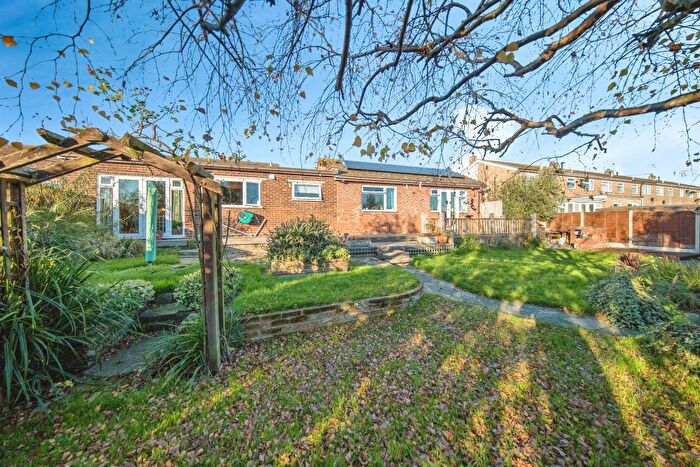
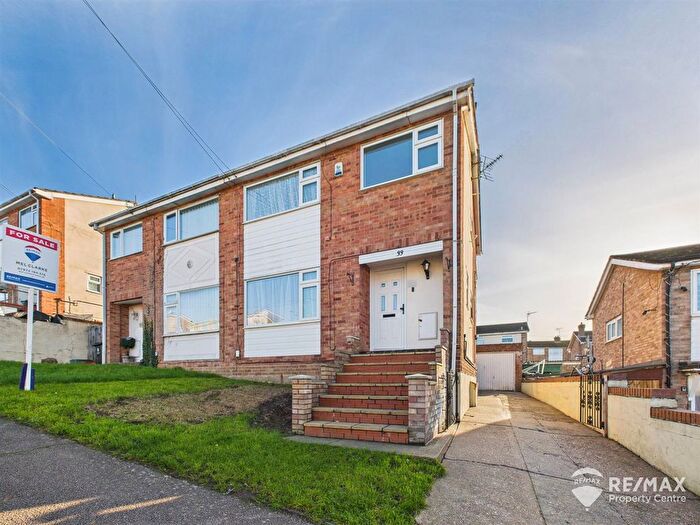
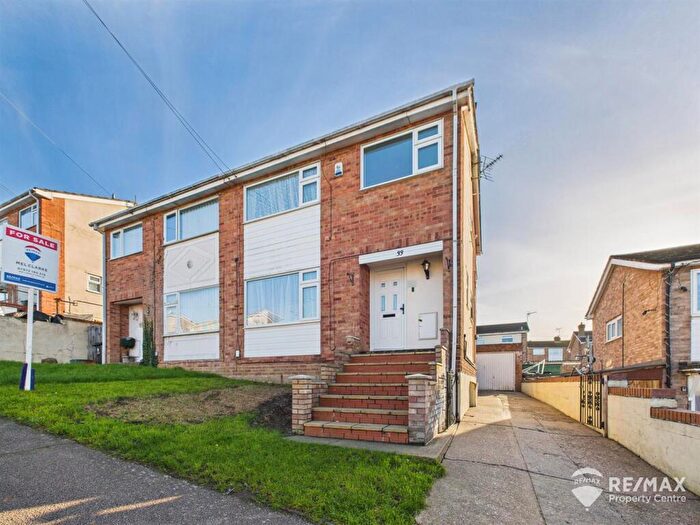
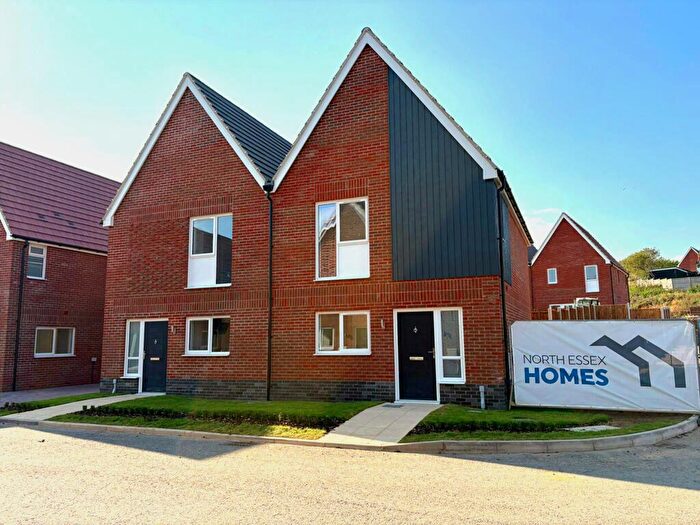
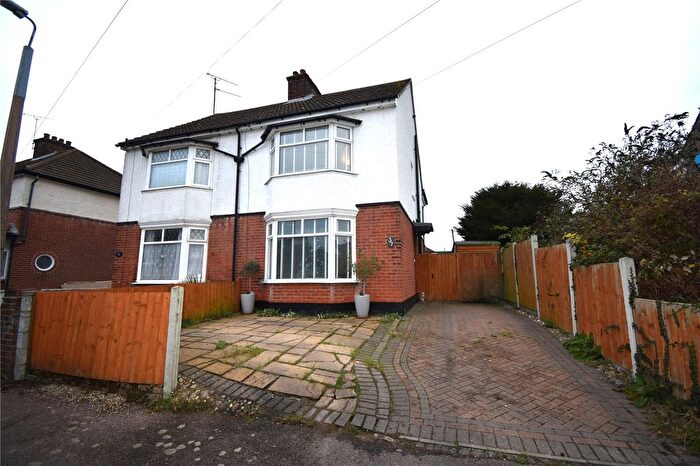
Houses for sale & to rent in Dovercourt All Saints, Harwich
House Prices in Dovercourt All Saints
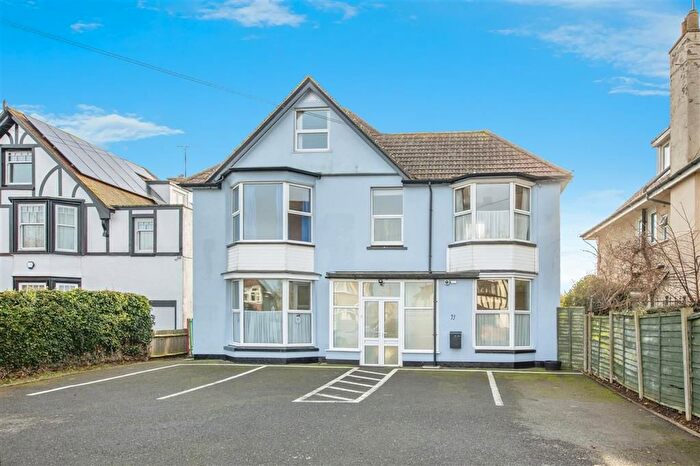
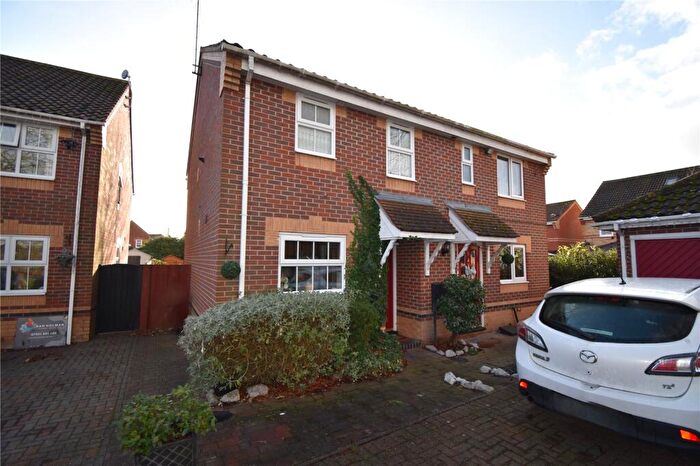
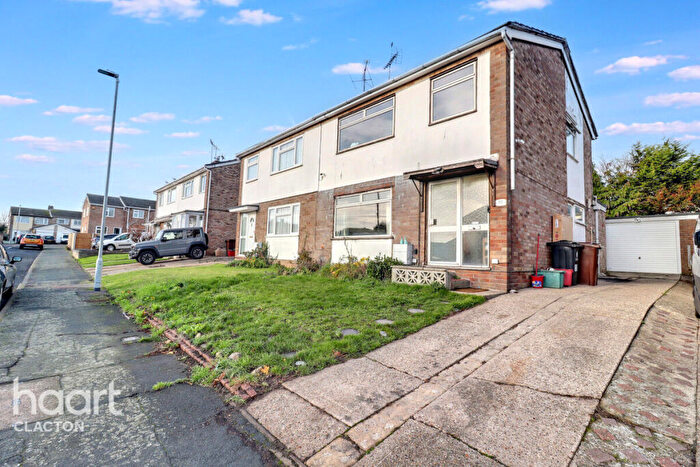
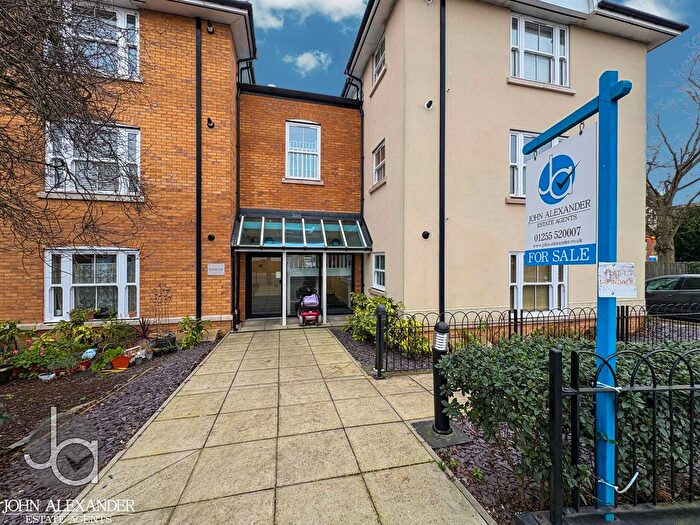
Properties in Dovercourt All Saints have an average house price of £316,680.00 and had 5 Property Transactions within the last 3 years¹.
Dovercourt All Saints is an area in Harwich, Essex with 68 households², where the most expensive property was sold for £340,000.00.
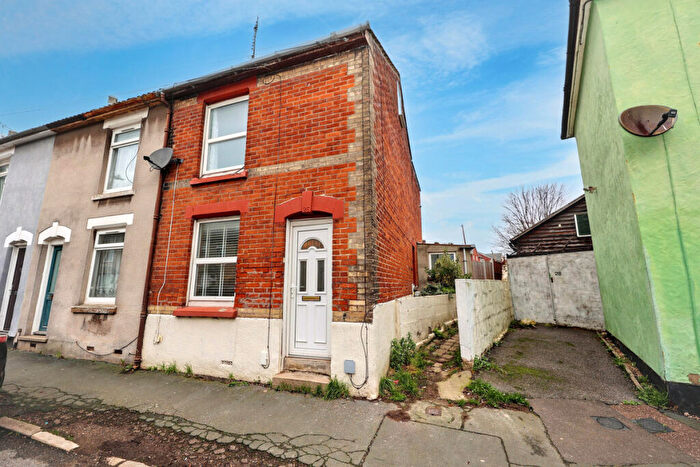
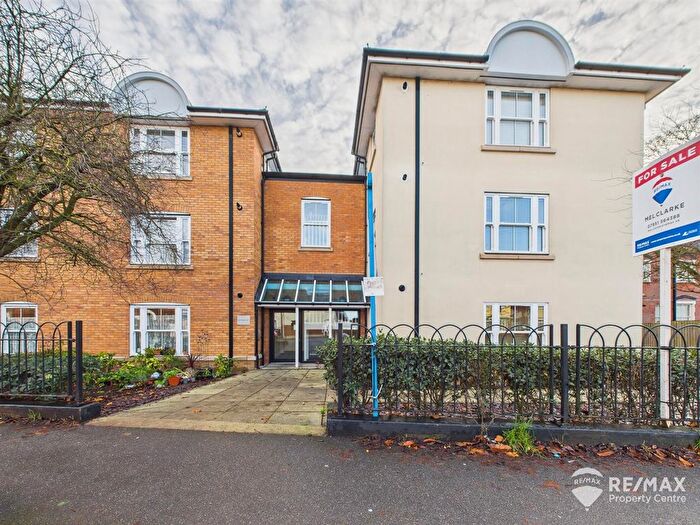
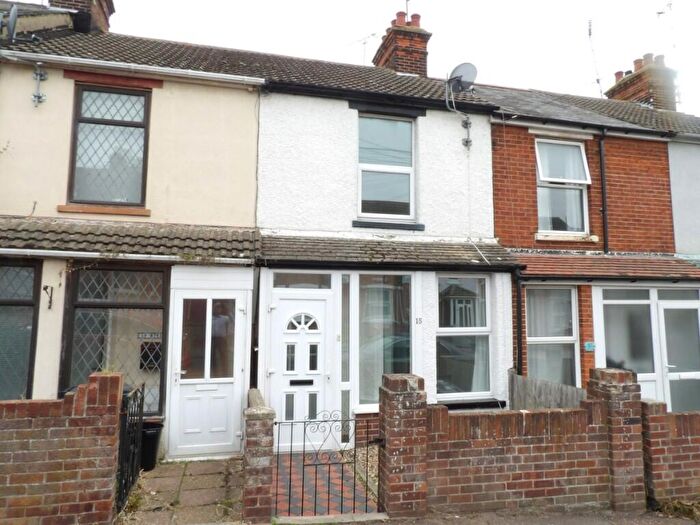
Properties for sale in Dovercourt All Saints
Roads and Postcodes in Dovercourt All Saints
Navigate through our locations to find the location of your next house in Dovercourt All Saints, Harwich for sale or to rent.
| Streets | Postcodes |
|---|---|
| All Saints Close | CO12 4FZ |
| Dovercourt Haven Caravan Park | CO12 3TZ |
| Earlhams Close | CO12 4XA |
| Fronks Gardens | CO12 4GB |
| Hall Lane | CO12 3TB |
| Howard Avenue | CO12 4UF |
| Kings Road | CO12 4DT |
| Lower Marine Parade | CO12 3ST |
| Main Road | CO12 4ER CO12 4EU CO12 4EX CO12 4FY CO12 4HJ CO12 4HW CO12 4HZ |
| Minerva Close | CO12 4XB |
| Rose Gardens | CO12 4FU |
| West End Lane | CO12 3FA |
| William Bleakey Mews | CO12 4FX |
| CO12 4GD |
Transport near Dovercourt All Saints
- FAQ
- Price Paid By Year
- Property Type Price
Frequently asked questions about Dovercourt All Saints
What is the average price for a property for sale in Dovercourt All Saints?
The average price for a property for sale in Dovercourt All Saints is £316,680. This amount is 28% higher than the average price in Harwich. There are 1,774 property listings for sale in Dovercourt All Saints.
Which train stations are available in or near Dovercourt All Saints?
Some of the train stations available in or near Dovercourt All Saints are Dovercourt, Harwich International and Harwich Town.
Property Price Paid in Dovercourt All Saints by Year
The average sold property price by year was:
| Year | Average Sold Price | Price Change |
Sold Properties
|
|---|---|---|---|
| 2025 | £297,500 | -12% |
2 Properties |
| 2023 | £332,500 | 3% |
2 Properties |
| 2022 | £323,400 | 11% |
1 Property |
| 2021 | £288,750 | -6% |
4 Properties |
| 2020 | £305,000 | -17% |
5 Properties |
| 2019 | £357,500 | 33% |
2 Properties |
| 2018 | £240,142 | 6% |
7 Properties |
| 2017 | £225,700 | 5% |
20 Properties |
| 2016 | £215,000 | -103% |
10 Properties |
| 2015 | £437,500 | 67% |
2 Properties |
| 2006 | £145,000 | 38% |
1 Property |
| 2003 | £90,000 | 47% |
1 Property |
| 1996 | £48,000 | - |
1 Property |
Property Price per Property Type in Dovercourt All Saints
Here you can find historic sold price data in order to help with your property search.
The average Property Paid Price for specific property types in the last three years are:
| Property Type | Average Sold Price | Sold Properties |
|---|---|---|
| Semi Detached House | £324,200.00 | 2 Semi Detached Houses |
| Detached House | £311,666.00 | 3 Detached Houses |

