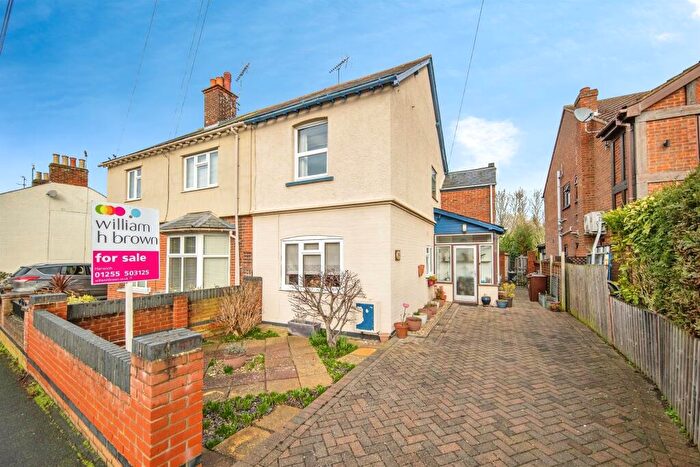
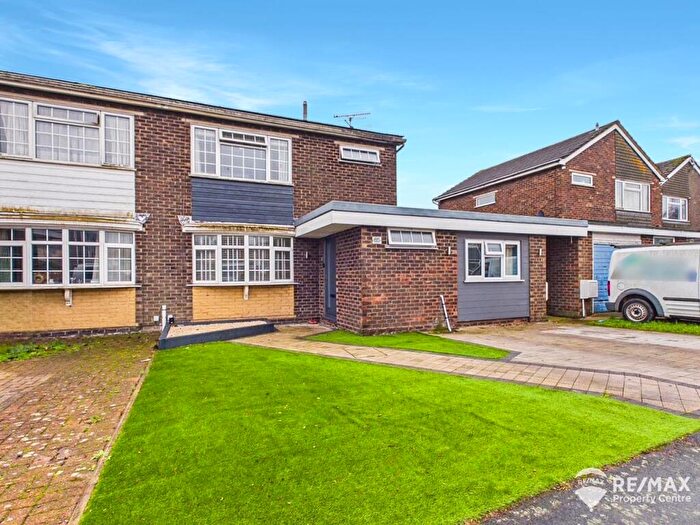
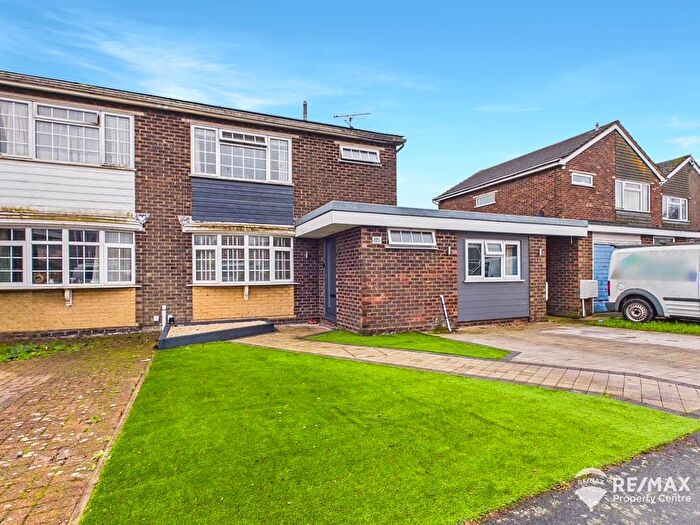
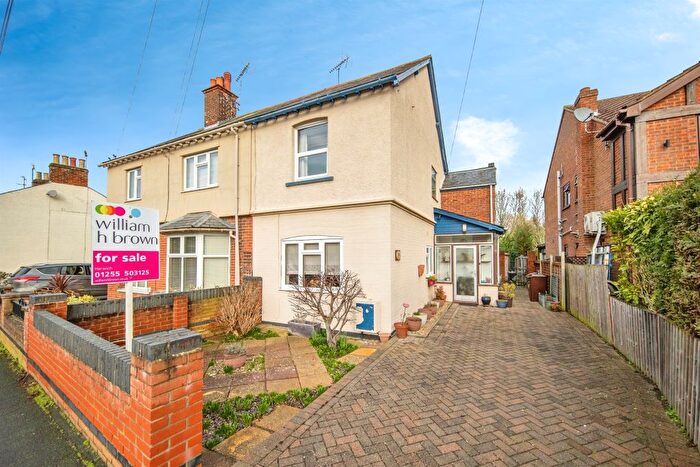
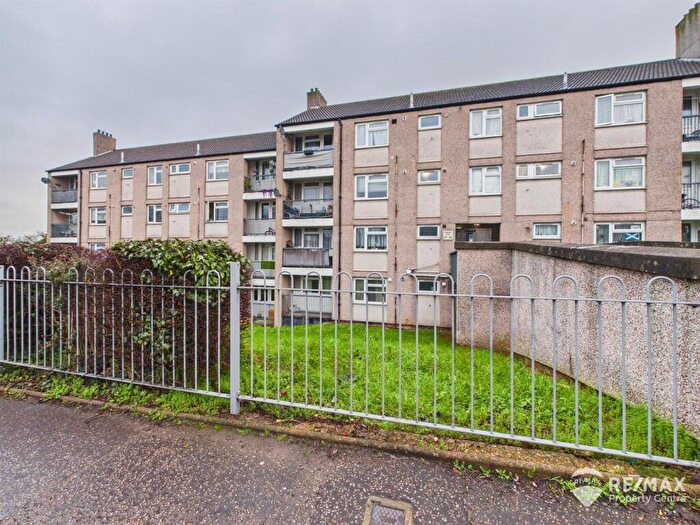
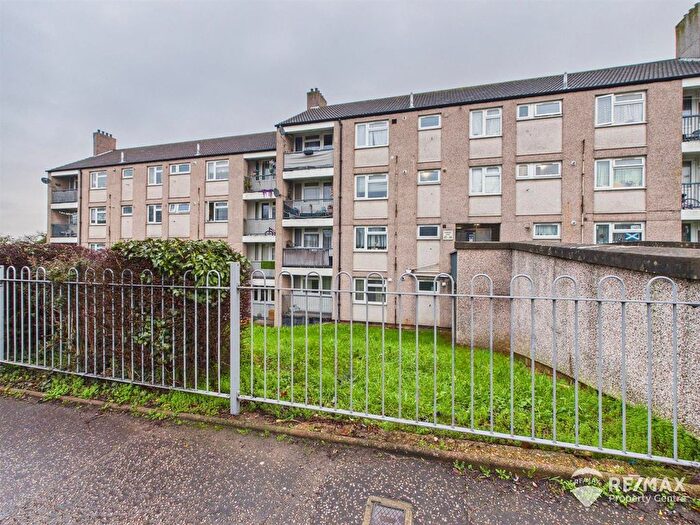
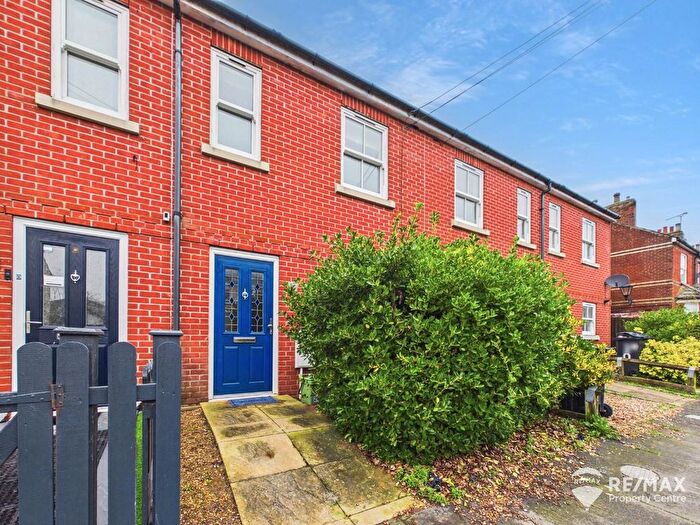
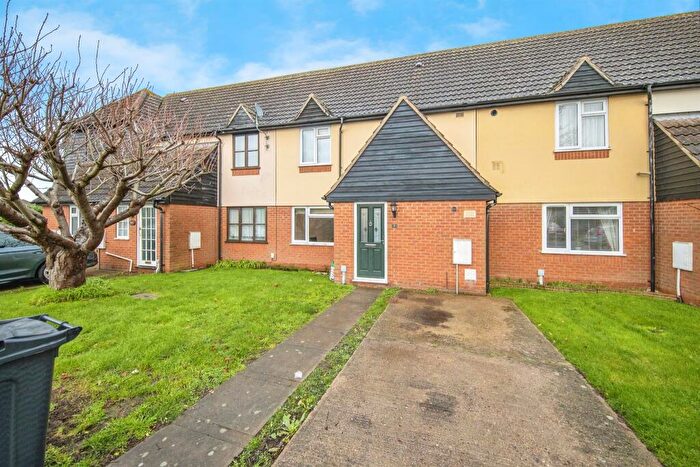
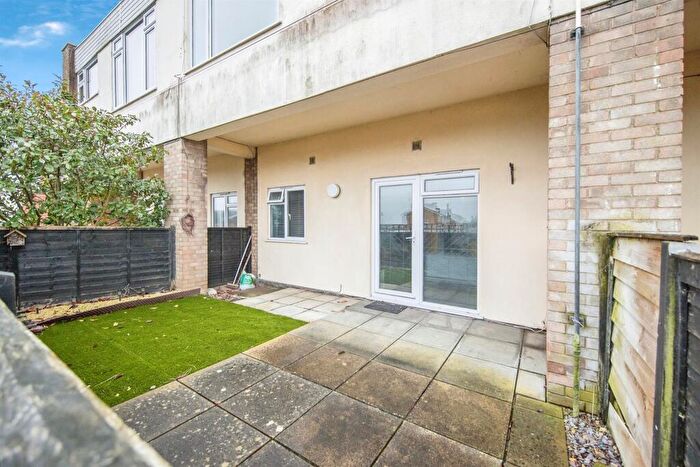
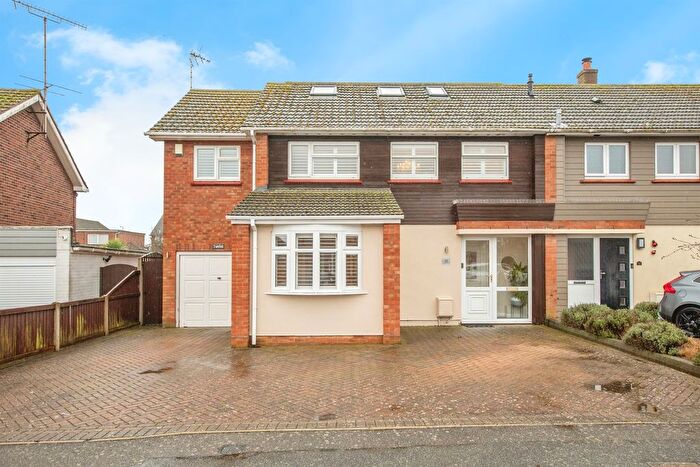
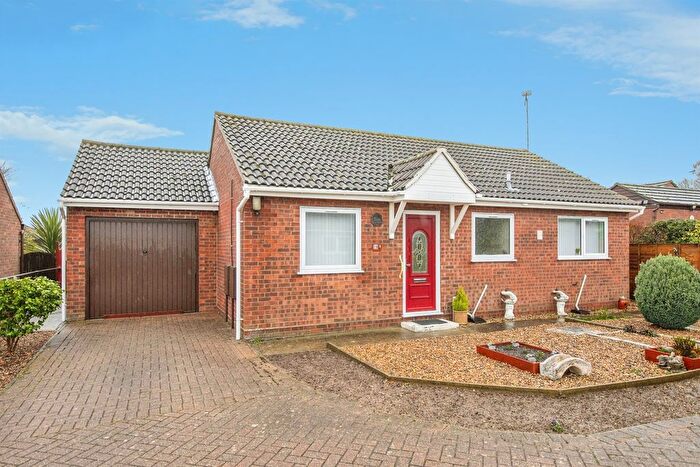
Houses for sale & to rent in Harwich West Central, Harwich
House Prices in Harwich West Central
Properties in Harwich West Central have an average house price of £247,828.00 and had 193 Property Transactions within the last 3 years¹.
Harwich West Central is an area in Harwich, Essex with 2,101 households², where the most expensive property was sold for £650,000.00.
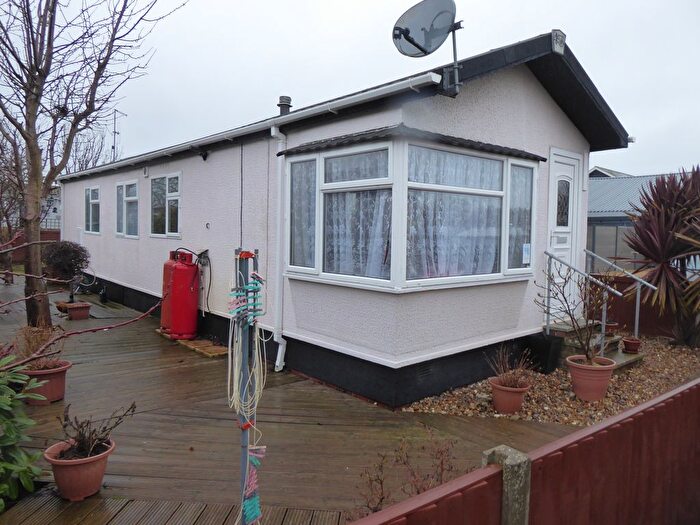
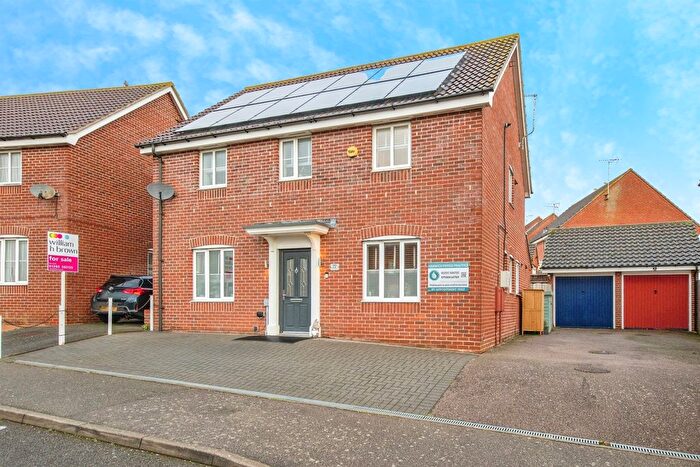
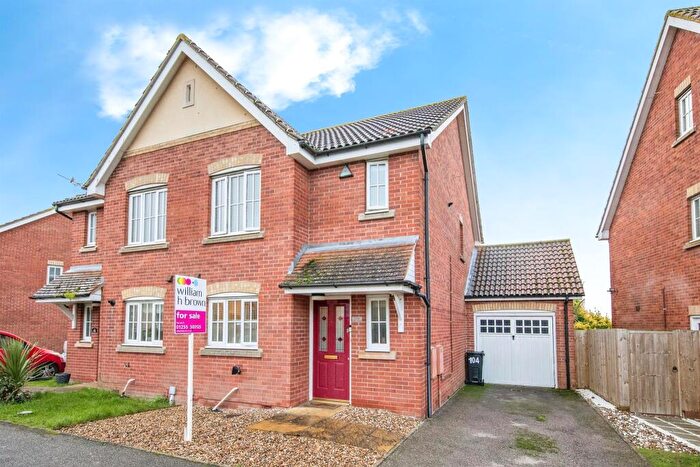
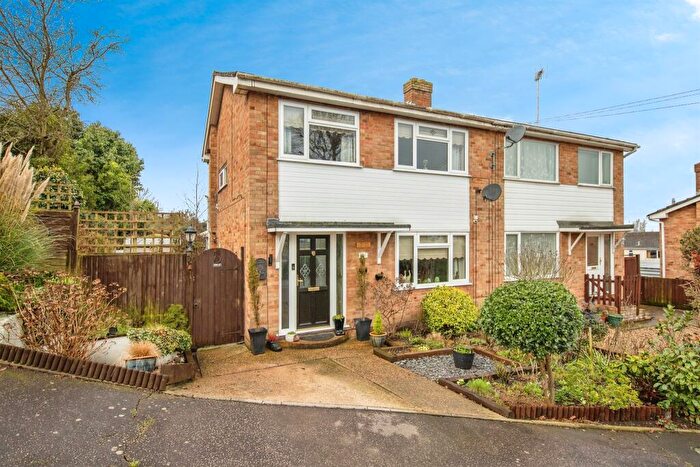
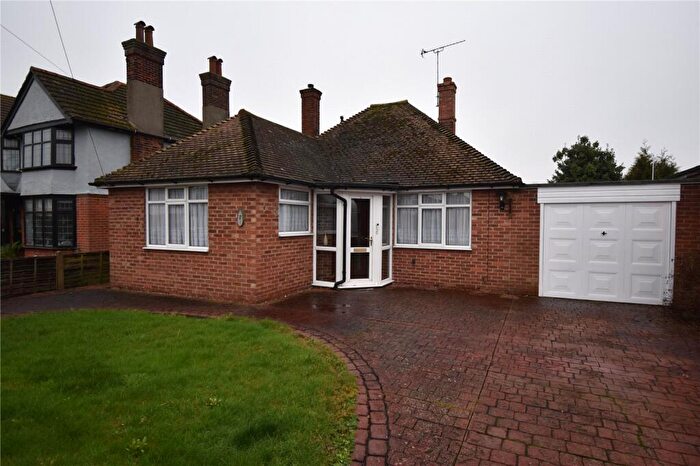
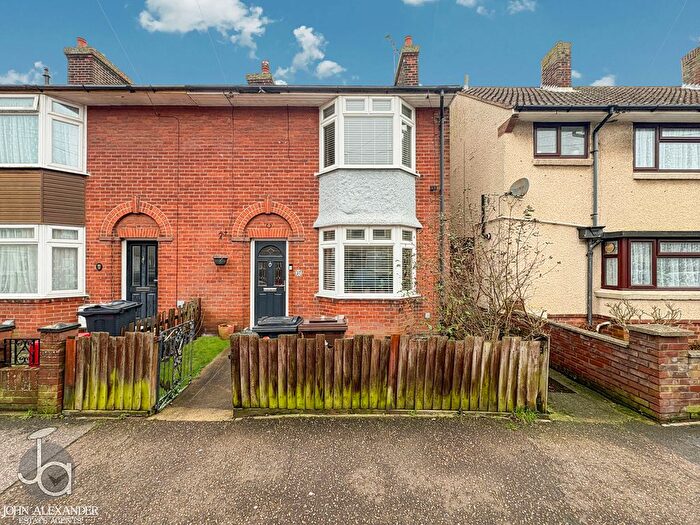
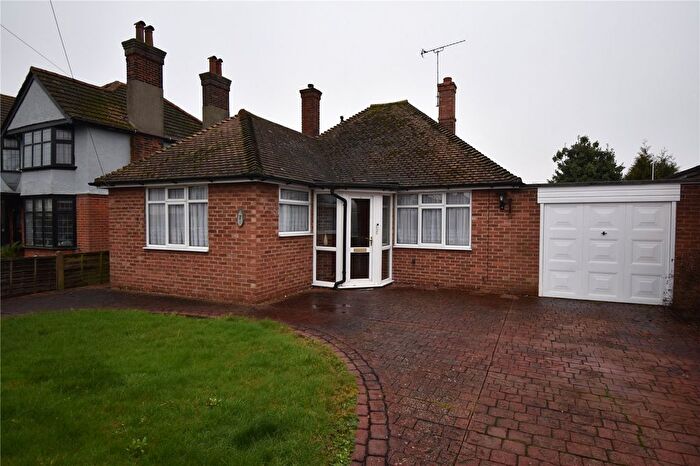
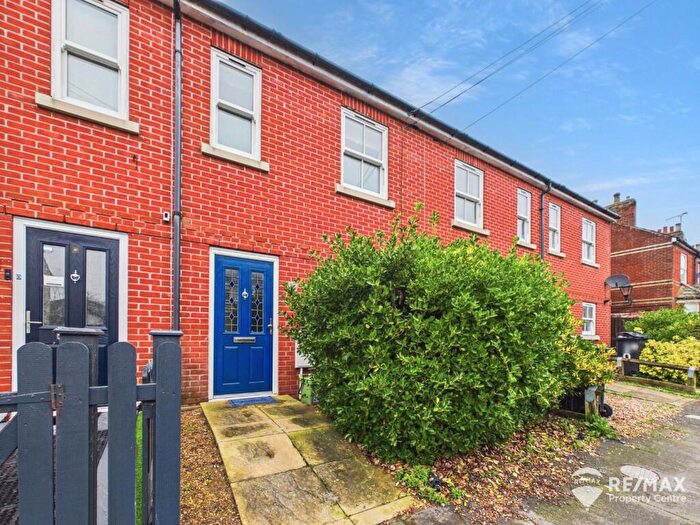
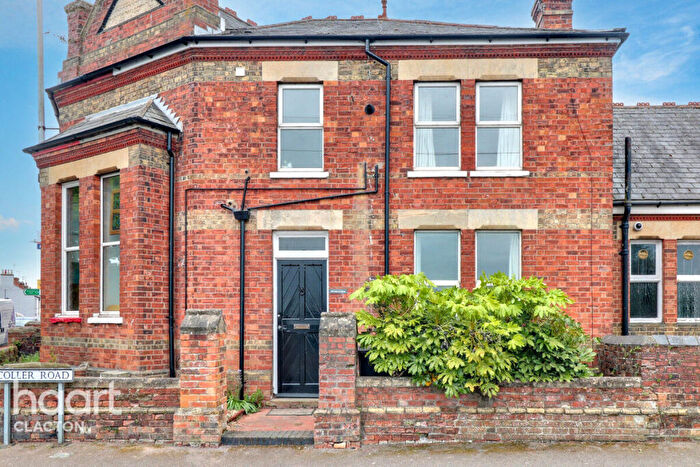
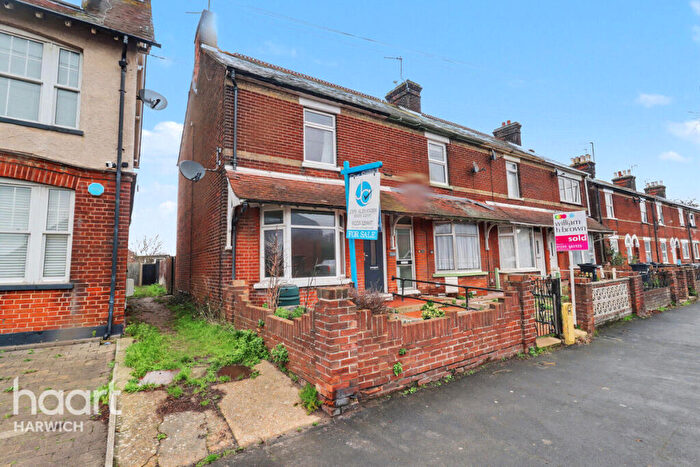
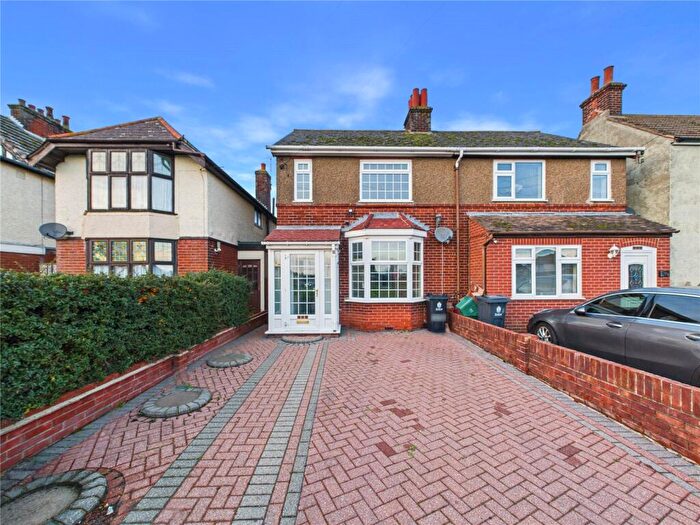
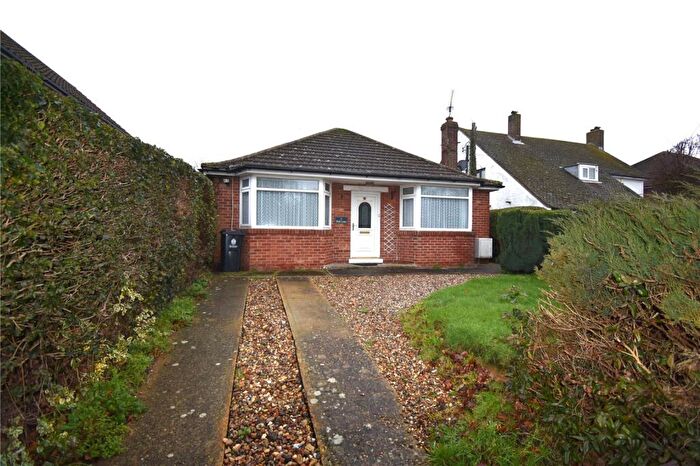
Properties for sale in Harwich West Central
Roads and Postcodes in Harwich West Central
Navigate through our locations to find the location of your next house in Harwich West Central, Harwich for sale or to rent.
| Streets | Postcodes |
|---|---|
| Allfields | CO12 4XS |
| Anson Close | CO12 4XT |
| Blacksmiths Lane | CO12 4HY |
| Blackthorn Road | CO12 4HX |
| Briardale Avenue | CO12 4LH |
| Bruges Close | CO12 3SN |
| Brussels Close | CO12 3SF |
| Clarkes Road | CO12 4JS CO12 4JX CO12 4JY CO12 4LL |
| Deanes Close | CO12 4JH |
| Deanes Court | CO12 4JN |
| Dockfield Avenue | CO12 4LE CO12 4LF |
| Elizabeth Road | CO12 4ED CO12 4EJ |
| Fallowfield Close | CO12 4LG |
| Fronks Road | CO12 4EE CO12 4EF CO12 4EG CO12 4JB CO12 4JE |
| Fryatt Avenue | CO12 4NR |
| Gordon Road | CO12 3TJ CO12 3TL CO12 3TN |
| Gordon Way | CO12 3TW |
| Grange Road | CO12 4JJ CO12 4JL |
| Hall Lane | CO12 3TD CO12 3TE CO12 3TG |
| Harcourt Avenue | CO12 4NT |
| Highfield Avenue | CO12 4DP CO12 4DR CO12 4JG |
| Jamestown Close | CO12 4FG |
| Kings Road | CO12 4DS |
| Kreswell Grove | CO12 3SZ |
| Laurel Avenue | CO12 4HP |
| Long Meadows | CO12 4UX |
| Louvain Road | CO12 3SD |
| Low Road | CO12 3TR |
| Main Road | CO12 4DD CO12 4DW CO12 4ET CO12 4HB CO12 4HH CO12 4HS CO12 4HT CO12 4JP CO12 4LN CO12 4LS CO12 4LW |
| Manor Lane | CO12 4DH CO12 4EA CO12 4EB |
| Manor Road | CO12 4DU CO12 4DX CO12 4DY |
| Newton Road | CO12 4JD |
| Northsea View | CO12 4NA |
| Norway Crescent | CO12 4JT CO12 4LD |
| Oulton Close | CO12 4LQ |
| Parkeston Road | CO12 4HA CO12 4HE CO12 4HF CO12 4HG CO12 4NU CO12 4NX |
| Pound Farm Drive | CO12 4JZ CO12 4LB |
| Queens Road | CO12 3TH |
| Rebecca Close | CO12 4EZ |
| Richmond Crescent | CO12 3TP |
| Rose Bank | CO12 4HD |
| Seafield Road | CO12 4EH |
| St Denis Close | CO12 3SX |
| St Edmunds Close | CO12 3SW |
| Sweden Close | CO12 4JU |
| The Close | CO12 4NS |
| The Drive | CO12 3SP CO12 3SU |
| The Green | CO12 4NJ |
| The Haven | CO12 4LA |
| Vienna Close | CO12 3SL |
| Washington Road | CO12 4XX |
| Wick Lane | CO12 3TA |
| William Groom Avenue | CO12 4XU |
| Williamsburg Avenue | CO12 4FE CO12 4FF |
| Willow Way | CO12 4HR |
| Yorktown Close | CO12 4FH |
Transport near Harwich West Central
- FAQ
- Price Paid By Year
- Property Type Price
Frequently asked questions about Harwich West Central
What is the average price for a property for sale in Harwich West Central?
The average price for a property for sale in Harwich West Central is £247,828. This amount is 0.35% higher than the average price in Harwich. There are 1,762 property listings for sale in Harwich West Central.
What streets have the most expensive properties for sale in Harwich West Central?
The streets with the most expensive properties for sale in Harwich West Central are Seafield Road at an average of £475,000, Low Road at an average of £447,500 and Kreswell Grove at an average of £430,000.
What streets have the most affordable properties for sale in Harwich West Central?
The streets with the most affordable properties for sale in Harwich West Central are Elizabeth Road at an average of £98,000, Willow Way at an average of £142,500 and Main Road at an average of £161,550.
Which train stations are available in or near Harwich West Central?
Some of the train stations available in or near Harwich West Central are Dovercourt, Harwich International and Harwich Town.
Property Price Paid in Harwich West Central by Year
The average sold property price by year was:
| Year | Average Sold Price | Price Change |
Sold Properties
|
|---|---|---|---|
| 2025 | £279,745 | 17% |
55 Properties |
| 2024 | £232,789 | -3% |
86 Properties |
| 2023 | £238,942 | -8% |
52 Properties |
| 2022 | £258,274 | 15% |
100 Properties |
| 2021 | £219,032 | 4% |
99 Properties |
| 2020 | £209,595 | -4% |
71 Properties |
| 2019 | £217,823 | 14% |
71 Properties |
| 2018 | £187,402 | -3% |
103 Properties |
| 2017 | £192,615 | 11% |
102 Properties |
| 2016 | £171,935 | 2% |
110 Properties |
| 2015 | £168,817 | 3% |
96 Properties |
| 2014 | £163,389 | 10% |
101 Properties |
| 2013 | £147,274 | 2% |
78 Properties |
| 2012 | £144,990 | -5% |
54 Properties |
| 2011 | £151,698 | -2% |
75 Properties |
| 2010 | £154,529 | 12% |
72 Properties |
| 2009 | £135,443 | -14% |
98 Properties |
| 2008 | £154,681 | -2% |
55 Properties |
| 2007 | £157,077 | -4% |
93 Properties |
| 2006 | £163,156 | 15% |
116 Properties |
| 2005 | £139,406 | 3% |
79 Properties |
| 2004 | £135,675 | 11% |
110 Properties |
| 2003 | £120,501 | 20% |
97 Properties |
| 2002 | £95,996 | 18% |
121 Properties |
| 2001 | £78,344 | 8% |
113 Properties |
| 2000 | £72,333 | 7% |
128 Properties |
| 1999 | £67,198 | 17% |
151 Properties |
| 1998 | £55,733 | 6% |
136 Properties |
| 1997 | £52,223 | 9% |
122 Properties |
| 1996 | £47,766 | 17% |
97 Properties |
| 1995 | £39,604 | - |
53 Properties |
Property Price per Property Type in Harwich West Central
Here you can find historic sold price data in order to help with your property search.
The average Property Paid Price for specific property types in the last three years are:
| Property Type | Average Sold Price | Sold Properties |
|---|---|---|
| Semi Detached House | £237,007.00 | 56 Semi Detached Houses |
| Detached House | £352,057.00 | 61 Detached Houses |
| Terraced House | £192,048.00 | 52 Terraced Houses |
| Flat | £129,020.00 | 24 Flats |

