
Houses for sale in Harwich, Essex
House Prices in Harwich
Properties in Harwich have an average house price of £245k and had 999 Property Transactions within the last 3 years.¹
Harwich is an area in Essex with 10,445 households², where the most expensive property was sold for £925k.
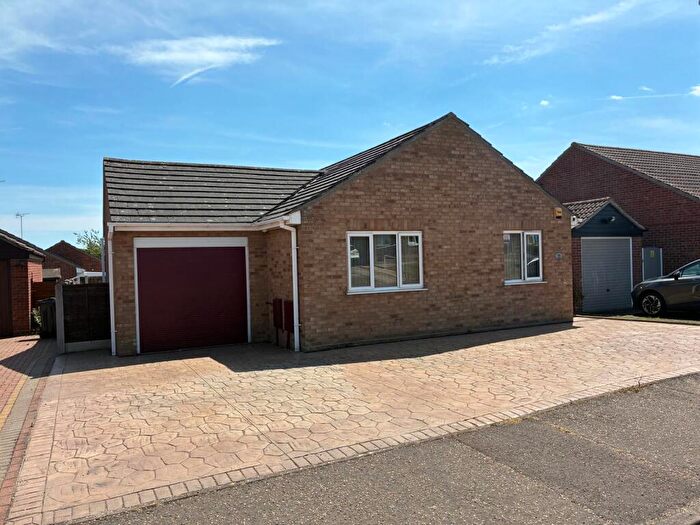
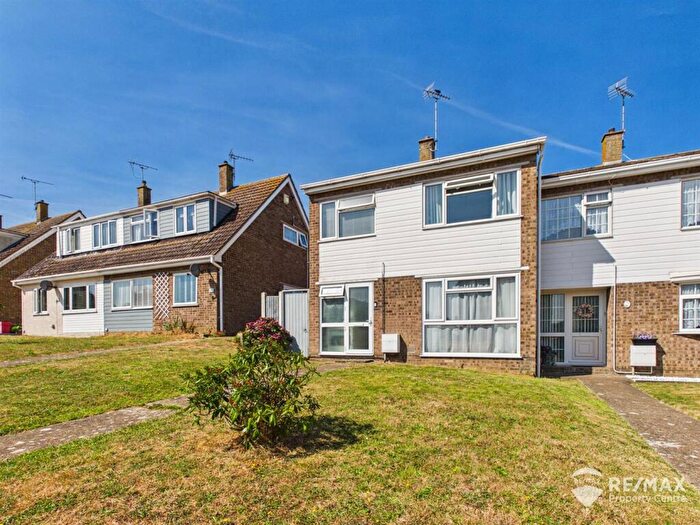
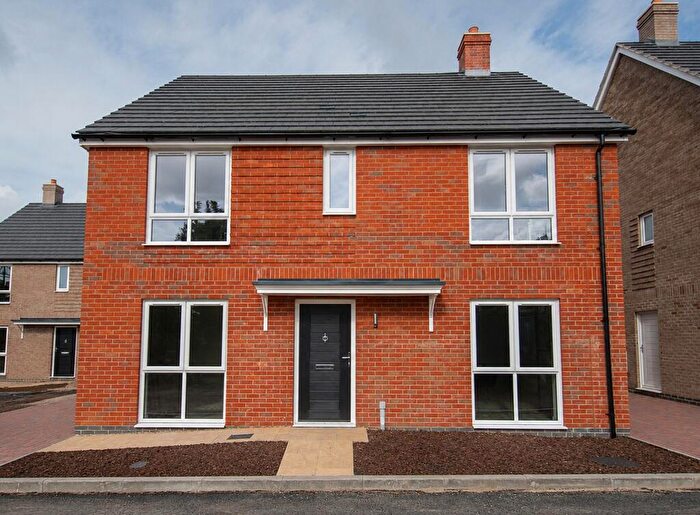
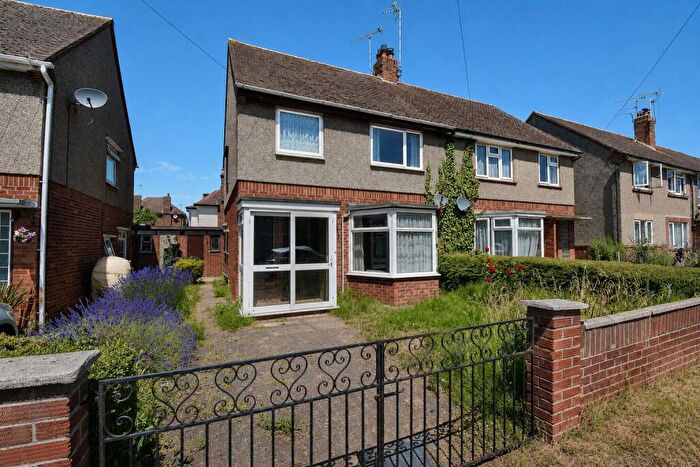
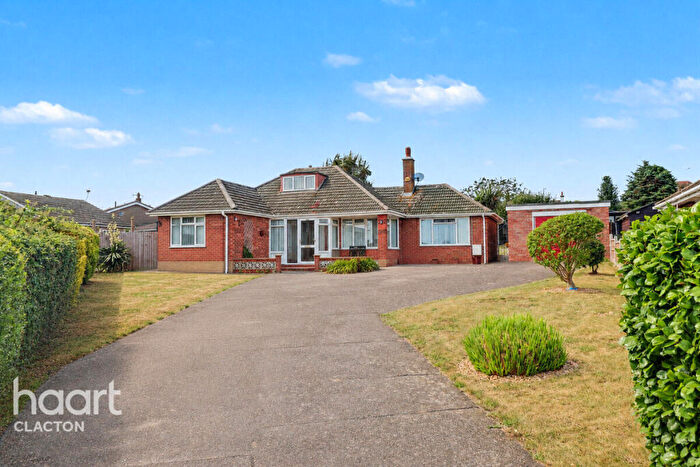
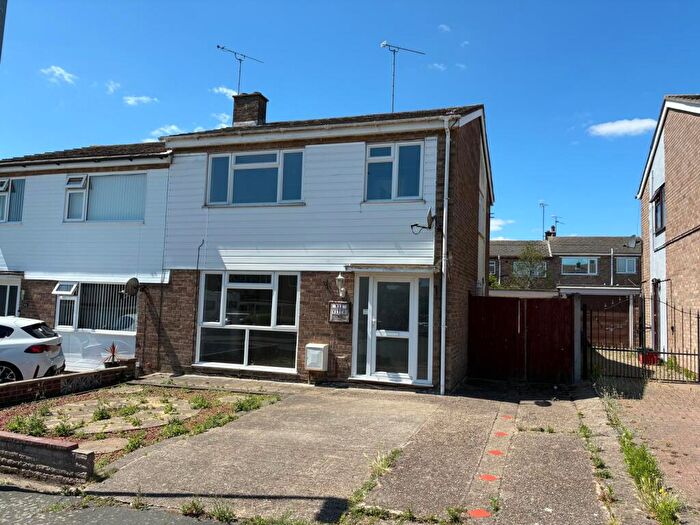
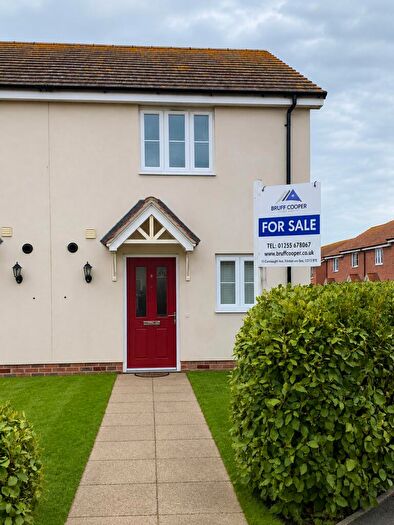
Properties for sale in Harwich
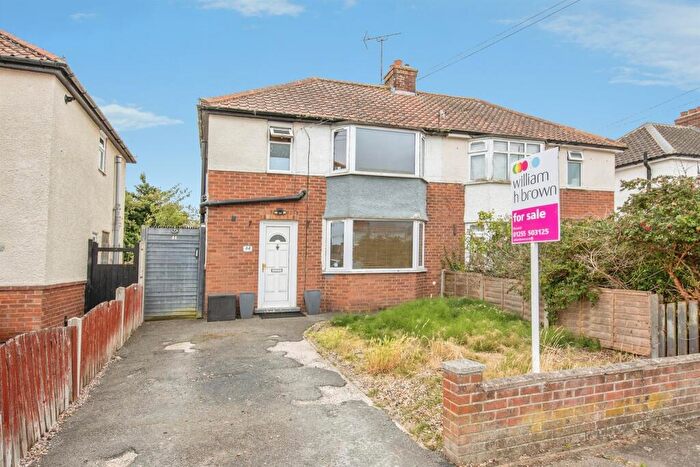
![]()
If you are looking to sell your house, let it out, or receive a property valuation, an expert can help you.
Click the button below to get started.


Neighbourhoods in Harwich
Navigate through our locations to find the location of your next house in Harwich, Essex for sale or to rent.
- Beaumont And Thorpe
- Bradfield, Wrabness And Wix
- Great And Little Oakley
- Harwich East
- Harwich East Central
- Harwich West
- Harwich West Central
- Ramsey And Parkeston
- Harwich & Kingsway
- Dovercourt All Saints
- Dovercourt Bay
- Dovercourt Vines & Parkeston
- Dovercourt Tollgate
- The Oakleys & Wix
- Thorpe, Beaumont & Great Holland
- Stour Valley
Property price trends in Harwich
According to the latest Land Registry data, the average home in Harwich sold for £225,687 in 2026. That figure comes from a substantial record of 14,333 sales logged over the past 31 years.
Prices have softened over the last three years. Compared with 2023, when the typical sale came in around £236,661, that's a fall of roughly 4.6%.
Looking back five years, average prices are down about 4.1% since 2021, a drop of around £9,630 in cash terms.
Zoom out to the past decade for the fuller picture. Back in 2016, homes here averaged £174,025, so the typical sold price has climbed about 29.7% since then, roughly 2.6% a year. Stretch the view to fifteen years and that annual pace edges up closer to 3%.
Frequently asked questions about Harwich
What is the average price for a property for sale in Harwich?
The average price for a property for sale in Harwich is £245,083. This amount is 40% lower than the average price in Essex. There are 7,006 property listings for sale in Harwich.
What locations have the most expensive properties for sale in Harwich?
The locations with the most expensive properties for sale in Harwich are Stour Valley at an average of £535,000, Great And Little Oakley at an average of £323,812 and Dovercourt All Saints at an average of £315,000.
What locations have the most affordable properties for sale in Harwich?
The locations with the most affordable properties for sale in Harwich are Harwich East at an average of £175,021, Harwich & Kingsway at an average of £190,500 and Harwich East Central at an average of £224,079.
Which train stations are available in or near Harwich?
Some of the train stations available in or near Harwich are Harwich International, Dovercourt and Harwich Town.
Property Price Paid in Harwich by Year
The average sold property price by year was:
| Year | Average Sold Price | Price Change |
Sold Properties
|
|---|---|---|---|
| 2026 | £225,687 | -11% |
24 Properties |
| 2025 | £249,803 | 0,1% |
306 Properties |
| 2024 | £249,450 | 5% |
364 Properties |
| 2023 | £236,661 | -7% |
305 Properties |
| 2022 | £253,593 | 7% |
466 Properties |
| 2021 | £235,317 | 8% |
520 Properties |
| 2020 | £216,582 | 5% |
343 Properties |
| 2019 | £206,179 | -3% |
378 Properties |
| 2018 | £211,860 | 5% |
453 Properties |
| 2017 | £201,241 | 14% |
495 Properties |
Property Price per Property Type in Harwich
Here you can find historic sold price data in order to help with your property search.
The average Property Paid Price for specific property types in the last three years are:
| Property Type | Average Sold Price | Sold Properties |
|---|---|---|
| Semi Detached House | £246,294.00 | 288 Semi Detached Houses |
| Detached House | £350,199.00 | 280 Detached Houses |
| Terraced House | £193,329.00 | 318 Terraced Houses |
| Flat | £127,172.00 | 113 Flats |
Transport in Harwich
Please see below transportation links in this area:
