Houses for sale & to rent in Harwich West, Harwich
House Prices in Harwich West
Properties in Harwich West have an average house price of £267,657.00 and had 201 Property Transactions within the last 3 years¹.
Harwich West is an area in Harwich, Essex with 2,154 households², where the most expensive property was sold for £670,000.00.
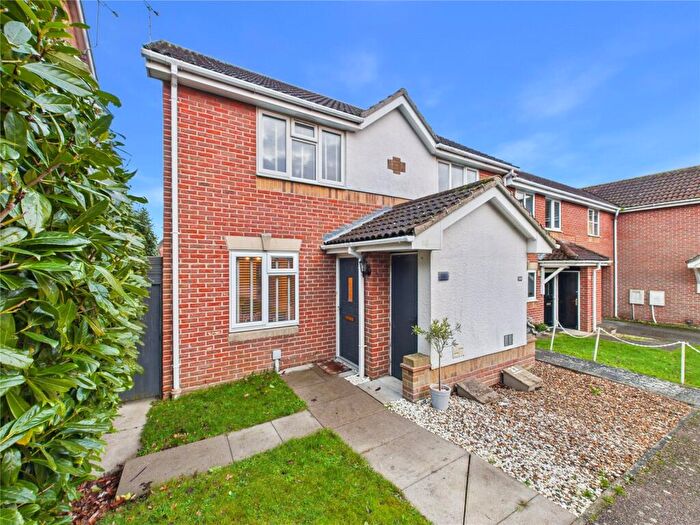
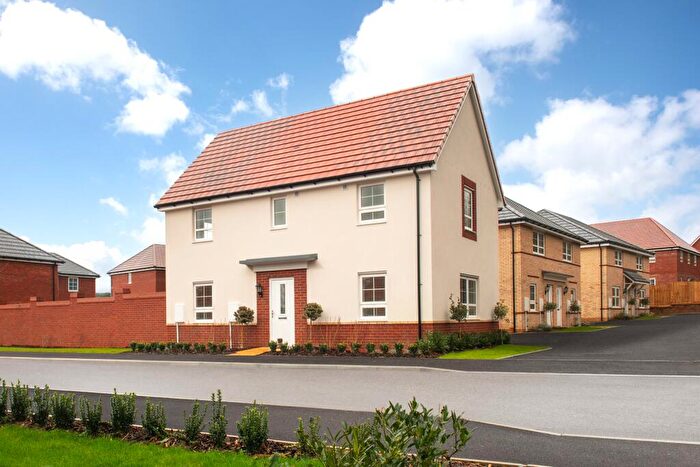
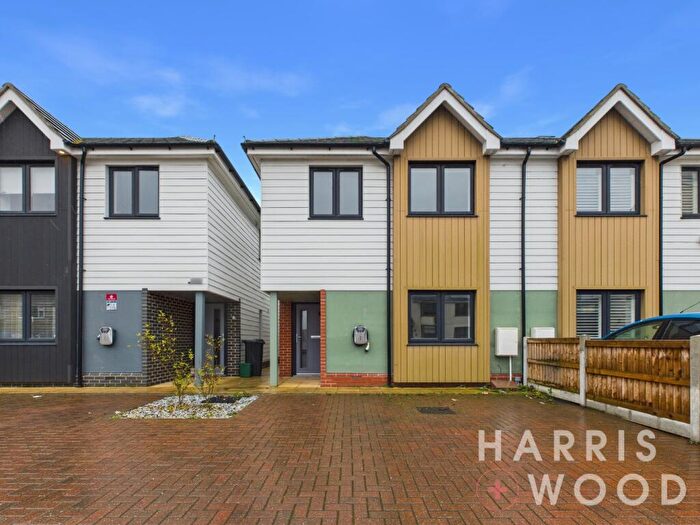
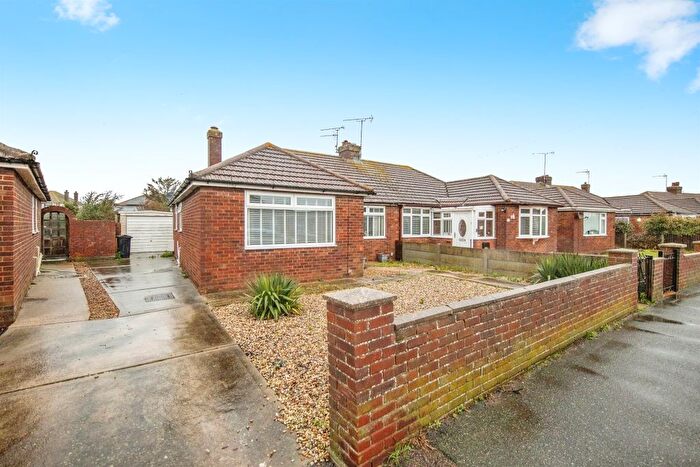
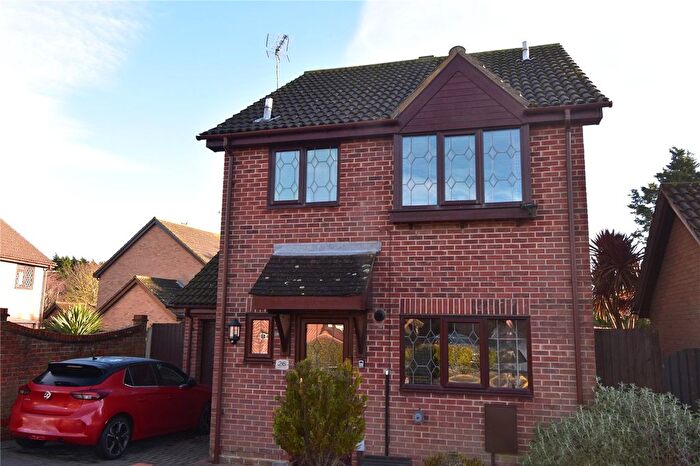
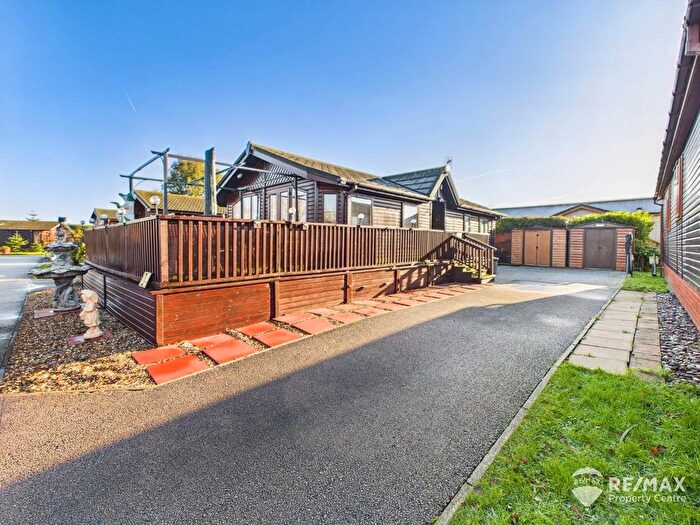
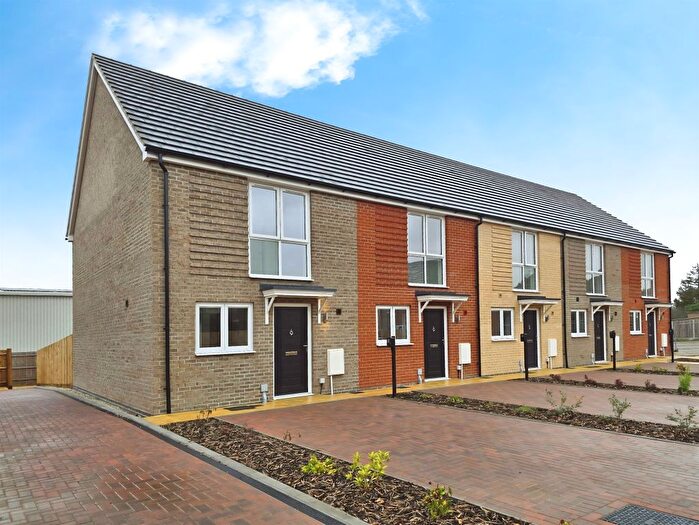
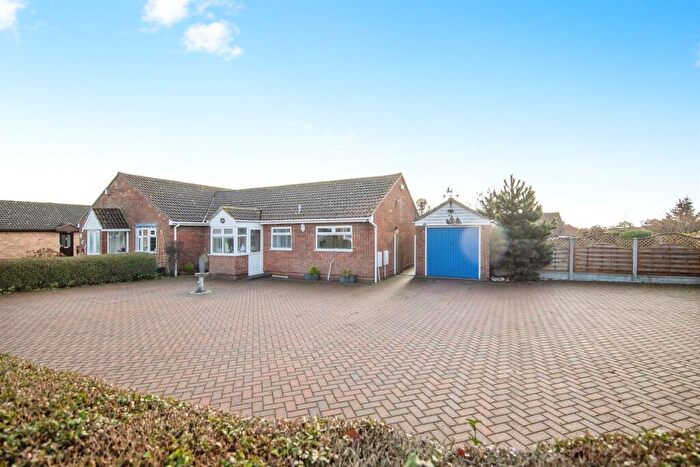
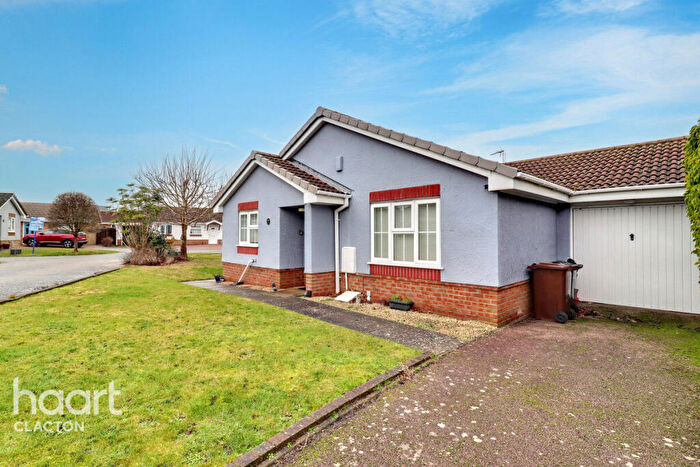
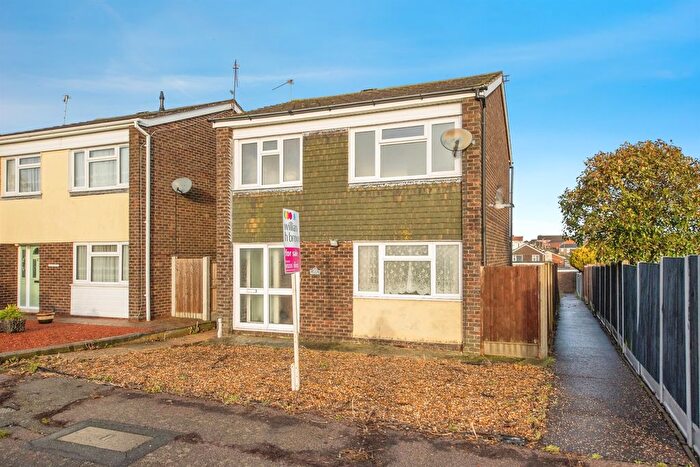
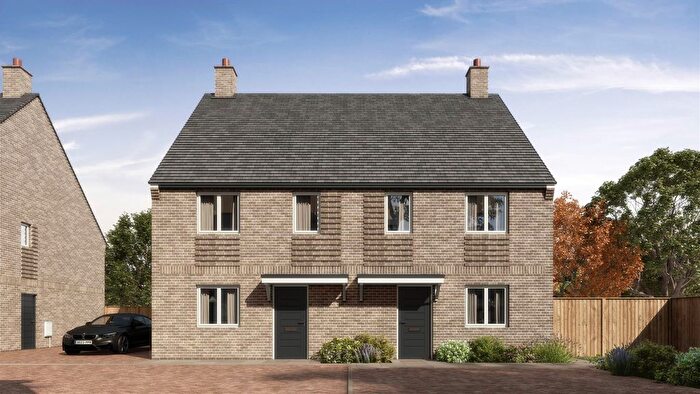
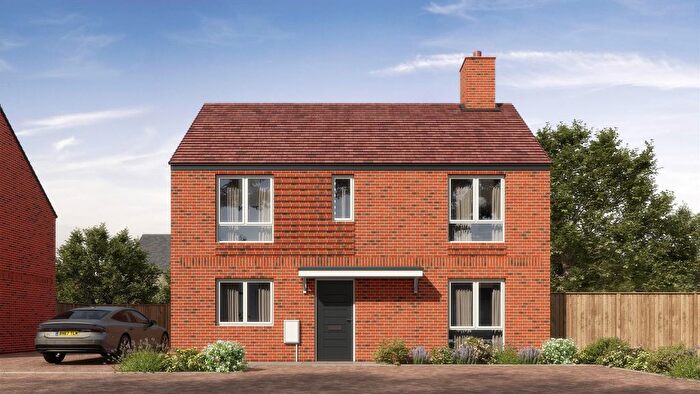
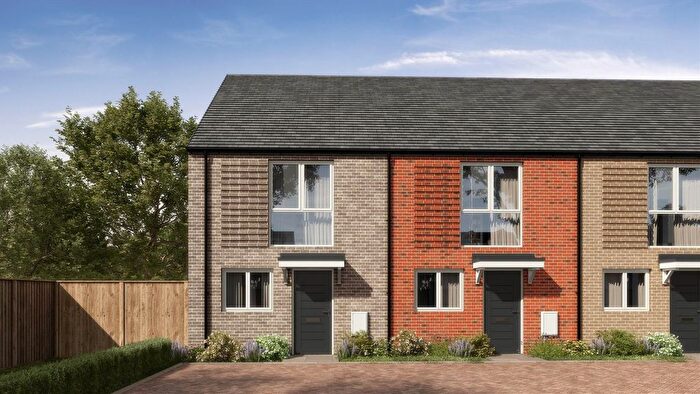
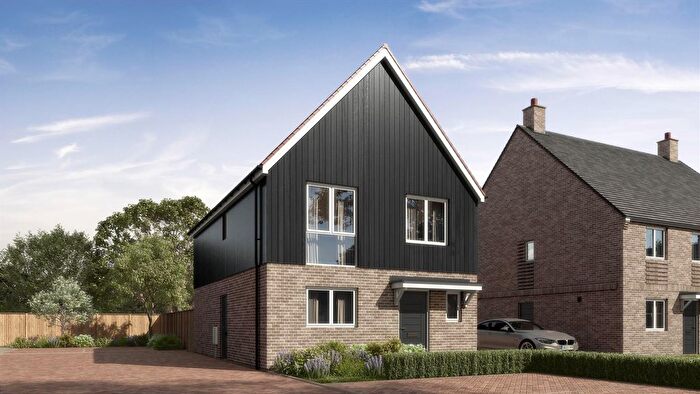
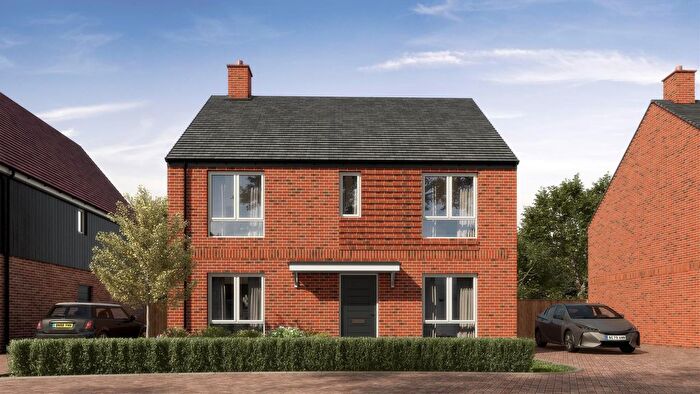
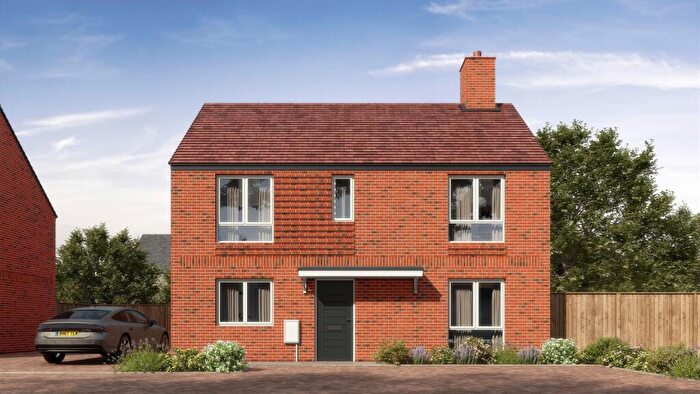
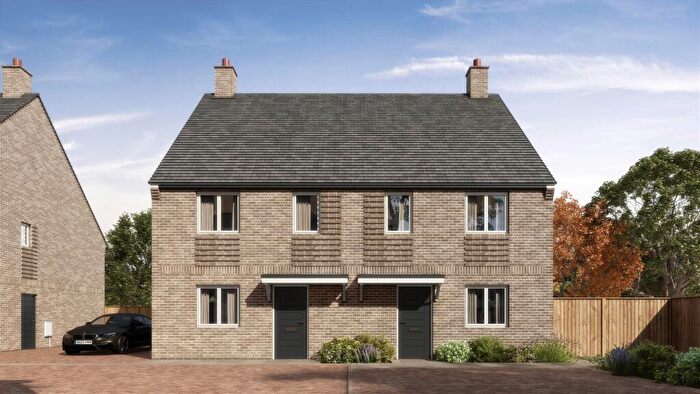
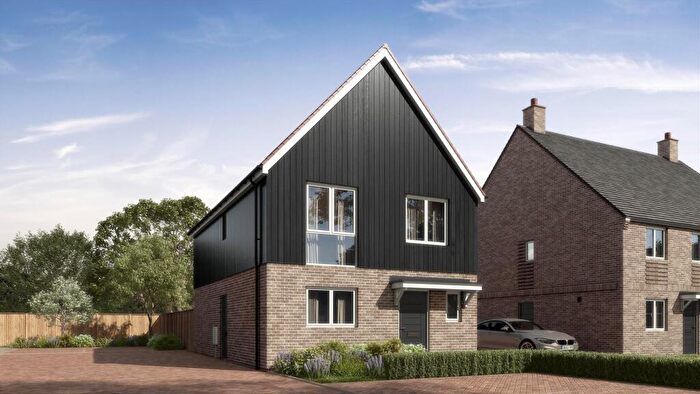
Properties for sale in Harwich West
Roads and Postcodes in Harwich West
Navigate through our locations to find the location of your next house in Harwich West, Harwich for sale or to rent.
| Streets | Postcodes |
|---|---|
| Abbott Road | CO12 4UU CO12 4UY |
| Abdy Avenue | CO12 4QP |
| Acorn Close | CO12 4XF |
| Ainger Road | CO12 4TR CO12 4TS |
| Aldon Close | CO12 5HF |
| Arderne Close | CO12 4UJ |
| Artillery Drive | CO12 5FG |
| Balton Way | CO12 4UP |
| Beryl Road | CO12 4RE CO12 4RF CO12 4RG |
| Bexley Avenue | CO12 4XW |
| Bramble Tye | CO12 5DQ |
| Brookmans Farm Cottages | CO12 3TT |
| Bullfinch Close | CO12 4WH |
| Chaffinch Drive | CO12 4WL |
| Chase Lane | CO12 4NB |
| Cook Close | CO12 3UE |
| De Vere Way | CO12 4UD |
| Devon Way | CO12 4RA CO12 4RB |
| Dove Crescent | CO12 4QX CO12 4QY CO12 4RD |
| Dove House Cottages | CO12 5DR |
| Eves Court | CO12 4RH |
| Freshfields | CO12 4XG |
| Frobisher Road | CO12 3UF |
| Goodlake Close | CO12 4UG |
| Gravel Hill Way | CO12 4UN CO12 4XN CO12 4XR |
| Hankin Avenue | CO12 5HE |
| Hazelville Close | CO12 3TQ |
| Holyrood | CO12 4TX CO12 4TY CO12 4TZ CO12 4UH |
| Howard Avenue | CO12 4UE |
| Hudson Close | CO12 4XJ |
| Jubilee Close | CO12 4XD |
| Keynes Way | CO12 3UA |
| Kilmaine Road | CO12 4UZ |
| Kingfisher Drive | CO12 4WE |
| Litchfield | CO12 4TT |
| Little Oaks | CO12 3UH |
| Long Meadows | CO12 4TU CO12 4UL CO12 4US |
| Low Road | CO12 3TS CO12 3TX CO12 4WP |
| Magpie Close | CO12 4WG |
| Main Road | CO12 4LT CO12 4LU CO12 4LZ CO12 4NF CO12 4NH |
| Military Way | CO12 5FD |
| Musgrave Close | CO12 3UJ |
| Newport Close | CO12 4XL |
| Nightingale Close | CO12 3UB |
| Oakley Road | CO12 4QR CO12 4QS CO12 4QT CO12 4QU CO12 4QZ CO12 5DN CO12 5DS |
| Oakview | CO12 4UW |
| Oxenford Close | CO12 4UT |
| Parade Drive | CO12 5FB |
| Pelham Close | CO12 4UR |
| Ramsey Road | CO12 4RJ CO12 4RL CO12 4RN CO12 4RZ |
| Rebow Road | CO12 4XE |
| Regimental Way | CO12 5FE |
| Rowlands Yard | CO12 4ND |
| Shackleton Close | CO12 3UD |
| Stour Close | CO12 4TL |
| Swallow Close | CO12 4WF |
| The Dales | CO12 4XH |
| Valley Road | CO12 4RP CO12 4RS CO12 4RU |
| Vaux Avenue | CO12 4XP |
| Warham Road | CO12 4UQ |
| Whinfield Avenue | CO12 3UL |
| Witch Elm | CO12 4UA CO12 4UB |
Transport near Harwich West
- FAQ
- Price Paid By Year
- Property Type Price
Frequently asked questions about Harwich West
What is the average price for a property for sale in Harwich West?
The average price for a property for sale in Harwich West is £267,657. This amount is 9% higher than the average price in Harwich. There are 1,371 property listings for sale in Harwich West.
What streets have the most expensive properties for sale in Harwich West?
The streets with the most expensive properties for sale in Harwich West are Hazelville Close at an average of £420,000, Artillery Drive at an average of £368,519 and Oakley Road at an average of £347,590.
What streets have the most affordable properties for sale in Harwich West?
The streets with the most affordable properties for sale in Harwich West are Rowlands Yard at an average of £175,500, Bexley Avenue at an average of £182,000 and Gravel Hill Way at an average of £206,219.
Which train stations are available in or near Harwich West?
Some of the train stations available in or near Harwich West are Harwich International, Dovercourt and Harwich Town.
Property Price Paid in Harwich West by Year
The average sold property price by year was:
| Year | Average Sold Price | Price Change |
Sold Properties
|
|---|---|---|---|
| 2025 | £247,067 | -13% |
52 Properties |
| 2024 | £278,965 | 3% |
82 Properties |
| 2023 | £269,797 | -1% |
67 Properties |
| 2022 | £273,026 | 6% |
95 Properties |
| 2021 | £256,938 | 13% |
108 Properties |
| 2020 | £222,500 | 3% |
76 Properties |
| 2019 | £215,603 | -2% |
70 Properties |
| 2018 | £220,234 | 3% |
108 Properties |
| 2017 | £212,598 | 13% |
101 Properties |
| 2016 | £185,684 | 9% |
95 Properties |
| 2015 | £169,881 | 4% |
93 Properties |
| 2014 | £162,371 | 5% |
108 Properties |
| 2013 | £153,737 | 0,4% |
101 Properties |
| 2012 | £153,188 | 2% |
69 Properties |
| 2011 | £150,307 | -4% |
67 Properties |
| 2010 | £156,996 | 4% |
66 Properties |
| 2009 | £150,942 | -12% |
75 Properties |
| 2008 | £168,870 | -7% |
62 Properties |
| 2007 | £180,928 | 6% |
118 Properties |
| 2006 | £169,568 | 3% |
141 Properties |
| 2005 | £164,556 | 6% |
94 Properties |
| 2004 | £154,770 | 12% |
143 Properties |
| 2003 | £135,945 | 11% |
119 Properties |
| 2002 | £121,426 | 16% |
220 Properties |
| 2001 | £102,350 | 21% |
266 Properties |
| 2000 | £80,591 | 21% |
168 Properties |
| 1999 | £63,962 | 16% |
115 Properties |
| 1998 | £53,863 | 7% |
118 Properties |
| 1997 | £49,877 | 3% |
105 Properties |
| 1996 | £48,368 | 3% |
109 Properties |
| 1995 | £46,989 | - |
105 Properties |
Property Price per Property Type in Harwich West
Here you can find historic sold price data in order to help with your property search.
The average Property Paid Price for specific property types in the last three years are:
| Property Type | Average Sold Price | Sold Properties |
|---|---|---|
| Semi Detached House | £248,261.00 | 77 Semi Detached Houses |
| Detached House | £304,383.00 | 91 Detached Houses |
| Terraced House | £221,433.00 | 30 Terraced Houses |
| Flat | £113,666.00 | 3 Flats |

