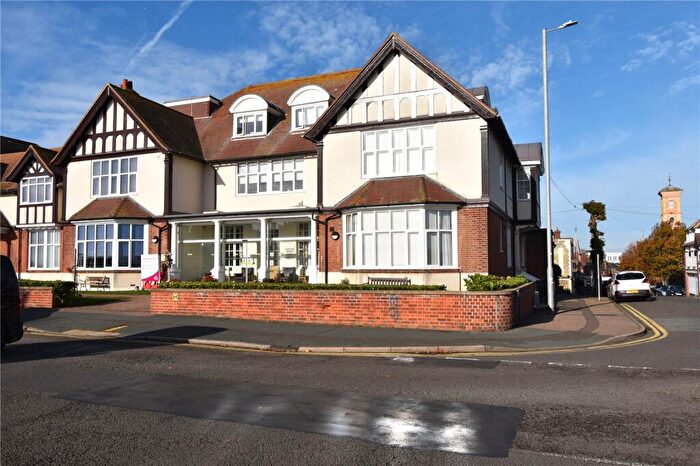
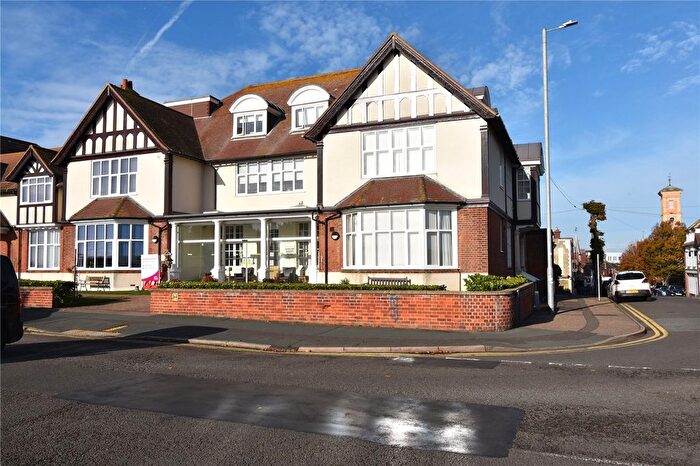
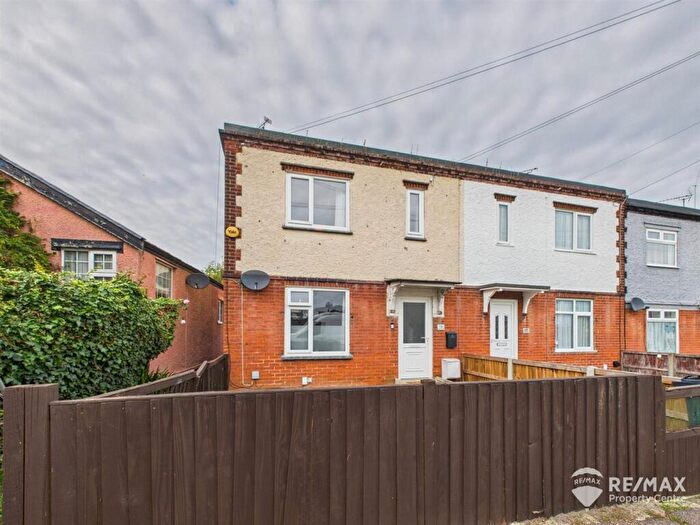
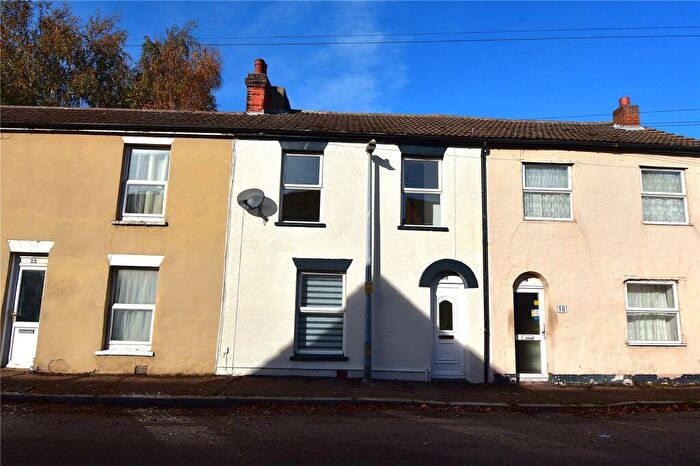
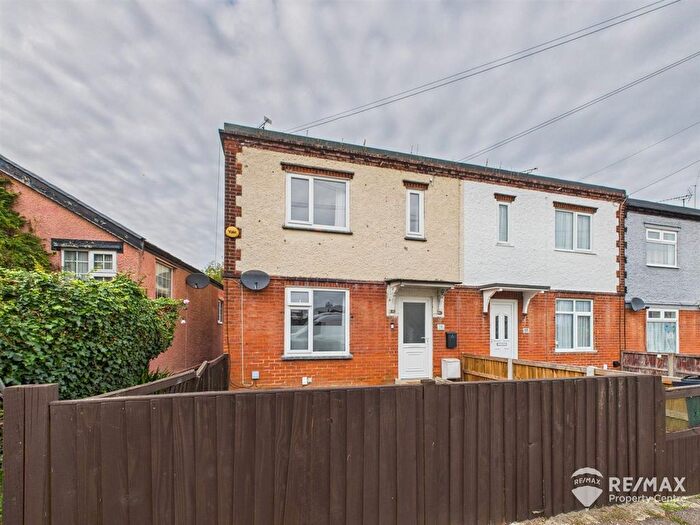
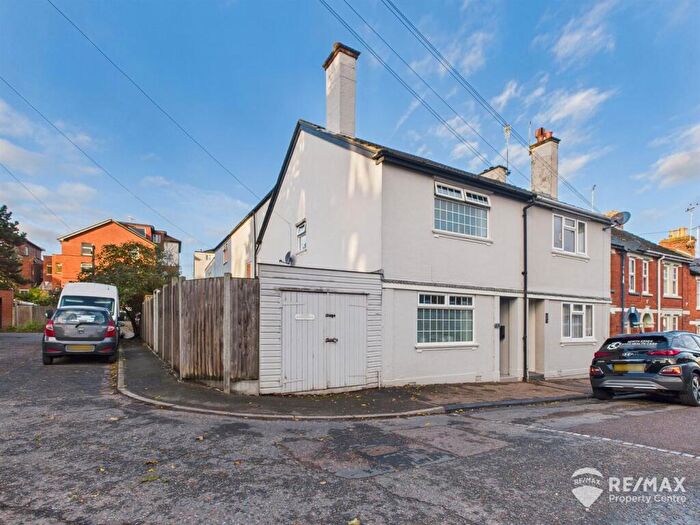
Houses for sale & to rent in Harwich East, Harwich
House Prices in Harwich East
Properties in Harwich East have an average house price of £178,949.00 and had 191 Property Transactions within the last 3 years¹.
Harwich East is an area in Harwich, Essex with 1,244 households², where the most expensive property was sold for £440,000.00.
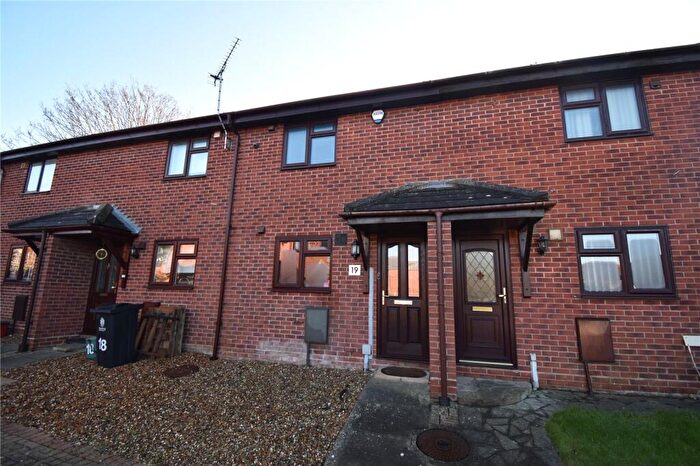
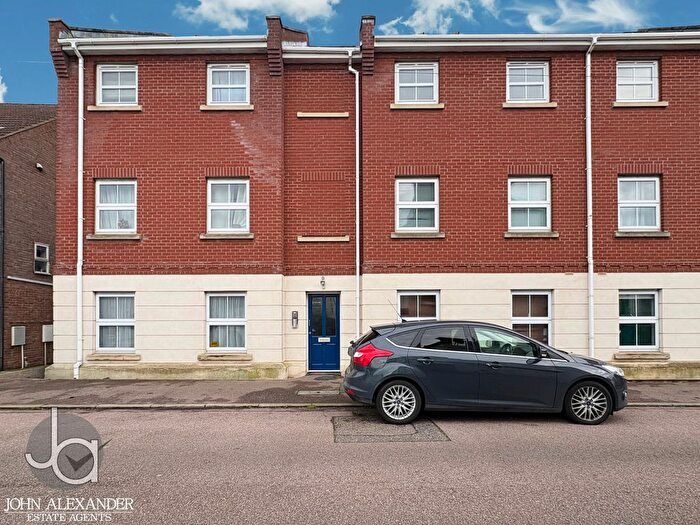
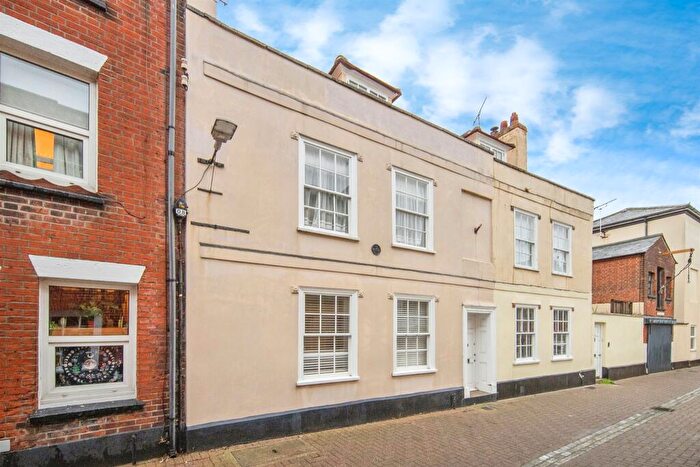
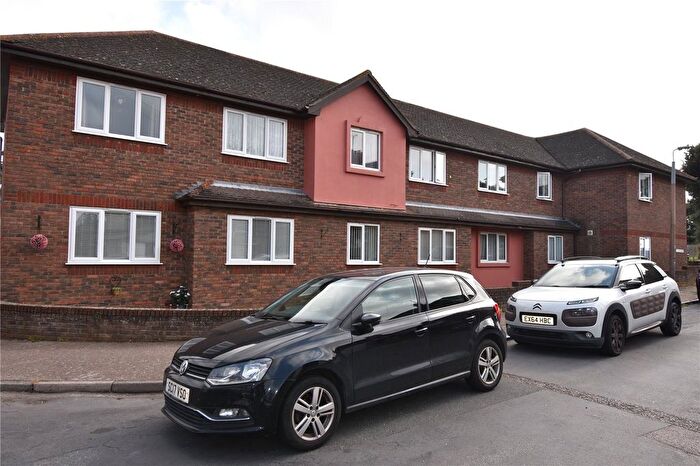
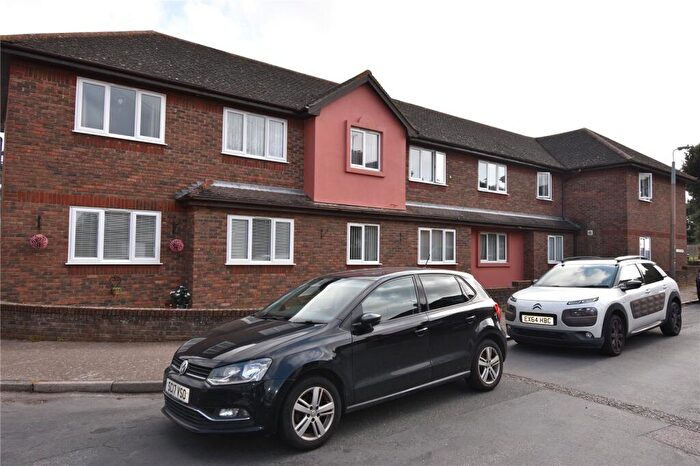
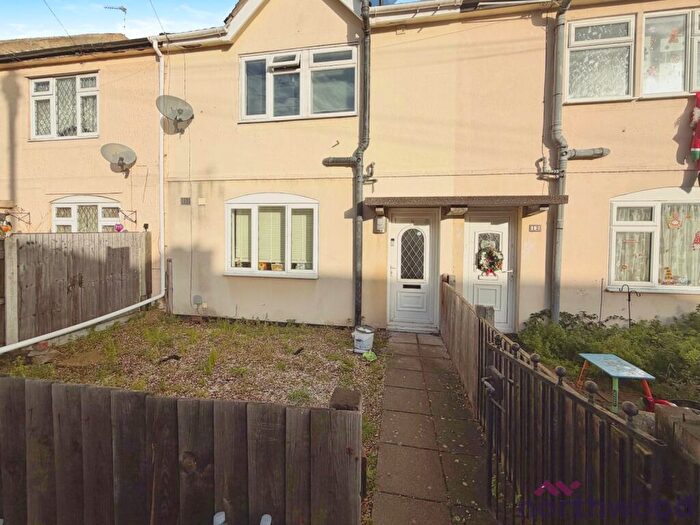
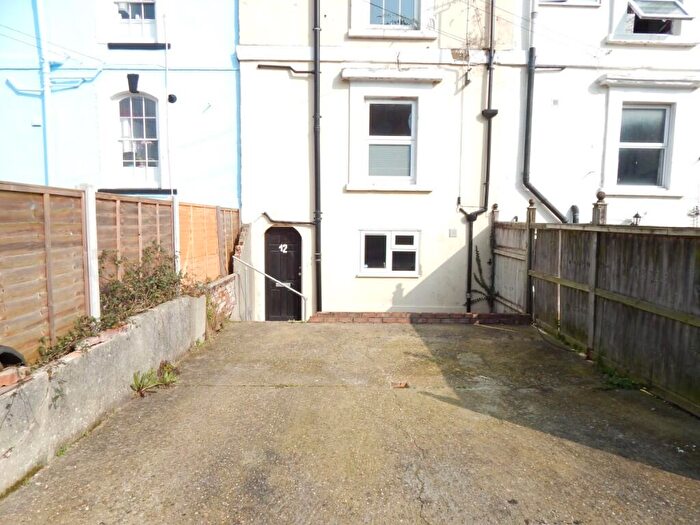
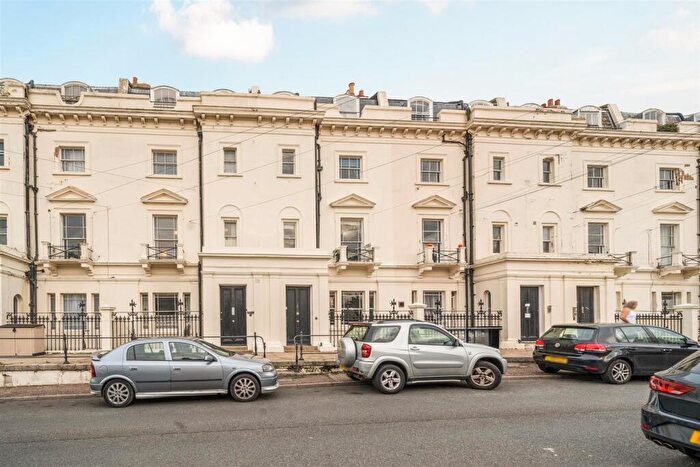
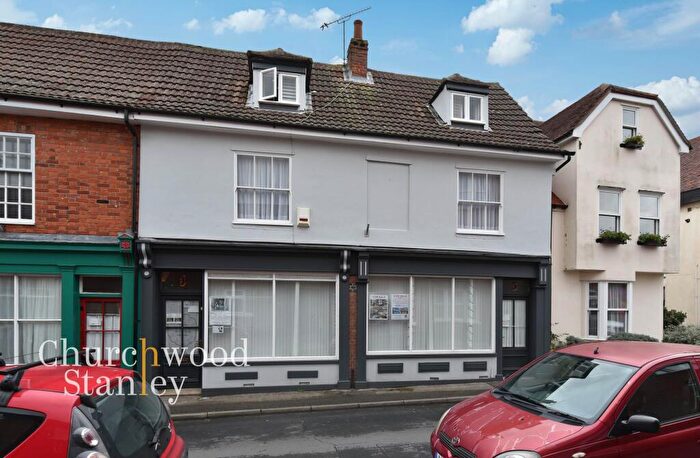
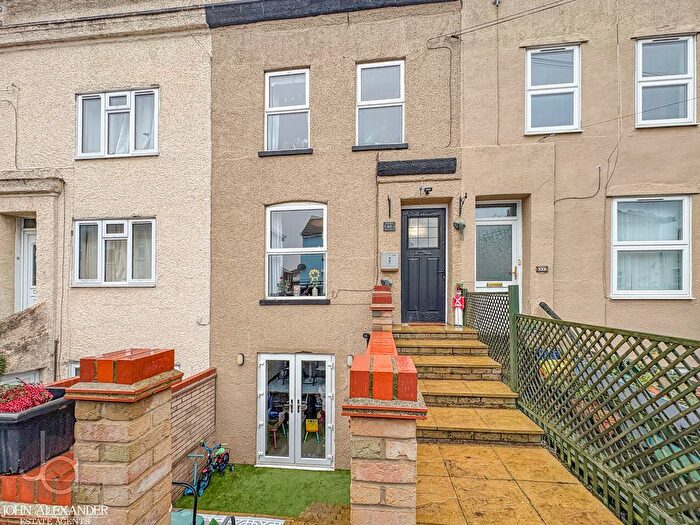
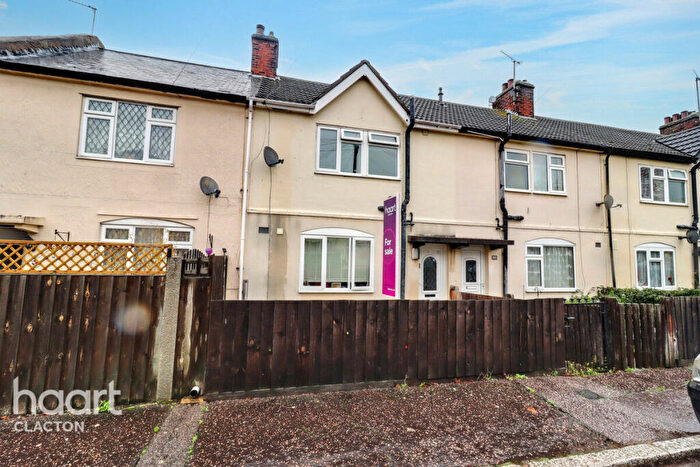
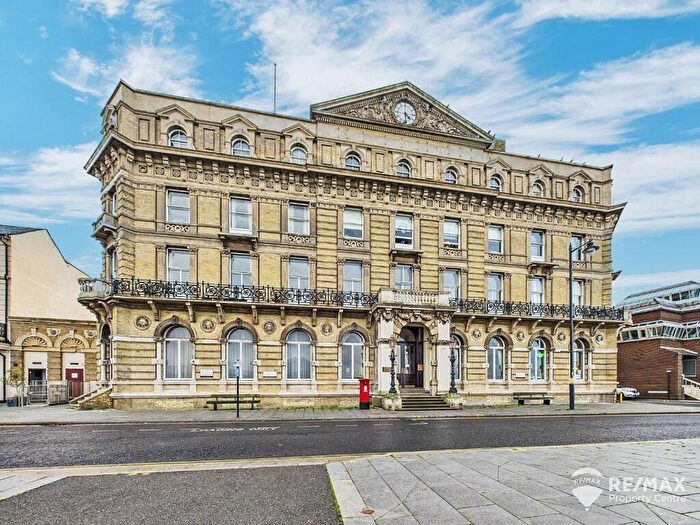
Properties for sale in Harwich East
Roads and Postcodes in Harwich East
Navigate through our locations to find the location of your next house in Harwich East, Harwich for sale or to rent.
| Streets | Postcodes |
|---|---|
| Albemarle Street | CO12 3HL CO12 3HN CO12 3HW |
| Albert Street | CO12 3HU CO12 3HX CO12 3HY |
| Alexandra Road | CO12 3BS |
| Alexandra Street | CO12 3JE CO12 3JF |
| Angel Gate | CO12 3EJ |
| Barrack Lane | CO12 3NP |
| Beacon Hill Avenue | CO12 3NR |
| Canning Street | CO12 3JB |
| Castlegate Street | CO12 3HA |
| Church Street | CO12 3DR CO12 3DS CO12 3EA |
| Coke Street | CO12 3HP |
| Currents Lane | CO12 3DE |
| Eastgate Street | CO12 3EZ |
| Ferndale Road | CO12 3BP |
| Fernlea Road | CO12 3BN CO12 3BW |
| George Street | CO12 3ND |
| Golden Lion Lane | CO12 3NG |
| Grafton Road | CO12 3BB CO12 3BD |
| Gwynne Road | CO12 3BG CO12 3BQ |
| Harbour Crescent | CO12 3NJ CO12 3NL |
| High Street | CO12 3LG |
| Ingestre Street | CO12 3JA CO12 3JG |
| Kings Head Street | CO12 3EE CO12 3EF CO12 3EG |
| Kings Quay Street | CO12 3ER CO12 3ES CO12 3EU |
| Little Church Street | CO12 3ED |
| Main Road | CO12 3DF CO12 3LH CO12 3LJ CO12 3LP CO12 3LR CO12 3LS CO12 3LU CO12 3LZ CO12 3NY |
| Maria Street | CO12 3HT |
| Market Street | CO12 3DX CO12 3DY |
| Mayflower Avenue | CO12 3NN CO12 3NW |
| Old Customs Houses | CO12 3DG |
| Outpart Eastward | CO12 3EN |
| Park Road | CO12 3BJ |
| Park Terrace | CO12 3BH |
| Pepys Street | CO12 3HG |
| Rose Cottages | CO12 3HQ |
| St Austins Lane | CO12 3EX |
| St Helens Green | CO12 3NH |
| Station Road | CO12 3LX CO12 3LY |
| Stour Road | CO12 3GS CO12 3HF CO12 3HR CO12 3HS CO12 3JD |
| Talbot Street | CO12 3JQ |
| The Quay | CO12 3HH |
| Vansittart Street | CO12 3HZ |
| Wellington Road | CO12 3DJ CO12 3DL CO12 3DT |
| West Street | CO12 3DA CO12 3DB CO12 3DD CO12 3DQ |
| White Hart Lane | CO12 3NE |
Transport near Harwich East
- FAQ
- Price Paid By Year
- Property Type Price
Frequently asked questions about Harwich East
What is the average price for a property for sale in Harwich East?
The average price for a property for sale in Harwich East is £178,949. This amount is 28% lower than the average price in Harwich. There are 802 property listings for sale in Harwich East.
What streets have the most expensive properties for sale in Harwich East?
The streets with the most expensive properties for sale in Harwich East are Barrack Lane at an average of £384,166, St Helens Green at an average of £285,000 and Eastgate Street at an average of £282,333.
What streets have the most affordable properties for sale in Harwich East?
The streets with the most affordable properties for sale in Harwich East are Stour Road at an average of £103,562, Wellington Road at an average of £108,125 and The Quay at an average of £117,590.
Which train stations are available in or near Harwich East?
Some of the train stations available in or near Harwich East are Harwich Town, Dovercourt and Harwich International.
Property Price Paid in Harwich East by Year
The average sold property price by year was:
| Year | Average Sold Price | Price Change |
Sold Properties
|
|---|---|---|---|
| 2025 | £205,770 | 17% |
27 Properties |
| 2024 | £170,333 | 5% |
45 Properties |
| 2023 | £162,510 | -14% |
48 Properties |
| 2022 | £185,323 | 3% |
71 Properties |
| 2021 | £179,766 | 7% |
62 Properties |
| 2020 | £166,895 | 12% |
31 Properties |
| 2019 | £147,073 | -4% |
61 Properties |
| 2018 | £152,265 | -5% |
49 Properties |
| 2017 | £159,490 | 20% |
54 Properties |
| 2016 | £127,316 | 6% |
87 Properties |
| 2015 | £119,473 | 6% |
62 Properties |
| 2014 | £111,775 | -3% |
67 Properties |
| 2013 | £114,999 | 17% |
47 Properties |
| 2012 | £95,557 | -25% |
26 Properties |
| 2011 | £119,455 | -5% |
29 Properties |
| 2010 | £125,448 | 17% |
24 Properties |
| 2009 | £103,835 | -14% |
32 Properties |
| 2008 | £118,372 | -20% |
24 Properties |
| 2007 | £141,704 | 12% |
88 Properties |
| 2006 | £124,871 | 6% |
90 Properties |
| 2005 | £117,164 | -0,4% |
82 Properties |
| 2004 | £117,636 | 25% |
84 Properties |
| 2003 | £88,667 | 27% |
83 Properties |
| 2002 | £64,504 | 17% |
105 Properties |
| 2001 | £53,687 | 2% |
91 Properties |
| 2000 | £52,806 | 19% |
82 Properties |
| 1999 | £42,991 | 20% |
83 Properties |
| 1998 | £34,420 | 14% |
84 Properties |
| 1997 | £29,718 | -13% |
59 Properties |
| 1996 | £33,436 | -5% |
54 Properties |
| 1995 | £35,236 | - |
53 Properties |
Property Price per Property Type in Harwich East
Here you can find historic sold price data in order to help with your property search.
The average Property Paid Price for specific property types in the last three years are:
| Property Type | Average Sold Price | Sold Properties |
|---|---|---|
| Semi Detached House | £218,714.00 | 28 Semi Detached Houses |
| Detached House | £261,250.00 | 12 Detached Houses |
| Terraced House | £184,748.00 | 108 Terraced Houses |
| Flat | £115,523.00 | 43 Flats |

