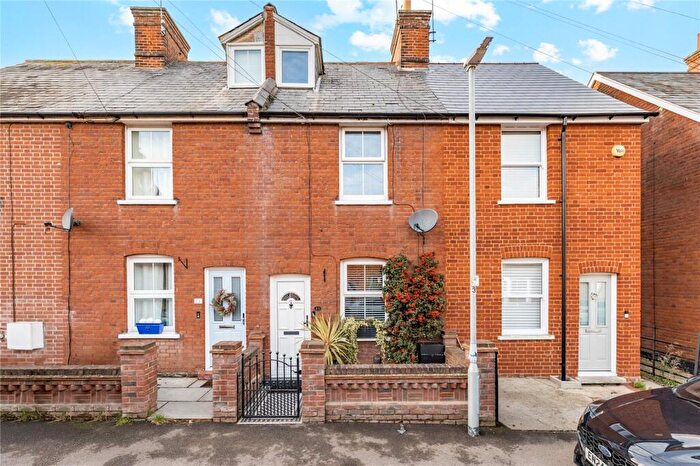
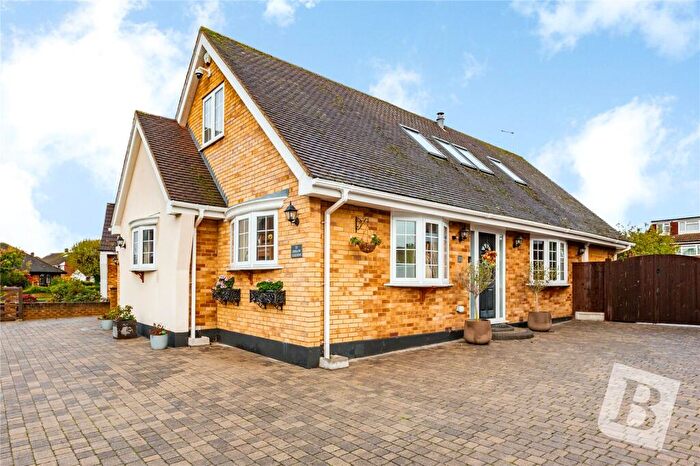
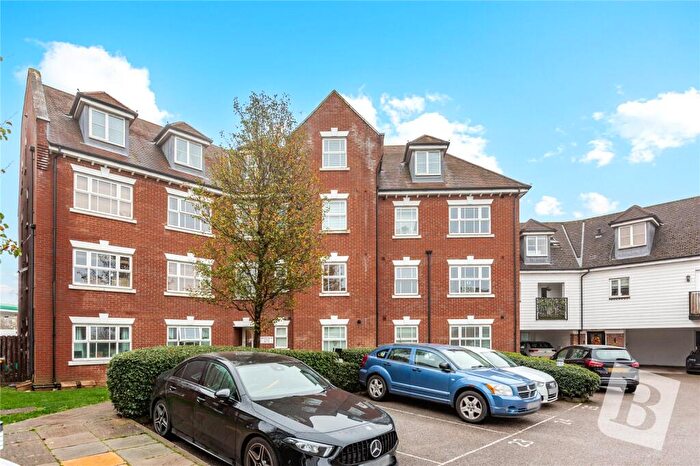
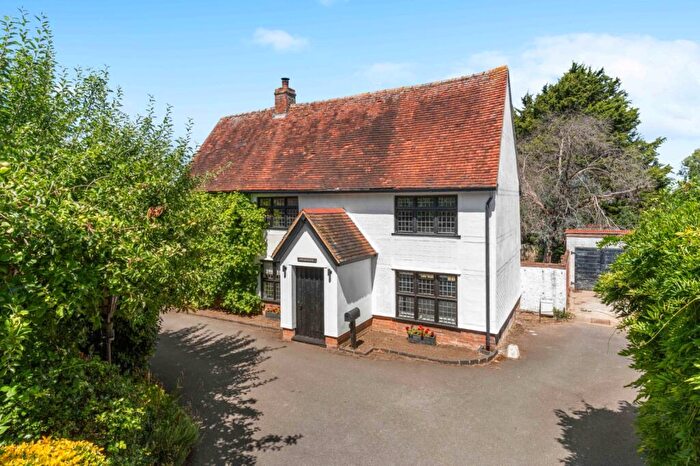
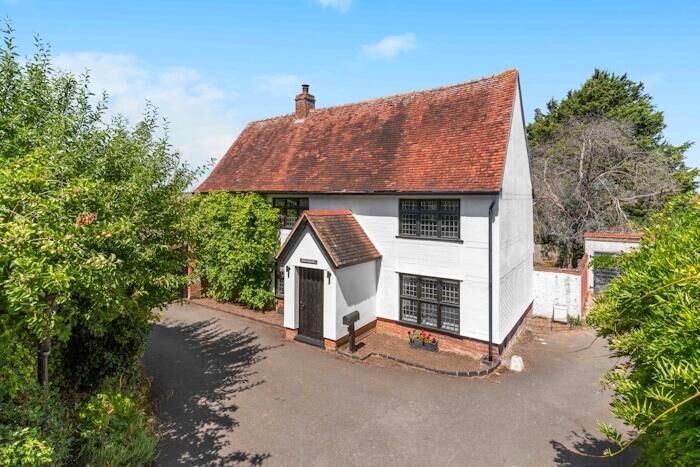
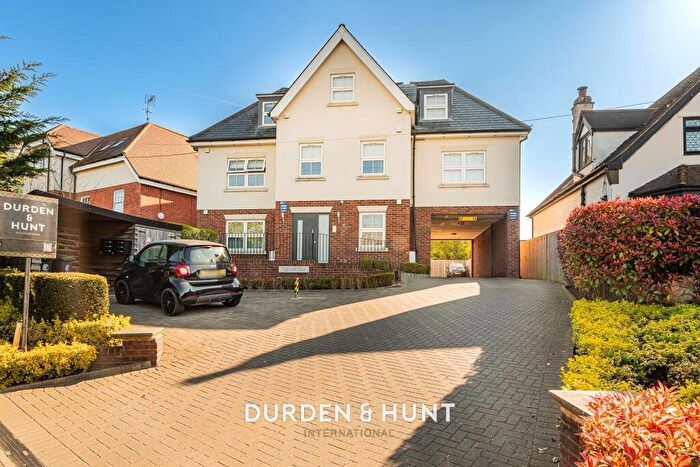
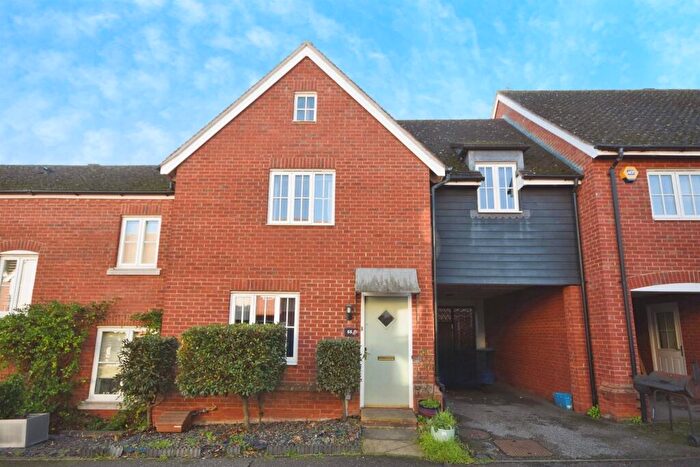
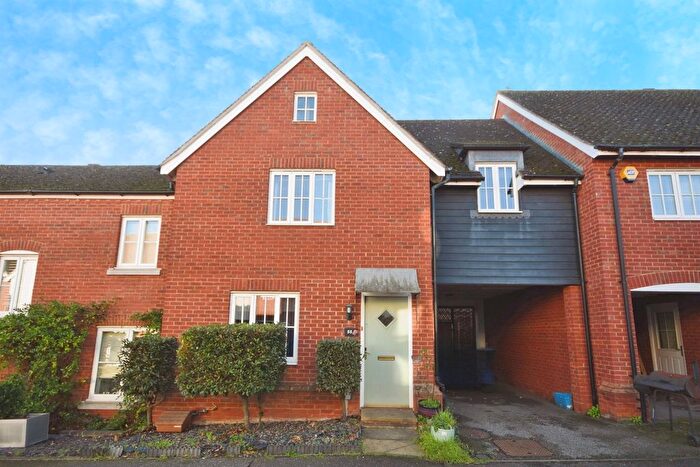
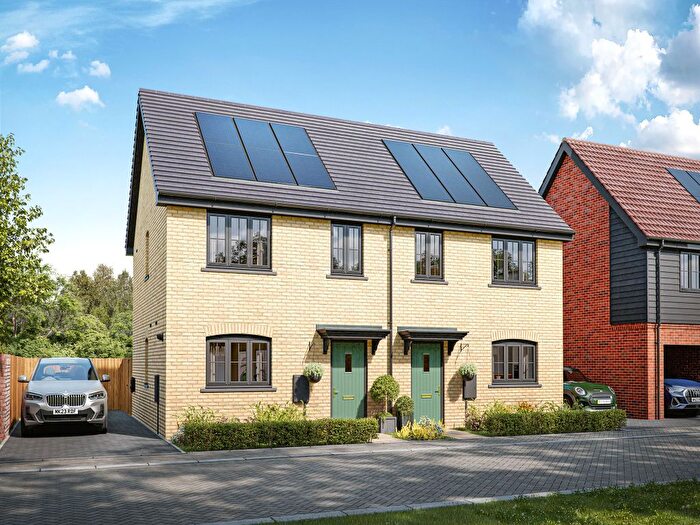
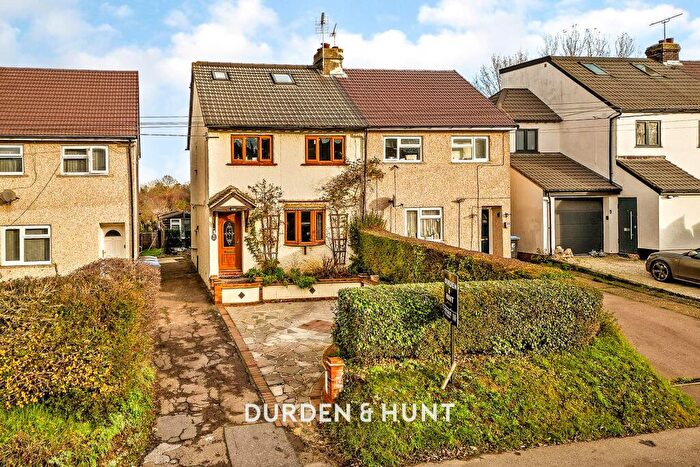
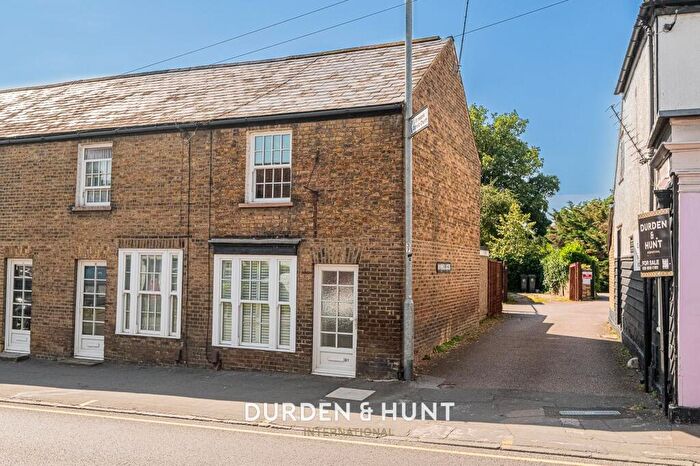
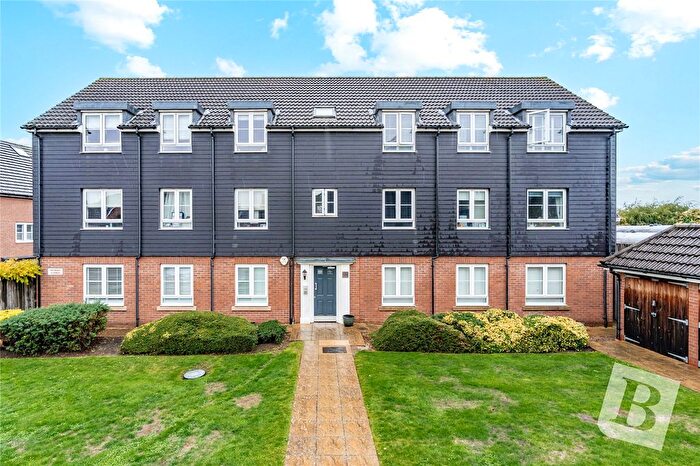
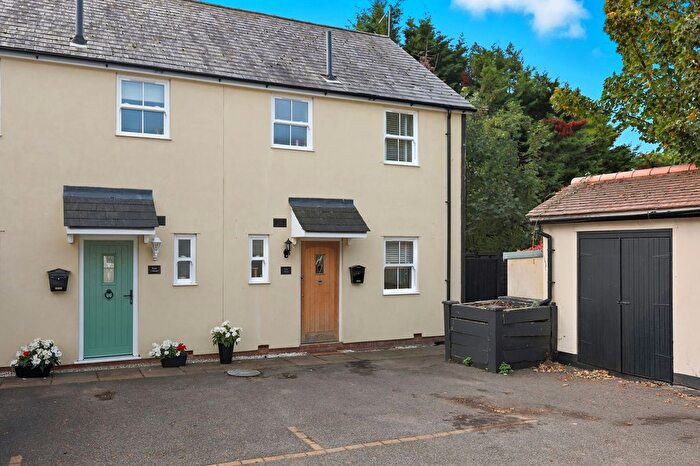
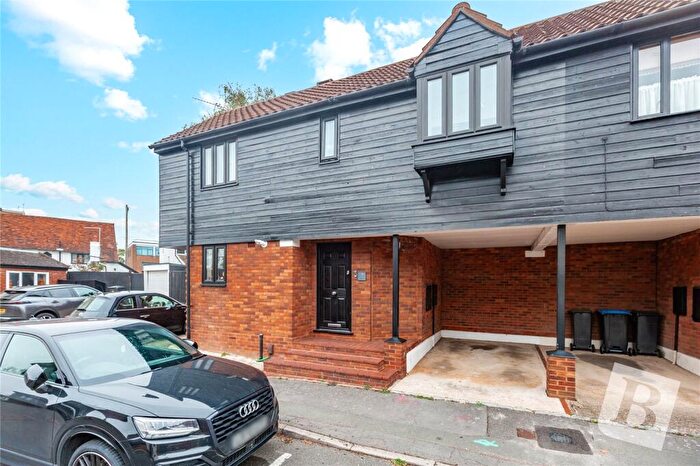
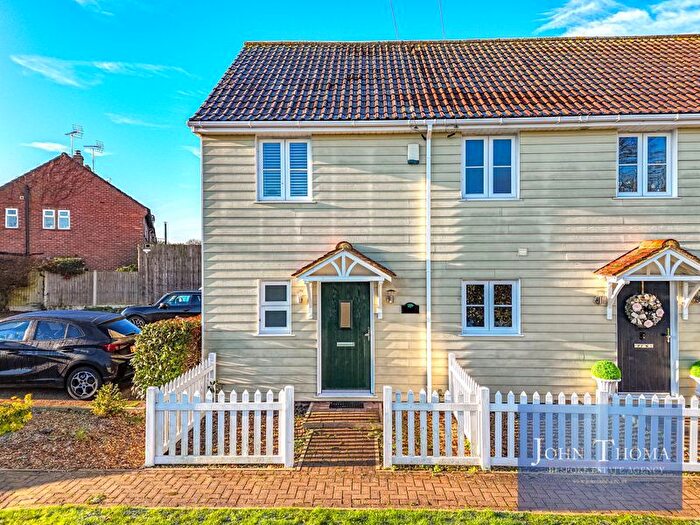
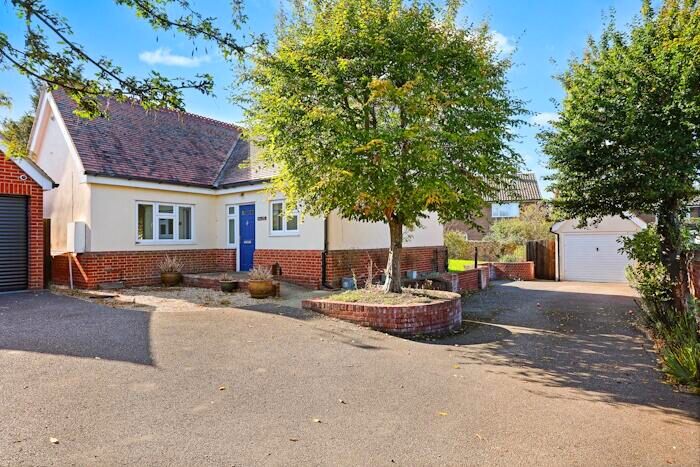
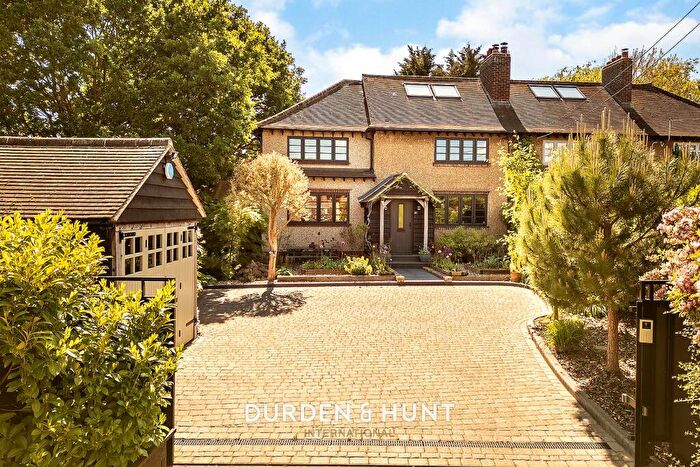
Houses for sale & to rent in Chipping Ongar, Greensted And Marden Ash, Ongar
House Prices in Chipping Ongar, Greensted And Marden Ash
Properties in Chipping Ongar, Greensted And Marden Ash have an average house price of £507,033.00 and had 281 Property Transactions within the last 3 years¹.
Chipping Ongar, Greensted And Marden Ash is an area in Ongar, Essex with 1,722 households², where the most expensive property was sold for £2,460,625.00.
Properties for sale in Chipping Ongar, Greensted And Marden Ash
Roads and Postcodes in Chipping Ongar, Greensted And Marden Ash
Navigate through our locations to find the location of your next house in Chipping Ongar, Greensted And Marden Ash, Ongar for sale or to rent.
| Streets | Postcodes |
|---|---|
| Bansons Lane | CM5 9AR CM5 9FT |
| Bansons Mews | CM5 9FA |
| Bansons Way | CM5 9AS CM5 9BS |
| Barrons Close | CM5 9BJ |
| Battle Court | CM5 9SX |
| Bowes Drive | CM5 9AU CM5 9AX |
| Brentwood Road | CM5 9DD CM5 9DH |
| Bushey Lea | CM5 9ED |
| Castle Street | CM5 9DR CM5 9JR CM5 9JS CM5 9JT CM5 9JY |
| Church Lane | CM5 9LD |
| Churchill Close | CM5 9BH |
| Cloverly Road | CM5 9BX CM5 9BY |
| Coopers Hill | CM5 9EE CM5 9EF CM5 9EG |
| Coopers Mews | CM5 9AJ |
| Crossbow Court | CM5 9SZ |
| Drapers Corner | CM5 9LS |
| Epping Road | CM5 0BA |
| Fairbank Close | CM5 9HX |
| Fairfield Road | CM5 9HJ |
| Glebe Road | CM5 9HW |
| Great Lawn | CM5 0AA |
| Great Stony Park | CM5 0TH |
| Green Walk | CM5 9HR |
| Greensted Green | CM5 9LF CM5 9LG |
| Greensted Road | CM5 9HD CM5 9HF CM5 9LA CM5 9LE CM5 9HQ |
| High Street | CM5 9AA CM5 9AB CM5 9AE CM5 9AF CM5 9AL CM5 9BN CM5 9DS CM5 9DT CM5 9DX CM5 9EA CM5 9EB CM5 9FB CM5 9FD CM5 9JA CM5 9JD CM5 9JH CM5 9JJ CM5 9JX CM5 0AD CM5 9AD CM5 9DZ CM5 9EY CM5 9GU CM5 9GZ CM5 9JB CM5 9JG CM5 9FP |
| Hunters Chase | CM5 9DQ |
| Jacksons Close | CM5 9HU |
| Kettlebury Way | CM5 9EU CM5 9EX CM5 9HA |
| Kilnfield | CM5 9TL |
| Kingston Gardens | CM5 9FS |
| Landview Gardens | CM5 9EQ |
| Livingstone Close | CM5 9HB |
| Lodge Farm Cottages | CM5 9LB |
| Longfields | CM5 9BZ CM5 9DE CM5 9DF |
| Love Lane | CM5 9BL |
| Marden Ash Mews | CM5 9BT |
| Marks Avenue | CM5 9AY |
| Mayflower Court | CM5 9BW |
| Mayflower Way | CM5 9AZ CM5 9BA CM5 9BB |
| Mead Walk | CM5 9EN |
| Millbank Avenue | CM5 9HL |
| Oakland Mews | CM5 9QU |
| Onslow Gardens | CM5 9BG CM5 9BQ |
| Parkland Way | CM5 9EW |
| Roding View | CM5 9BE |
| Rodney Road | CM5 9HN |
| Sandon Place | CM5 9DJ |
| Shakletons | CM5 9AT |
| St James Avenue | CM5 9EL |
| St Martins Mews | CM5 9HY |
| Stanley Place | CM5 9SU |
| Stondon Road | CM5 9BU |
| The Elms | CM5 9EJ |
| The Johns | CM5 9BD |
| The Pavilions | CM5 0PX |
| The Spinney | CM5 9HP |
| The Sycamores | CM5 9GA |
| Toot Hill Road | CM5 9LH CM5 9LQ |
| Tower Court | CM5 9TB |
| Turners Close | CM5 9HH |
| Turret Court | CM5 9SY |
| Victoria Road | CM5 9FE CM5 9FG CM5 9FH CM5 9FJ CM5 9FF |
| Woodland Way | CM5 9EP CM5 9ER CM5 9ES CM5 9ET |
| CM5 0RS CM5 0WT CM5 5AH CM5 5AJ CM5 5AL CM5 5AN CM5 5AT CM5 5BB CM5 5BE CM5 5BF CM5 5BG CM5 5BJ CM5 5BL CM5 5BP CM5 5BQ CM5 5BR CM5 5BW CM5 5BX |
Transport near Chipping Ongar, Greensted And Marden Ash
-
Epping Station
-
Shenfield Station
-
Theydon Bois Station
-
Ingatestone Station
-
Brentwood Station
-
Harlow Mill Station
-
Harold Wood Station
-
Debden Station
-
Harlow Town Station
-
Sawbridgeworth Station
- FAQ
- Price Paid By Year
- Property Type Price
Frequently asked questions about Chipping Ongar, Greensted And Marden Ash
What is the average price for a property for sale in Chipping Ongar, Greensted And Marden Ash?
The average price for a property for sale in Chipping Ongar, Greensted And Marden Ash is £507,033. This amount is 11% lower than the average price in Ongar. There are 475 property listings for sale in Chipping Ongar, Greensted And Marden Ash.
What streets have the most expensive properties for sale in Chipping Ongar, Greensted And Marden Ash?
The streets with the most expensive properties for sale in Chipping Ongar, Greensted And Marden Ash are Greensted Road at an average of £2,460,625, Marden Ash Mews at an average of £1,350,000 and Greensted Green at an average of £1,090,000.
What streets have the most affordable properties for sale in Chipping Ongar, Greensted And Marden Ash?
The streets with the most affordable properties for sale in Chipping Ongar, Greensted And Marden Ash are Mayflower Court at an average of £262,593, High Street at an average of £322,114 and Bansons Way at an average of £352,750.
Which train stations are available in or near Chipping Ongar, Greensted And Marden Ash?
Some of the train stations available in or near Chipping Ongar, Greensted And Marden Ash are Shenfield, Ingatestone and Brentwood.
Which tube stations are available in or near Chipping Ongar, Greensted And Marden Ash?
Some of the tube stations available in or near Chipping Ongar, Greensted And Marden Ash are Epping, Theydon Bois and Debden.
Property Price Paid in Chipping Ongar, Greensted And Marden Ash by Year
The average sold property price by year was:
| Year | Average Sold Price | Price Change |
Sold Properties
|
|---|---|---|---|
| 2025 | £496,632 | -10% |
49 Properties |
| 2024 | £546,822 | 10% |
59 Properties |
| 2023 | £493,499 | -1% |
87 Properties |
| 2022 | £499,353 | 10% |
86 Properties |
| 2021 | £450,970 | -0,1% |
94 Properties |
| 2020 | £451,576 | -3% |
78 Properties |
| 2019 | £466,552 | 2% |
74 Properties |
| 2018 | £456,148 | 7% |
74 Properties |
| 2017 | £422,191 | -1% |
87 Properties |
| 2016 | £425,366 | 19% |
82 Properties |
| 2015 | £345,638 | 3% |
97 Properties |
| 2014 | £334,763 | -1% |
107 Properties |
| 2013 | £338,068 | 19% |
84 Properties |
| 2012 | £274,597 | -23% |
62 Properties |
| 2011 | £337,604 | 14% |
65 Properties |
| 2010 | £289,520 | 7% |
70 Properties |
| 2009 | £270,543 | -12% |
46 Properties |
| 2008 | £302,818 | 0,4% |
50 Properties |
| 2007 | £301,574 | 4% |
111 Properties |
| 2006 | £289,028 | 9% |
95 Properties |
| 2005 | £263,637 | -1% |
65 Properties |
| 2004 | £265,504 | 11% |
70 Properties |
| 2003 | £235,611 | 6% |
102 Properties |
| 2002 | £220,315 | 11% |
101 Properties |
| 2001 | £197,131 | 7% |
94 Properties |
| 2000 | £182,822 | 19% |
121 Properties |
| 1999 | £148,877 | 7% |
114 Properties |
| 1998 | £138,464 | 30% |
71 Properties |
| 1997 | £96,387 | -2% |
68 Properties |
| 1996 | £98,728 | 18% |
95 Properties |
| 1995 | £80,684 | - |
58 Properties |
Property Price per Property Type in Chipping Ongar, Greensted And Marden Ash
Here you can find historic sold price data in order to help with your property search.
The average Property Paid Price for specific property types in the last three years are:
| Property Type | Average Sold Price | Sold Properties |
|---|---|---|
| Semi Detached House | £503,211.00 | 104 Semi Detached Houses |
| Detached House | £764,572.00 | 69 Detached Houses |
| Terraced House | £461,828.00 | 49 Terraced Houses |
| Flat | £250,122.00 | 59 Flats |

