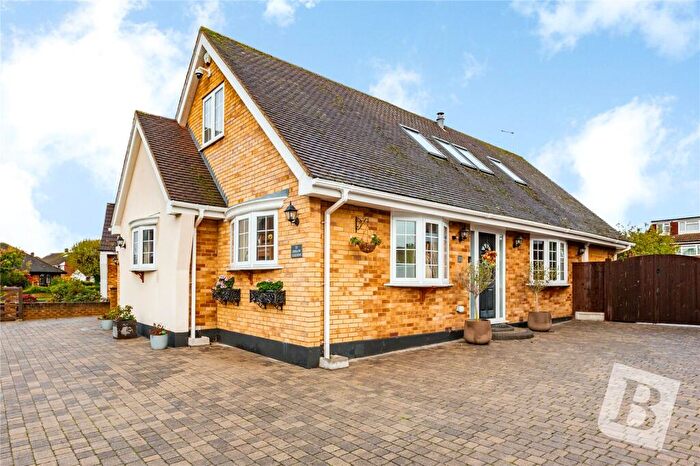
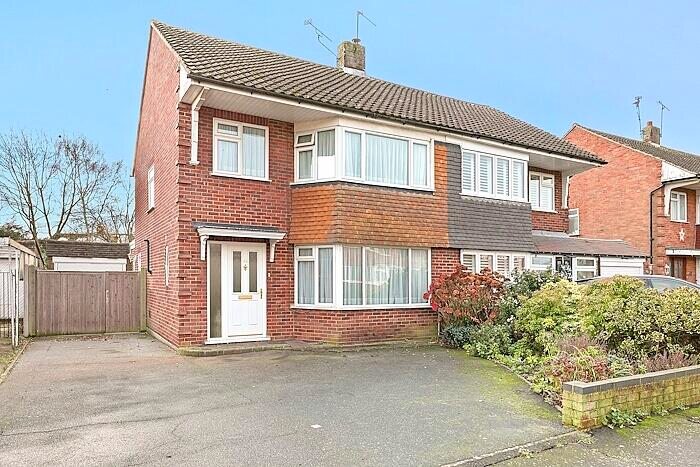
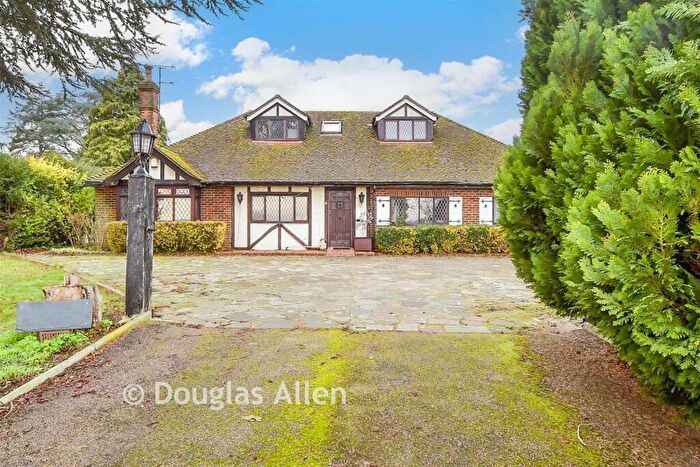
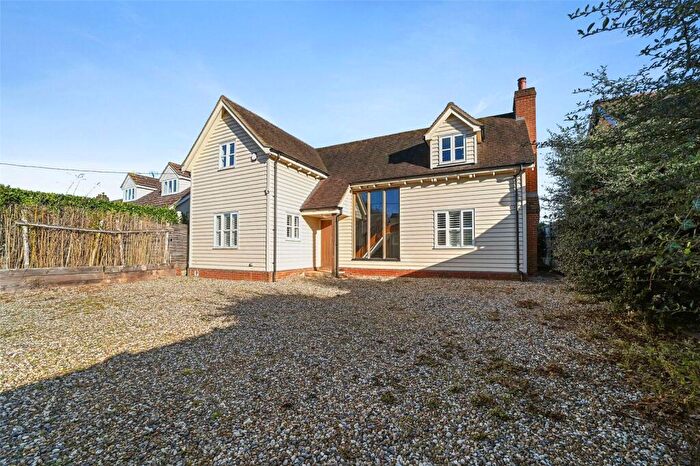
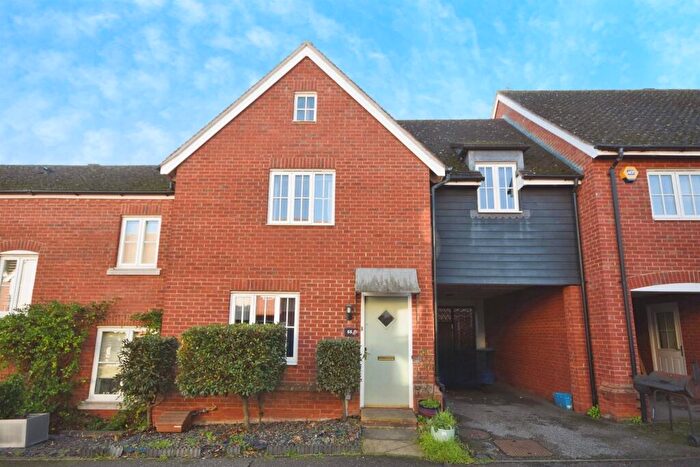
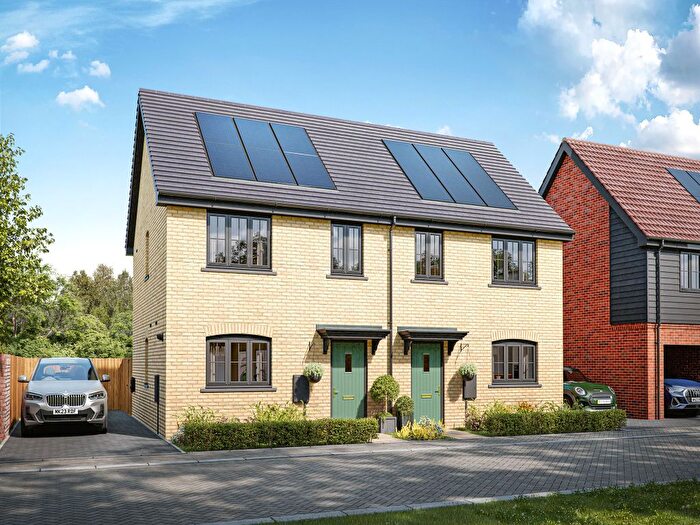
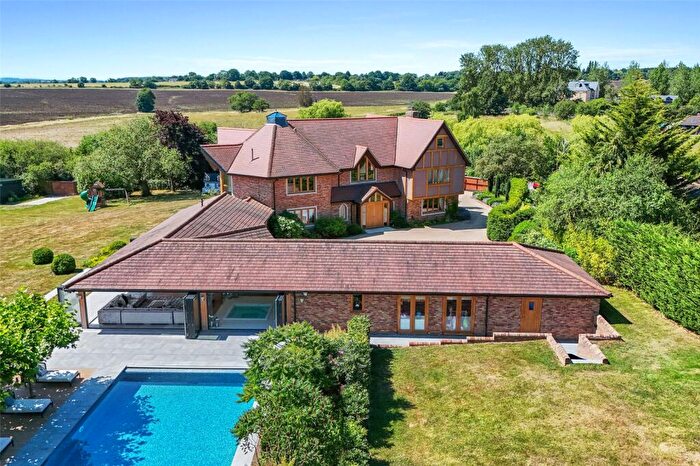
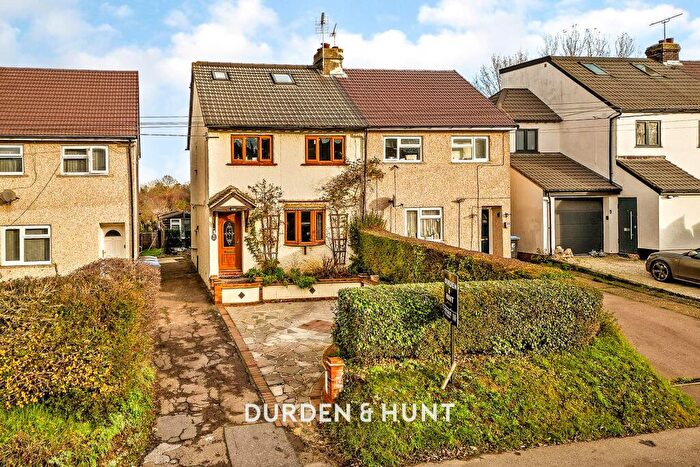
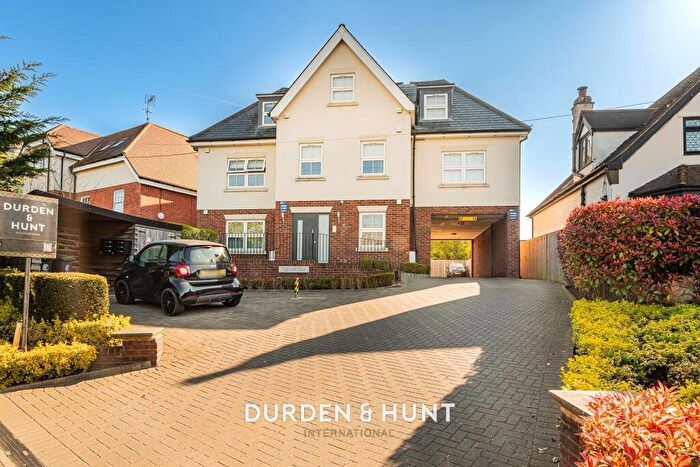
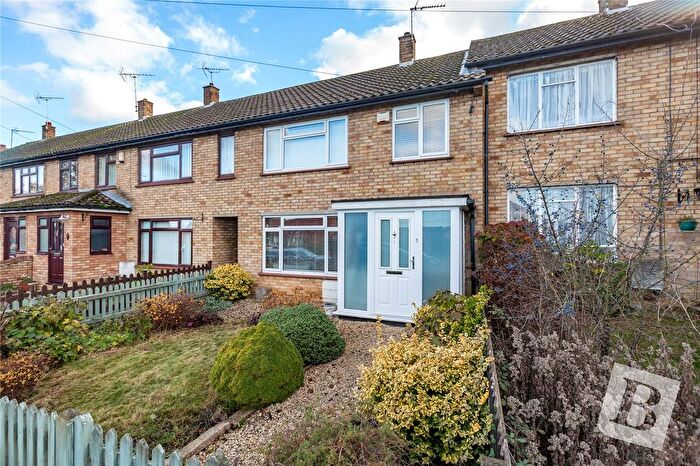
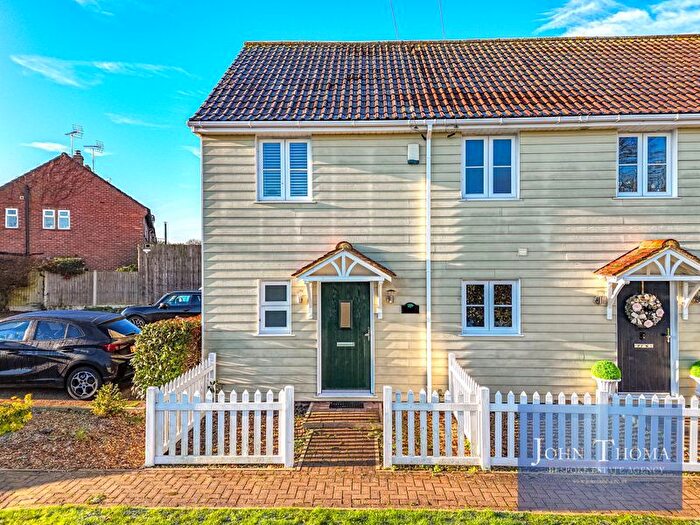
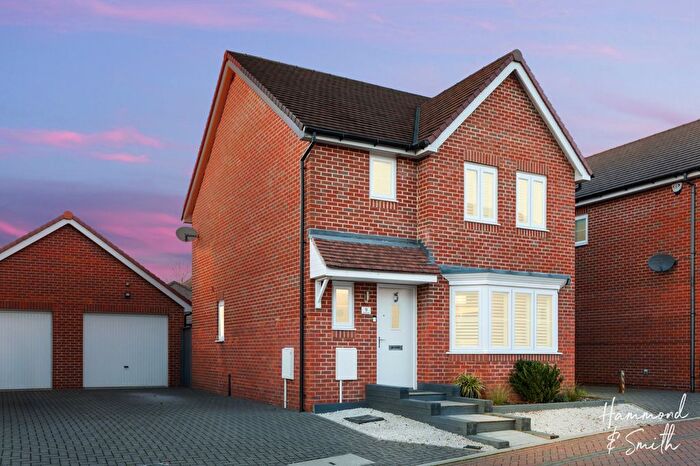
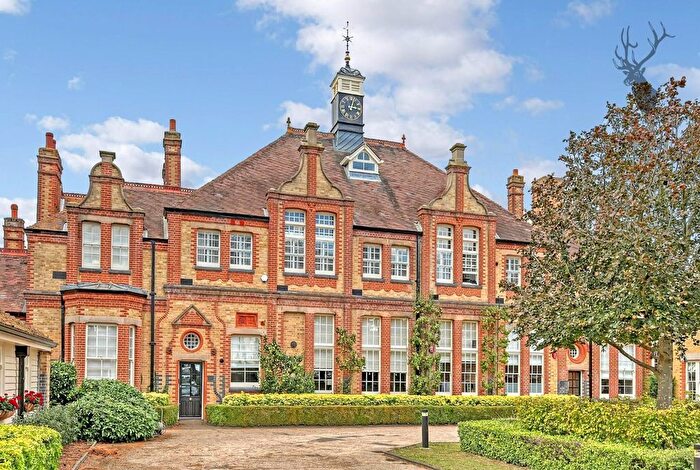
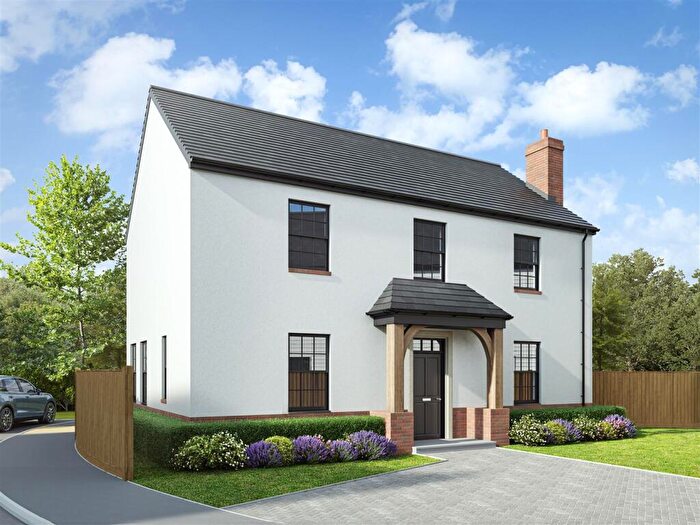
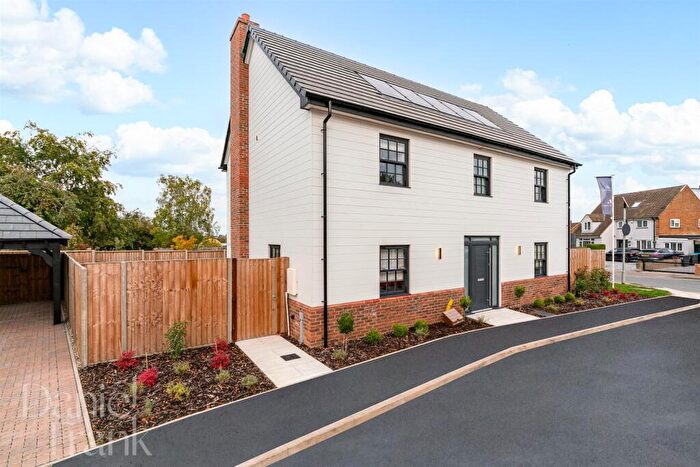
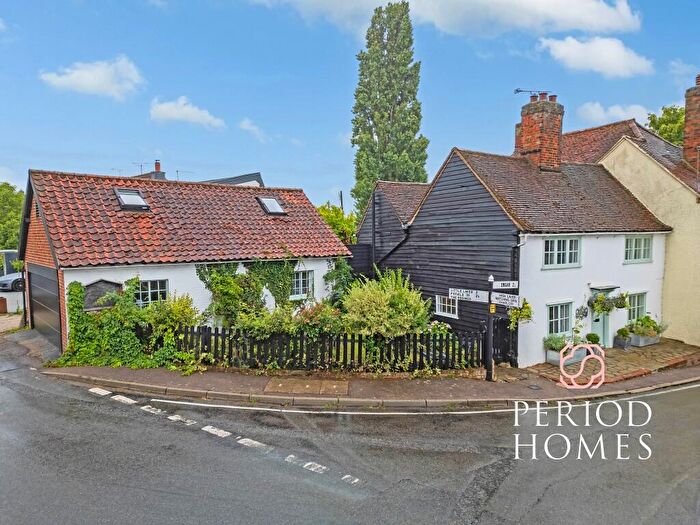
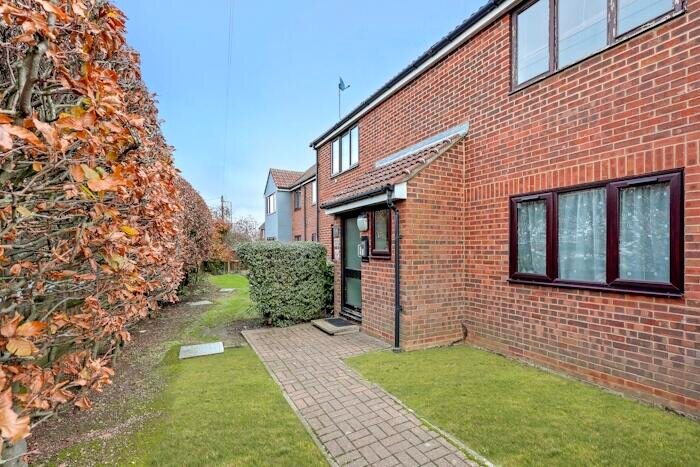
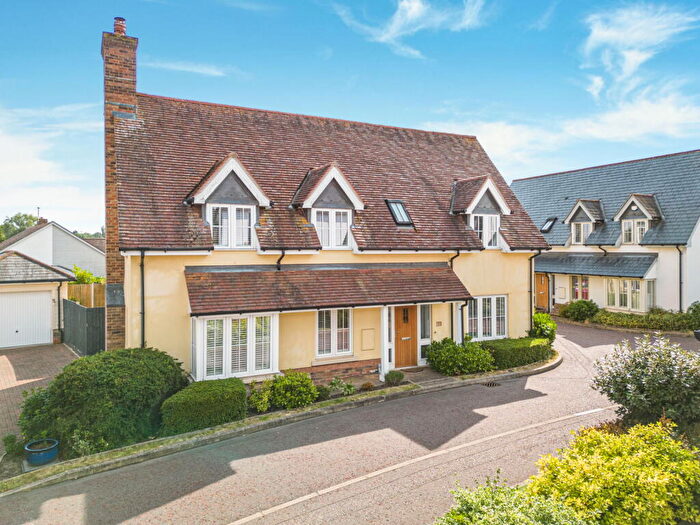
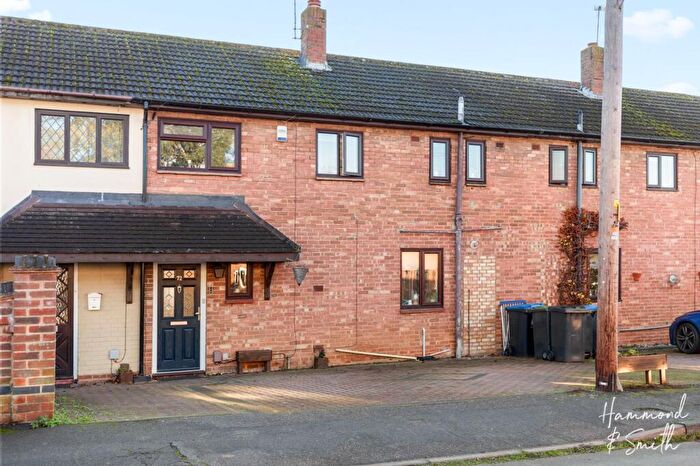
Houses for sale & to rent in Moreton And Fyfield, Ongar
House Prices in Moreton And Fyfield
Properties in Moreton And Fyfield have an average house price of £861,200.00 and had 62 Property Transactions within the last 3 years¹.
Moreton And Fyfield is an area in Ongar, Essex with 705 households², where the most expensive property was sold for £2,500,000.00.
Properties for sale in Moreton And Fyfield
Roads and Postcodes in Moreton And Fyfield
Navigate through our locations to find the location of your next house in Moreton And Fyfield, Ongar for sale or to rent.
| Streets | Postcodes |
|---|---|
| Abbey Close | CM5 0TR |
| Ashlyns Cottages | CM5 0NB |
| Ashlyns Lane | CM5 0ND |
| Bowlers Green | CM5 0ET |
| Bridge Road | CM5 0LJ |
| Cannons Lane | CM5 0SE CM5 0SF CM5 0SG CM5 0TG |
| Church Road | CM5 0HZ CM5 0JB CM5 0JD CM5 0JA |
| Corner Cottages | CM5 0LQ |
| Cross Lees | CM5 0HX |
| Dacres Gate | CM5 0NQ |
| Dunmow Road | CM5 0NN CM5 0NW CM5 0RH CM5 0NP CM5 0NR |
| Elmbridge Hall | CM5 0TN |
| Epping Road | CM5 0DF CM5 0DE |
| Faggotters Lane | CM5 0DY |
| Forest Drive | CM5 0TP |
| Fyfield Grange | CM5 0FE |
| Fyfield Road | CM5 0HN CM5 0HY |
| Gainsthorpe Road | CM5 0NF CM5 0NG |
| Gould Close | CM5 0LG |
| Harlow Road | CM5 0DL CM5 0DR CM5 0LD CM5 0LH CM5 0DT |
| Herons Lane | CM5 0RQ |
| Hobbans Farm Chase | CM5 0LX |
| Houchin Drive | CM5 0RF |
| Lake View | CM5 0GQ |
| Lampetts Cottages | CM5 0HT |
| Little Laver Road | CM5 0JE |
| Lower Bovinger Green | CM5 0NE |
| Maltings Hill | CM5 0JY |
| Mill Lane | CM5 0DN CM5 0DW |
| Moreton Bridge | CM5 0LL CM5 0LN |
| Moreton Gates | CM5 0GP |
| Moreton Mill | CM5 0DP |
| Moreton Road | CM5 0HS CM5 0HU CM5 0LU CM5 0EY CM5 0LT |
| Newhouse Lane | CM5 0DH CM5 0DJ |
| Norwood End | CM5 0RL CM5 0RN CM5 0RW CM5 0RJ |
| Ongar Road | CM5 0HP CM5 0RB CM5 0RD |
| Pedlars End | CM5 0LR CM5 0LW CM5 0LP |
| Pensons Lane | CM5 9GW CM5 9LP |
| Queen Street | CM5 0RY CM5 0RZ |
| Roding Close | CM5 0RE |
| Rolls Cottages | CM5 0EL |
| School Lane | CM5 0EE |
| Station Bridge Mews | CM5 9FN |
| Stoney Lane | CM5 0DG |
| Stony Lane | CM5 0LZ CM5 0DQ |
| The Glebe | CM5 0EQ |
| The Hoppitt | CM5 0LB |
| The Poplars | CM5 0EJ |
| Tilegate Road | CM5 0ED |
| Walker Avenue | CM5 0RG |
| Willingale Road | CM5 0SB CM5 0SD CM5 0PY |
| Wind Hill | CM5 0EX |
| Workers Road | CM5 0DZ |
| CM5 0DS CM5 0DU CM5 0EA CM5 0EB CM5 0EF CM5 0EG CM5 0EH CM5 0EP CM5 0ER CM5 0ES CM5 0EW CM5 0JF CM5 0JH CM5 0JQ CM5 0LE CM5 0LF CM5 0NA CM5 0DX CM5 0EN CM5 0EU CM5 0JG CM5 0NS |
Transport near Moreton And Fyfield
-
Harlow Mill Station
-
Sawbridgeworth Station
-
Epping Station
-
Harlow Town Station
-
Theydon Bois Station
-
Ingatestone Station
-
Roydon Station
-
Shenfield Station
-
Bishops Stortford Station
-
Debden Station
- FAQ
- Price Paid By Year
- Property Type Price
Frequently asked questions about Moreton And Fyfield
What is the average price for a property for sale in Moreton And Fyfield?
The average price for a property for sale in Moreton And Fyfield is £861,200. This amount is 51% higher than the average price in Ongar. There are 752 property listings for sale in Moreton And Fyfield.
What streets have the most expensive properties for sale in Moreton And Fyfield?
The streets with the most expensive properties for sale in Moreton And Fyfield are Workers Road at an average of £1,752,500, Harlow Road at an average of £1,530,000 and Ashlyns Lane at an average of £1,275,000.
What streets have the most affordable properties for sale in Moreton And Fyfield?
The streets with the most affordable properties for sale in Moreton And Fyfield are Cannons Lane at an average of £474,250, Mill Lane at an average of £525,000 and Newhouse Lane at an average of £570,000.
Which train stations are available in or near Moreton And Fyfield?
Some of the train stations available in or near Moreton And Fyfield are Harlow Mill, Sawbridgeworth and Harlow Town.
Which tube stations are available in or near Moreton And Fyfield?
Some of the tube stations available in or near Moreton And Fyfield are Epping, Theydon Bois and Debden.
Property Price Paid in Moreton And Fyfield by Year
The average sold property price by year was:
| Year | Average Sold Price | Price Change |
Sold Properties
|
|---|---|---|---|
| 2025 | £773,631 | -23% |
11 Properties |
| 2024 | £948,892 | 3% |
14 Properties |
| 2023 | £920,230 | 11% |
13 Properties |
| 2022 | £818,208 | -11% |
24 Properties |
| 2021 | £907,820 | -1% |
31 Properties |
| 2020 | £913,761 | 28% |
22 Properties |
| 2019 | £655,076 | 18% |
20 Properties |
| 2018 | £538,571 | -44% |
21 Properties |
| 2017 | £776,541 | 11% |
24 Properties |
| 2016 | £691,922 | -4% |
20 Properties |
| 2015 | £721,856 | 30% |
28 Properties |
| 2014 | £505,806 | 10% |
31 Properties |
| 2013 | £453,958 | -12% |
25 Properties |
| 2012 | £510,684 | 14% |
19 Properties |
| 2011 | £436,939 | -22% |
15 Properties |
| 2010 | £533,329 | 7% |
27 Properties |
| 2009 | £497,104 | -26% |
12 Properties |
| 2008 | £625,278 | 4% |
25 Properties |
| 2007 | £599,505 | 33% |
36 Properties |
| 2006 | £399,934 | -5% |
23 Properties |
| 2005 | £419,445 | -14% |
23 Properties |
| 2004 | £476,837 | 22% |
40 Properties |
| 2003 | £372,093 | 9% |
31 Properties |
| 2002 | £337,140 | -4% |
35 Properties |
| 2001 | £349,844 | 26% |
28 Properties |
| 2000 | £257,564 | -6% |
47 Properties |
| 1999 | £273,259 | 22% |
36 Properties |
| 1998 | £213,557 | 4% |
18 Properties |
| 1997 | £204,708 | 15% |
17 Properties |
| 1996 | £173,568 | 34% |
22 Properties |
| 1995 | £114,971 | - |
19 Properties |
Property Price per Property Type in Moreton And Fyfield
Here you can find historic sold price data in order to help with your property search.
The average Property Paid Price for specific property types in the last three years are:
| Property Type | Average Sold Price | Sold Properties |
|---|---|---|
| Semi Detached House | £584,525.00 | 20 Semi Detached Houses |
| Detached House | £1,070,248.00 | 36 Detached Houses |
| Terraced House | £529,166.00 | 6 Terraced Houses |

