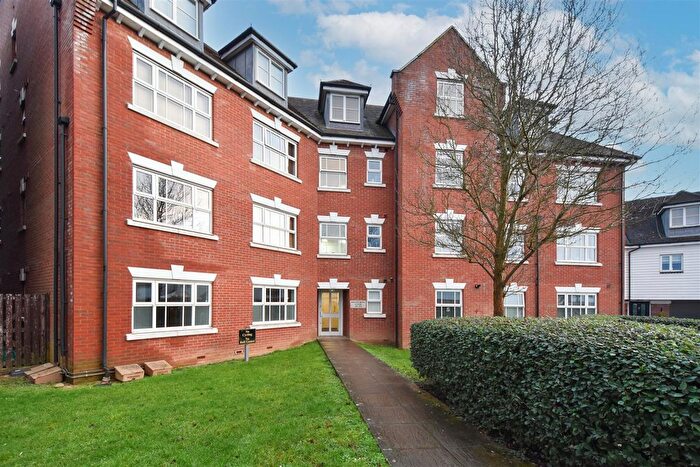
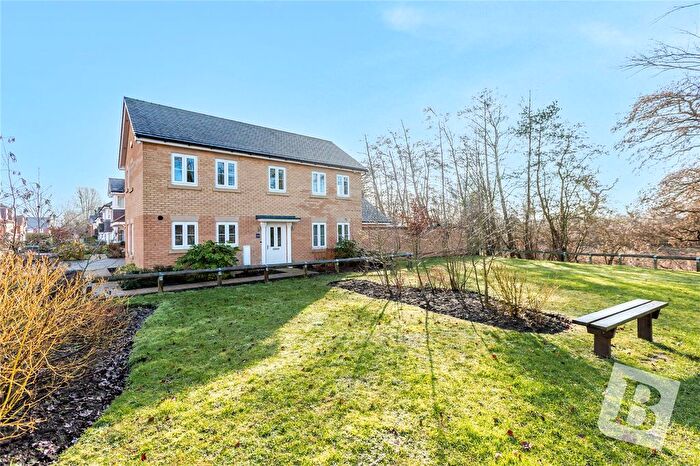
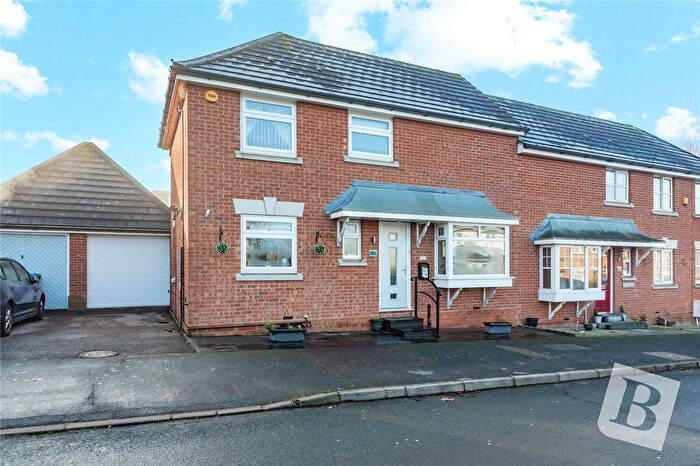
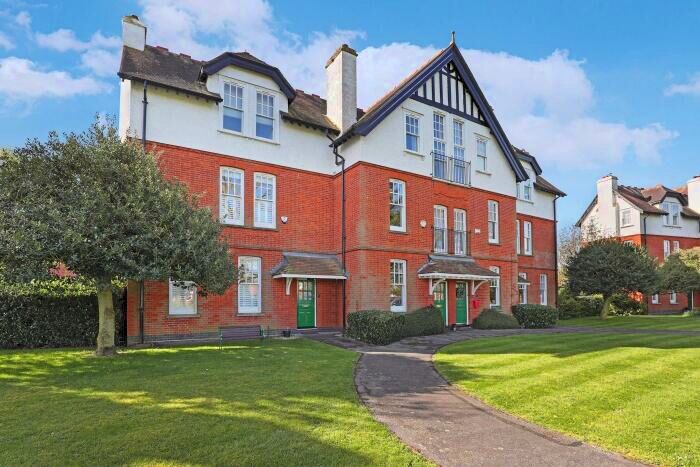
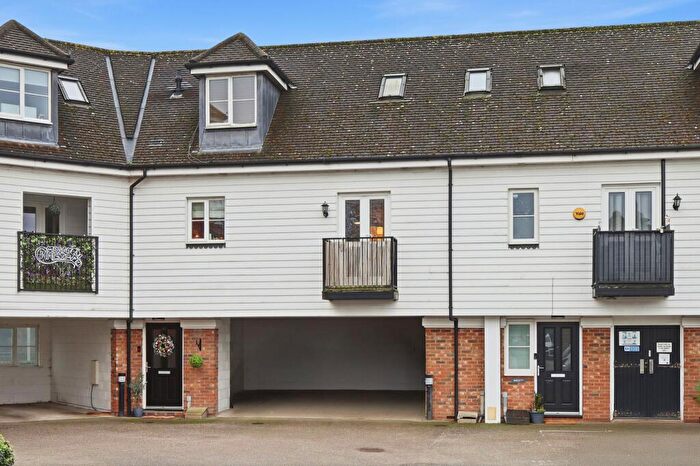
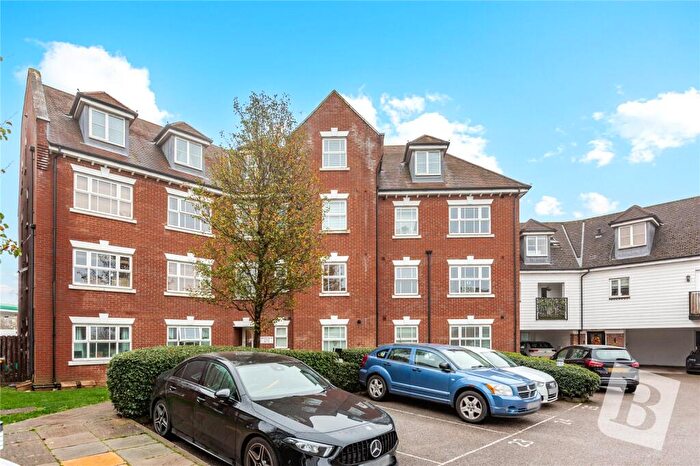
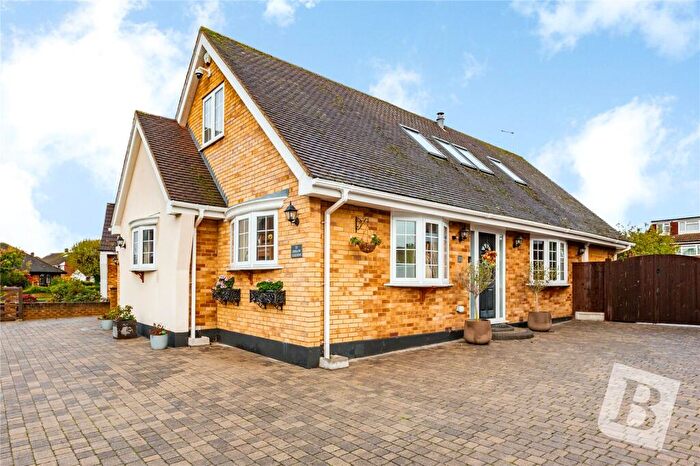
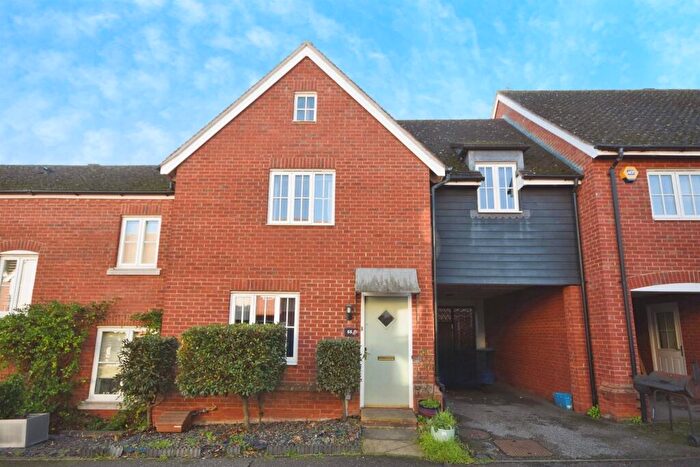
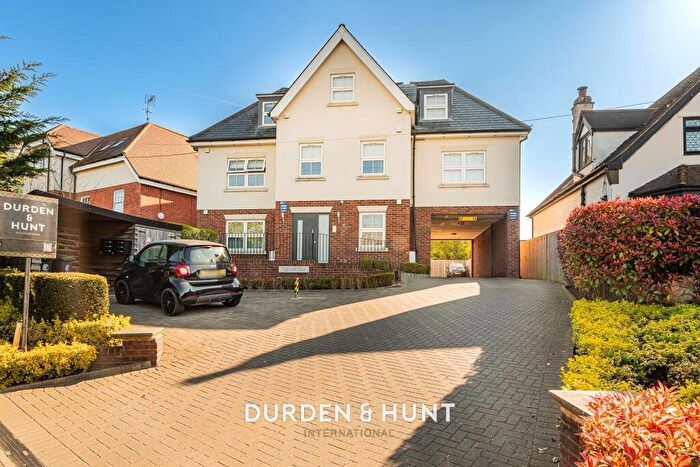
Houses for sale & to rent in Shelley, Ongar
House Prices in Shelley
Properties in Shelley have an average house price of £418,520.00 and had 68 Property Transactions within the last 3 years¹.
Shelley is an area in Ongar, Essex with 897 households², where the most expensive property was sold for £1,217,500.00.
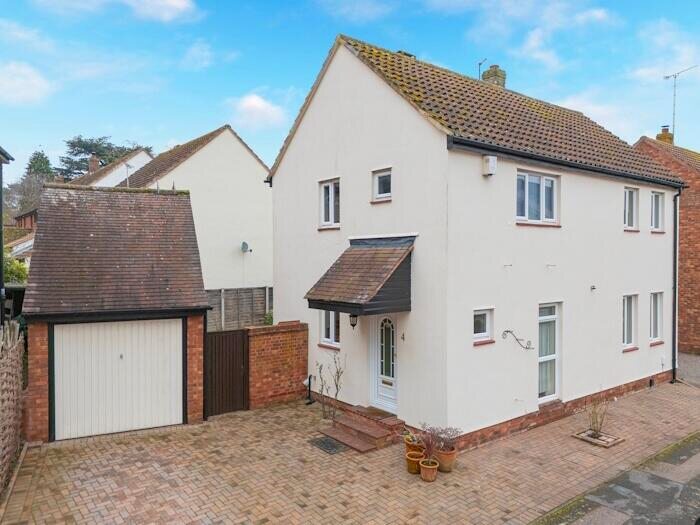
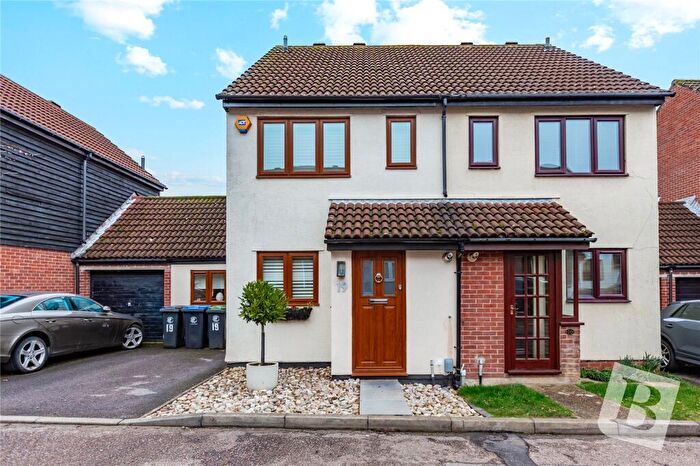
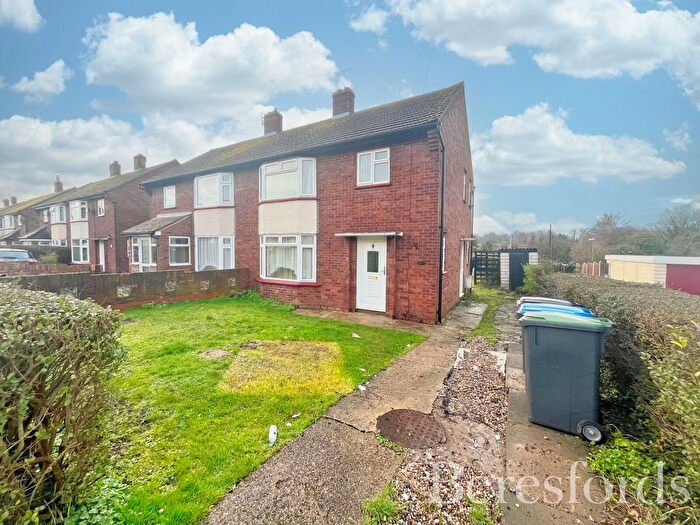
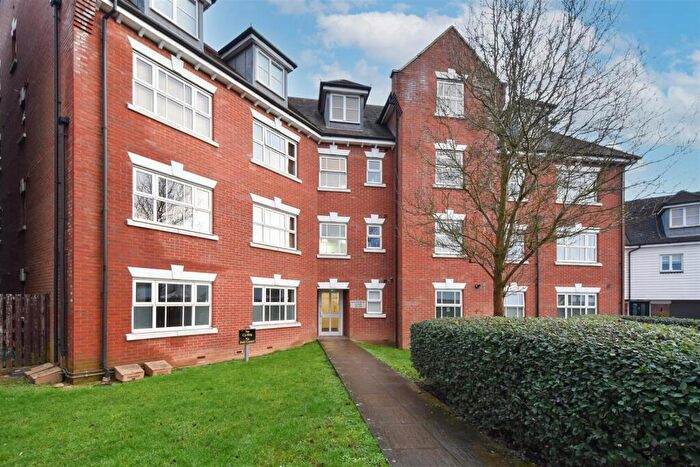
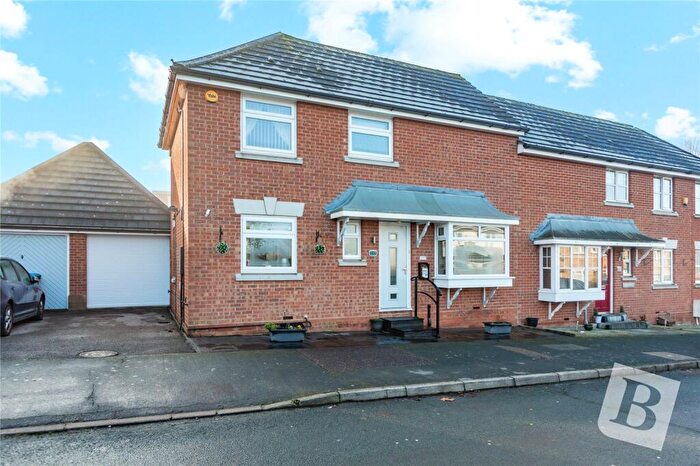
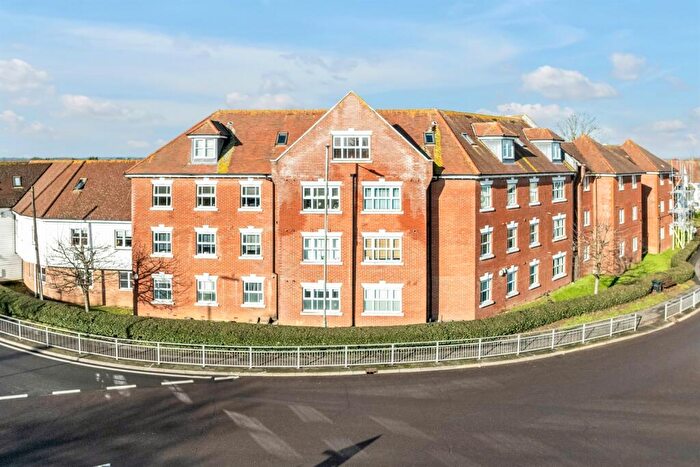
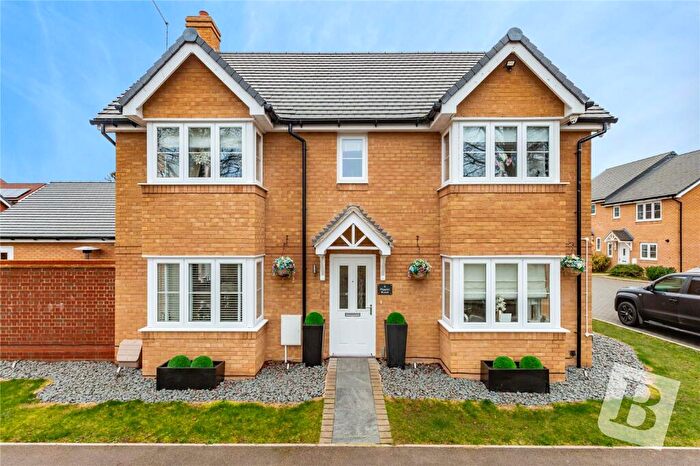
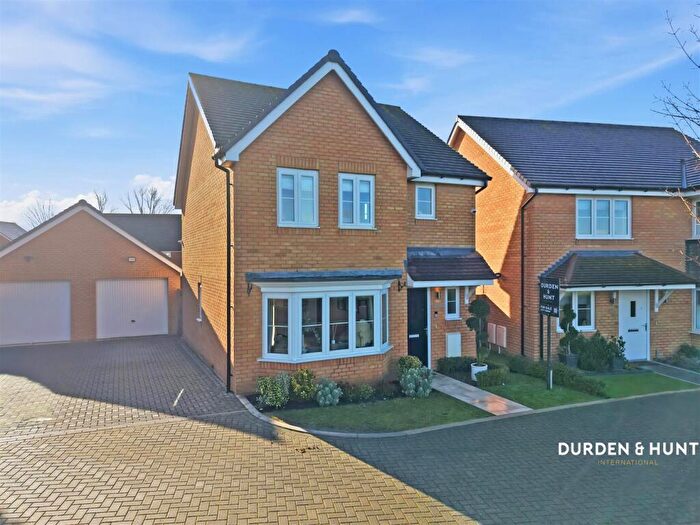
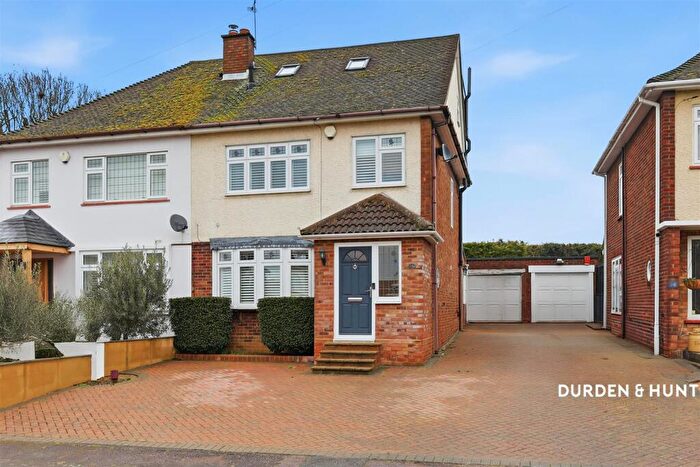
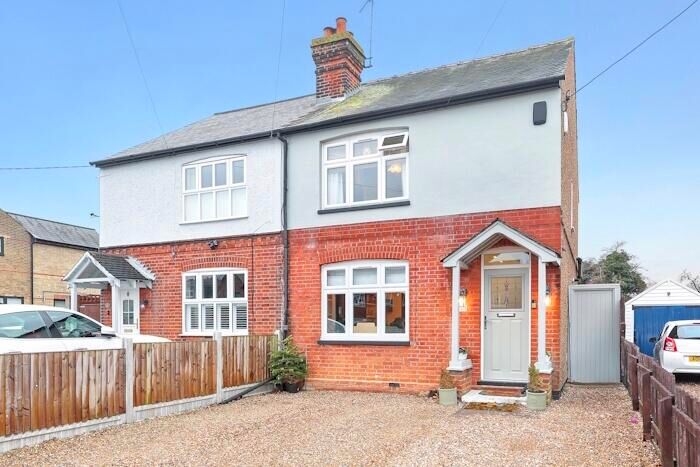
Properties for sale in Shelley
Roads and Postcodes in Shelley
Navigate through our locations to find the location of your next house in Shelley, Ongar for sale or to rent.
| Streets | Postcodes |
|---|---|
| Abigail Court | CM5 0AZ |
| Acres Avenue | CM5 0BH CM5 0BJ |
| Aukingford Gardens | CM5 0BG |
| Aukingford Green | CM5 0BY |
| Barker Way | CM5 0FJ |
| Betjeman Way | CM5 0FG |
| Bewlay Close | CM5 0FW |
| Brookfields | CM5 0AS |
| Chelmsford Road | CM5 9LX |
| Coles Close | CM5 0AX |
| Cripsey Avenue | CM5 0AT CM5 0AU CM5 0GW |
| Elstar Road | CM5 0FQ CM5 0FR |
| Epping Road | CM5 0BD CM5 0BE CM5 0DD |
| Finch Court | CM5 0AY |
| Fyfield Road | CM5 0AE CM5 0AF CM5 0AG CM5 0AH CM5 0AJ CM5 0AL CM5 0AN CM5 0AQ CM5 0GL CM5 0GN CM5 0GS CM5 0HG CM5 0HH CM5 0HJ CM5 0HL CM5 0HQ |
| High Ongar Road | CM5 9LY |
| Kimptons Close | CM5 0BQ |
| Kings Terrace | CM5 0AB |
| Milton Crescent | CM5 0FF |
| Moreton Road | CM5 0AP CM5 0AR CM5 0EZ |
| Orchard End | CM5 0DA |
| Pippin Road | CM5 0FS |
| Queens Terrace | CM5 0BZ |
| Queensway | CM5 0BN CM5 0BP CM5 0BS |
| Shelley Close | CM5 0BX |
| Shortlands Avenue | CM5 0BL |
| Springfield Close | CM5 0BB |
| St Peters Avenue | CM5 0BT CM5 0BU |
| The Gables | CM5 0GA |
| Walter Mead Close | CM5 0BW |
| CM5 0FH |
Transport near Shelley
-
Epping Station
-
Theydon Bois Station
-
Ingatestone Station
-
Shenfield Station
-
Harlow Mill Station
-
Brentwood Station
-
Sawbridgeworth Station
-
Harlow Town Station
-
Debden Station
-
Harold Wood Station
- FAQ
- Price Paid By Year
- Property Type Price
Frequently asked questions about Shelley
What is the average price for a property for sale in Shelley?
The average price for a property for sale in Shelley is £418,520. This amount is 27% lower than the average price in Ongar. There are 359 property listings for sale in Shelley.
What streets have the most expensive properties for sale in Shelley?
The streets with the most expensive properties for sale in Shelley are Springfield Close at an average of £642,500, Fyfield Road at an average of £610,000 and Elstar Road at an average of £562,500.
What streets have the most affordable properties for sale in Shelley?
The streets with the most affordable properties for sale in Shelley are Abigail Court at an average of £144,875, Shelley Close at an average of £170,000 and Epping Road at an average of £302,000.
Which train stations are available in or near Shelley?
Some of the train stations available in or near Shelley are Ingatestone, Shenfield and Harlow Mill.
Which tube stations are available in or near Shelley?
Some of the tube stations available in or near Shelley are Epping, Theydon Bois and Debden.
Property Price Paid in Shelley by Year
The average sold property price by year was:
| Year | Average Sold Price | Price Change |
Sold Properties
|
|---|---|---|---|
| 2025 | £482,991 | 11% |
14 Properties |
| 2024 | £431,983 | 16% |
31 Properties |
| 2023 | £361,130 | -21% |
23 Properties |
| 2022 | £438,019 | 6% |
34 Properties |
| 2021 | £410,380 | -21% |
50 Properties |
| 2020 | £496,163 | 8% |
47 Properties |
| 2019 | £455,029 | 9% |
49 Properties |
| 2018 | £413,809 | 19% |
43 Properties |
| 2017 | £336,028 | 11% |
35 Properties |
| 2016 | £298,195 | 1% |
43 Properties |
| 2015 | £294,673 | -2% |
47 Properties |
| 2014 | £299,115 | 10% |
38 Properties |
| 2013 | £270,609 | 22% |
27 Properties |
| 2012 | £210,247 | -22% |
24 Properties |
| 2011 | £257,362 | 4% |
24 Properties |
| 2010 | £246,531 | 19% |
16 Properties |
| 2009 | £198,775 | -44% |
8 Properties |
| 2008 | £286,027 | 12% |
18 Properties |
| 2007 | £252,853 | -2% |
49 Properties |
| 2006 | £257,903 | -6% |
97 Properties |
| 2005 | £273,926 | 16% |
55 Properties |
| 2004 | £229,961 | 25% |
38 Properties |
| 2003 | £172,062 | 1% |
28 Properties |
| 2002 | £169,491 | 32% |
36 Properties |
| 2001 | £116,096 | -17% |
28 Properties |
| 2000 | £135,770 | 28% |
24 Properties |
| 1999 | £98,192 | 11% |
41 Properties |
| 1998 | £87,197 | 7% |
18 Properties |
| 1997 | £80,865 | 13% |
35 Properties |
| 1996 | £70,176 | 8% |
25 Properties |
| 1995 | £64,507 | - |
42 Properties |
Property Price per Property Type in Shelley
Here you can find historic sold price data in order to help with your property search.
The average Property Paid Price for specific property types in the last three years are:
| Property Type | Average Sold Price | Sold Properties |
|---|---|---|
| Semi Detached House | £415,802.00 | 31 Semi Detached Houses |
| Detached House | £635,681.00 | 11 Detached Houses |
| Terraced House | £382,361.00 | 18 Terraced Houses |
| Flat | £211,812.00 | 8 Flats |

